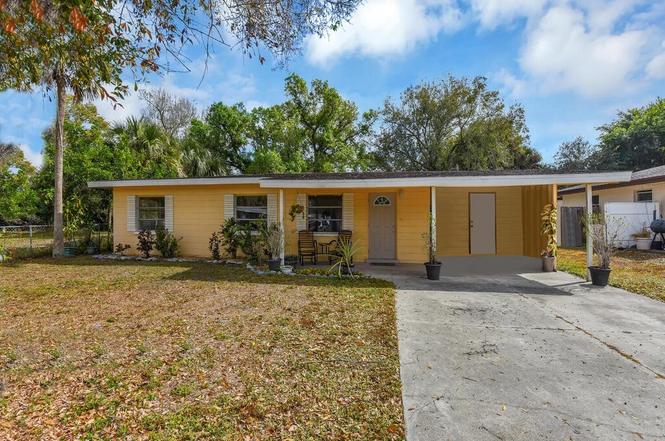
2124 E Gardenia Cir · North Fort Myers, FL
Flood risk 6/10 · Moderate
- FEMA flood zone
- AE
- Chance of flooding over 30 yrs
- 0.56%
- Est. flood insurance / yr
- $1,737 – $8,500
Fire risk 5/10 · Moderate
- Est. fire insurance / yr
- $947 – $1,759
Heat risk 10/10 · Severe
- Hot days now (above 107°F)
- 7 days/yr
- Hot days in 30 yrs
- 29 days/yr
Wind risk 10/10 · Severe
- Chance of severe wind over 30 yrs
- 99.0%
Air-quality risk 2/10 · Minimal
- Unhealthy air days now
- 1 days/yr
- Unhealthy air days in 30 yrs
- 1 days/yr
Risk factors via First Street. Map © Google.
Why this score? — see what drove the C+ grade
The composite is a weighted blend of 9 inputs, each scored 0–100. Each bar is that input's sub-score; the figure is the points it added to the 100-point composite (weight × sub-score).
- Cash flow +23.4/30.0
- ARV discount +15.0/15.0
- DSCR +7.5/10.0
- 1% rule +4.8/10.0
- Schools +4.1/10.0
- Livability +3.7/5.0
- Rent growth +3.2/5.0
- Condition / age +2.5/5.0
- Appreciation +0.0/10.0
$200,000
🖨 Deal sheet (PDF) 📄 Offer letter ✓ Due diligence
Listing remarks
Wonderful layout! This single family home is deceptive from the curb, it is has a SPRAWLING floor plan. Plenty of room for every member of the family, PLUS a huge backyard giving you tons of space to create a stunning outdoor living area. Inside the home you will find an updated kitchen, living room, dining room, large laundry room, family room w/ sliders leading to the backyard, 3 bedrooms all w/ large closets, and an updated full bath. Bonus features of the home are a long driveway leading to a 1-car carport, wide covered sitting area at front entry, and mature landscaping. Situated in a highly desired non-gated neighborhood that lines the shore of the Caloosahatchee River. Conveniently l
Key facts
- 1-car carport
- Huge backyard
- Large laundry room
Tags
Property features AI
Finance
- Financial info: Pets are allowed
- HOA & community: Association amenities: cabana, storage; Association fee listed as 0
Exterior
- Parking: Driveway; Paved parking; Attached carport with 1 covered space (total two parking spaces)
- Security: Smoke detector(s)
- Utilities: Public water; Public sewer; Cable available; High-speed internet available
- Home design: Single-story home; Entry level: 1; Resale property; Faces northwest
- Construction: Block, concrete and stucco construction; Shingle roof
- Exterior features: Fenced yard; Room for a pool; Paved road access; Rectangular lot; Southeast exposure
Interior
- Kitchen: Cooktop; Range; Self-cleaning oven; Dishwasher; Refrigerator; Freezer
- Bedrooms: Includes guest quarters; Split bedroom layout
- Flooring: Carpet; Laminate
- Bathrooms: 1 full bathroom
- Heating & cooling: Central heating (electric); Central air conditioning (electric); Ceiling fan(s)
- Interior features: Eat-in kitchen; Pantry; Split bedrooms; Cable TV; Window coverings and treatments; None (other specified features not applicable)
- Laundry & utility: Washer hookup inside; Dryer hookup inside
Neighborhood map
What this means for you Summary
Snapshot
- This is a 3-bed/1.0-bath single-family listed at $200k.
Deal economics
- At list price, monthly cash flow is $-56 ($-676/yr) — negative.
- To cash-flow at today's rent, offer at most $190k (5.0% below list).
- To meet the 1% rule (rent ≥ 1% of price), the offer needs to be $196k (1.9% below list).
- Recommended offer: $182k (9.0% below list) — sets the bar for market timing.
- Cap rate 8.5% vs local median 3.6% in North Fort Myers — top-decile yield for the area; either an underpriced asset or a hidden risk that comps aren't pricing in. Stress-test before assuming the spread holds.
Location & tenants
- Location reads 74/100 on livability (#269 in FL, #4,409 nationally) — a middle-class / working-renter tenant base. Strengths: cost of living A+, housing A+, health & safety A+; Watch: employment C-, amenities F, commute F.
- Lee (suburban): math 47% / reading 50% proficiency, ranked #42 of 73 in FL (top 58%) — families likely to look elsewhere, expect single-tenant / working-renter base with shorter leases.
- Zoned schools: Sunshine Elementary School (math 38% / reading 42%, grade F, #1,491 of 2,144 statewide, top 70%, 1,301 students, 74% FRL); Oak Hammock Middle School (math 43% / reading 41%, grade D-, #340 of 571 statewide, top 61%, 1,563 students, 56% FRL); Lehigh Senior High School (math 23% / reading 45%, grade F, #394 of 667 statewide, top 60%, 2,476 students, 57% FRL).
- Market conditions: Rents rising (+2.6%/yr); 846 active listings in the ZIP; 37 comparable units currently listed for rent nearby; rentals at typical pace (median 23d on market — plan ~3-4 weeks tenant-placement turnaround); 15,411 units permitted in Lee County in 2024 (4,686 in 5+ unit buildings).
- This rent runs 43% of the median local income ($55k/yr) — at the standard rent-burdened threshold; future hikes will face affordability resistance.
Forward outlook
- Local home prices are declining (-3.0%/yr); year-one equity from $1k of loan paydown is wiped out by about $6k of value loss. Plan a longer hold.
- Lee County population projected at +44% by 2050 — long-run rental-demand tailwind backs the buy-and-hold thesis.
Negotiation context
- It's been on market 120 days — a 9% lower offer ($182k) is reasonable based on typical stale-listing flexibility.
- Current owner paid $86k; list at $200k implies a 133% gain — meaningful room to come down on a strong offer.
Risks & watch-outs
- Watch-outs: flood insurance adds $427/mo.
- Climate carrying-cost: in FEMA flood zone AE (mandatory federal flood insurance); severe wind risk, 99% chance of damaging wind over 30y; moderate wildfire risk; extreme-heat days projected 7→29/yr by 2055 (HVAC capex compounding) — expect insurance premiums to compound above CPI over the hold.
Questions for the listing agent
- What do current leases actually rent for vs. the listed asking? Can we see a recent rent roll and the last 12 months of T-12 income?
- It's been on market 120 days. Have you received any prior offers? Is the seller open to a 9% concession, seller financing, or rate buy-down credit?
- Built in 1962 — when were the roof, HVAC, electrical panel, plumbing, and water heater last replaced?
- What's the actual annual flood-insurance premium (NFIP or private), and is the property in a SFHA with mandatory coverage?
- Why hasn't it sold? Are there any deal-killer items the seller is aware of (foundation, flood, title, zoning, code violations)?
- Is there a deadline driving the sale (1031 exchange, divorce, estate, relocation)? That informs how much negotiation room exists.
- What's the average days-on-market for RENTAL listings here right now (not sales)? A rising rental-DOM trend means longer vacancies and softer asking-rent achievability than the comps imply.
- What's the recent tenant-quality profile in this submarket — average credit score on applications, eviction rate, late-payment / NSF rate, and stable-employment percentage? A property-management company in the area should have these aggregated.
- How much new for-sale + rental construction is in the pipeline within 1–3 miles? Heavy new supply typically softens prices + rents 12–24 months out; constrained supply supports both.
Investment metrics
- 1% rule
- 0.98% ✗
- Cap rate
- 8.51%
- Cash-on-cash
- 7.93%
- DSCR
- 1.35
- GRM
- 8.5
CMA / ARV
- ARV (on-the-fly)
- $302,528
- Comps found
- 3
Show comp detail 3 sales within ~0.75 mi
| Address | Dist | Beds/Ba | Sqft | Sold | Price | $/sf | Match |
|---|---|---|---|---|---|---|---|
| 16268 Horizon Rd | 0.47mi | 3/2.0 | 1,250 (-4%) | 10mo | $289,500 | $232 | 58 |
| 7589 Bonita Blvd | 0.57mi | 2/1.0 (-1) | 1,284 (-2%) | 16mo | $317,500 | $247 | 53 |
| 2263 Club House Rd | 0.72mi | 2/1.0 (-1) | 1,173 (-10%) | 4mo | $244,880 | $209 | 41 |
Match score weights: distance 35% · size 25% · config 20% · recency 20%. Top-matched comps best support the ARV.
Projected returns pro-forma
-3.0% appreciation · 2.63% rent growth · sell at horizon
- IRR
- -18.7%
- Equity multiple
- 0.35×
- Total profit
- $-36,557
- Equity at exit
- $29,821
- IRR
- -11.8%
- Equity multiple
- 0.31×
- Total profit
- $-38,738
- Equity at exit
- $17,292
Cash invested: $56,000 (down + closing). Projections, not guarantees.
Landlord ↔ Tenant lean methodology
- Overall (STATE)
- 87 Strongly Landlord-Friendly
- State Florida
- 87 Strongly Landlord-Friendly · R+3
- County
- — inherits STATE
- City
- — inherits STATE
ZIP-level market 33917
- Home prices YoY
- -30.2%
- Rents YoY
- 2.6%
- Active inventory
- 846
- Price-to-rent
- 8.5×
Monthly cashflow live
- Estimated rent
- $1,962 high interval (Pro) →
- Mortgage (P&I)
- −$1,049
- Tax from tax record
- −$47 /mo · $568/yr
- Insurance
- −$83
- Flood insurance flood zone
- −$427 /mo · $5,118/yr
- HOA
- −$0
- Vacancy / Maint / Mgmt
- −$412
- Net cashflow
- $-56
Break-even live
Sensitivity live
| Price | -10% $57 | -5% $0 | +0% $-56 | +5% $-113 | +10% $-170 |
|---|---|---|---|---|---|
| Rent | -10% $-211 | -5% $-134 | +0% $-56 | +5% $21 | +10% $99 |
| Rate | -1.0pp $44 | -0.5pp $-5 | base $-56 | +0.5pp $-108 | +1.0pp $-161 |
UW: 25.0% down · 7.5% · 30yr · 1.5% tax · 5.0% vac · 8.0% maint · 8.0% mgmt
Financing live
Cash to close
- Down payment
- $50,000
- Closing costs
- $6,000
- Reserves months
- —
- Total cash needed
- —
Loan-product check · same deal, 3 products live
Conventional
25% down · 7.5% · 30yr
- Down + closing
- —
- Monthly P&I
- —
- Monthly cashflow
- —
- DSCR
- —
- Eligible?
- —
Personal DTI + credit; lowest rate.
DSCR
20% down · 8.5% · 30yr
- Down + closing
- —
- Monthly P&I
- —
- Monthly cashflow
- —
- DSCR
- —
- Eligible?
- —
No personal income docs; deal must DSCR.
Hard money
10% down · 12.0% · 12mo
- Down + closing
- —
- Monthly P&I
- —
- Monthly cashflow
- —
- DSCR
- —
- Eligible?
- —
Short-term bridge; refi at stabilization.
Rent comps 37 comps
| Address | Beds | Baths | Sqft | Rent | $/sqft | DOM | Units | Dist |
|---|---|---|---|---|---|---|---|---|
| 10820 Firebush Cir North Fort Myers, FL | 3.0 | 2.0 | 1661 | $1,895 | $1.14 | 4d | 1 | 0.21mi |
| 16031 Enclaves Cove Dr North Fort Myers, FL | 4.0 | 2.0 | 1850 | $2,499 | $1.35 | 4d | 1 | 0.23mi |
| 16031 Enclaves Cove Dr North Fort Myers, FL | 4.0 | 2.0 | 1850 | $2,499 | $1.35 | 16d | 1 | 0.23mi |
| 10820 Marlberry Way North Fort Myers, FL | 4.0 | 2.0 | 1850 | $2,350 | $1.27 | 25d | 1 | 0.34mi |
| 10754 Marlberry Way North Fort Myers, FL | 3.0 | 2.0 | 1661 | $1,900 | $1.14 | 4d | 1 | 0.35mi |
| 15100 Caspian Tern Ct North Fort Myers, FL | 2.0 | 2.5 | 1365 | $1,595 | $1.17 | 25d | 1 | 0.36mi |
| 15070 Caspian Tern Ct Unit 105 North Fort Myers, FL | 3.0 | 2.5 | 1583 | $1,750 | $1.11 | 4d | 1 | 0.36mi |
| 15120 Caspian Tern Ct North Fort Myers, FL | 3.0 | 2.5 | 1583 | $1,600 | $1.01 | 17d | 1 | 0.36mi |
| 15120 Caspian Tern Ct #105 North Fort Myers, FL | 3.0 | 2.5 | 1583 | $1,695 | $1.07 | 3d | 1 | 0.36mi |
| 15050 Caspian Tern Ct #103 North Fort Myers, FL | 2.0 | 2.5 | 1365 | $1,520 | $1.11 | 25d | 1 | 0.38mi |
| 6391 Brant Bay Blvd #101 North Fort Myers, FL | 3.0 | 2.5 | 1583 | $1,700 | $1.07 | 25d | 1 | 0.41mi |
| 6391 Brant Bay Blvd Unit 102 North Fort Myers, FL | 3.0 | 2.5 | 1502 | $1,595 | $1.06 | 4d | 1 | 0.41mi |
| 7306 Coon Rd North Fort Myers, FL | 2.0 | 1.0 | 1000 | $1,300 | $1.30 | 13d | 1 | 0.44mi |
| 15020 Caspian Tern Ct Unit 103 North Fort Myers, FL | 2.0 | 2.5 | 1286 | $1,600 | $1.24 | 25d | 1 | 0.44mi |
| 15011 Caspian Tern Ct #101 North Fort Myers, FL | 3.0 | 2.5 | 1583 | $1,725 | $1.09 | 4d | 1 | 0.45mi |
| 15010 Caspian Tern Ct North Fort Myers, FL | 3.0 | 2.5 | 1583 | $1,850 | $1.17 | 25d | 1 | 0.46mi |
| 15121 Piping Plover Ct North Fort Myers, FL | 3.0 | 2.5 | 1583 | $1,675 | $1.06 | 20d | 1 | 0.49mi |
| 15121 Piping Plover Ct #101 North Fort Myers, FL | 3.0 | 2.5 | 1583 | $1,675 | $1.06 | 25d | 1 | 0.50mi |
| 15493 Admiralty Cir #5 North Fort Myers, FL | 2.0 | 2.0 | 1146 | $2,400 | $2.09 | 25d | 1 | 0.60mi |
| 2212 Club House Rd North Fort Myers, FL | 2.0 | 2.0 | 1602 | $3,500 | $2.18 | 25d | 1 | 0.73mi |
| 226 Lamplighter Ln North Fort Myers, FL | 2.0 | 1.0 | 900 | $899 | $1.00 | 25d | 1 | 0.75mi |
| 15250 Riverbend Blvd #204 North Fort Myers, FL | 2.0 | 2.0 | 1429 | $1,600 | $1.12 | 22d | 1 | 0.89mi |
| 106 Gaslight Ave North Fort Myers, FL | 2.0 | 2.0 | 1056 | $1,400 | $1.33 | 4d | 1 | 0.93mi |
| 2500 Gail Helen Ct North Fort Myers, FL | 3.0 | 2.0 | 1296 | $1,500 | $1.16 | 25d | 1 | 0.95mi |
| 137 Lantern Pl Unit A North Fort Myers, FL | 2.0 | 1.0 | 1080 | $1,200 | $1.11 | 4d | 1 | 0.96mi |
| 15080 Riverbend Blvd #802 North Fort Myers, FL | 2.0 | 2.0 | 1344 | $1,850 | $1.38 | 22d | 1 | 1.01mi |
| 15610 Crystal Lake Dr #101 North Fort Myers, FL | 2.0 | 2.0 | 998 | $1,900 | $1.90 | 25d | 1 | 1.04mi |
| 15610 Crystal Lake Dr North Fort Myers, FL | 2.0 | 2.0 | 968 | $1,850 | $1.91 | 25d | 1 | 1.04mi |
| 280 Flame Ln North Fort Myers, FL | 2.0 | 2.0 | 980 | $1,350 | $1.38 | 4d | 1 | 1.05mi |
| 16900 Slater Rd North Fort Myers, FL | 2.0–4.0 | 2.0 | 1120 | $1,524 | $1.36 | 3d | 17 | 1.06mi |
| 410 Suwanee Dr North Fort Myers, FL | 3.0 | 2.0 | 1480 | $1,650 | $1.11 | 25d | 1 | 1.13mi |
| 5707 Foxlake Dr #2 North Fort Myers, FL | 2.0 | 2.0 | 1114 | $1,500 | $1.35 | 25d | 1 | 1.16mi |
| 7622 Peyraud Dr North Fort Myers, FL | 3.0 | 2.0 | 1404 | $1,350 | $0.96 | 25d | 1 | 1.16mi |
| 5701 Longleaf Dr North Fort Myers, FL | 2.0 | 2.0 | 1233 | $1,570 | $1.27 | 13d | 1 | 1.19mi |
| 15427 Crystal Lake Dr North Fort Myers, FL | 2.0 | 2.0 | 1021 | $3,200 | $3.13 | 25d | 1 | 1.25mi |
| 7050 Nantucket Cir #6 North Fort Myers, FL | 2.0 | 2.0 | 950 | $3,000 | $3.16 | 17d | 1 | 1.36mi |
| 7050 Nantucket Cir North Fort Myers, FL | 2.0 | 2.0 | 950 | $3,000 | $3.16 | 25d | 1 | 1.36mi |
Listing history 18 events
-
2026-06-22days on market $200,000 Active 120 DOM
-
2026-06-17days on market $200,000 Active 116 DOM
-
2026-06-16days on market $200,000 Active 115 DOM
-
2026-06-15days on market $200,000 Active 114 DOM
-
2026-06-13days on market $200,000 Active 112 DOM
-
2026-06-10days on market $200,000 Active 109 DOM
-
2026-06-09days on market $200,000 Active 108 DOM
-
2026-06-07days on market $200,000 Active 106 DOM
-
2026-06-02days on market $200,000 Active 101 DOM
-
2026-06-01days on market $200,000 Active 100 DOM
-
2026-06-01days on market $200,000 Active 99 DOM
-
2026-05-15price $200,000
-
2026-01-31$220,000 Active
-
2002-04-08soldstatus $86,000
-
2001-12-21soldstatus $44,200
-
2001-12-06price $46,500
-
1999-12-13soldstatus $51,500
-
1990-05-29soldstatus $47,000
ⓘ Source: listings_history table (triggers on properties + properties_extension) + one-shot
backfill from property_details.listing_events for pre-trigger history.
Tax reassessment forecast FL · Resets to sale price
- Current annual tax
- $568 · $47/mo
- Projected year-2 tax
- $1,660 · $138/mo
- Expected delta
- +$1,092/yr (+$91/mo · 192.4%)
ⓘ Screening estimate from a state-policy table — verify with the county assessor before closing.
Climate risk First Street
- Flood 6/10 Major FEMA zone AE · 56% chance over 30 yrs
- Wildfire 5/10 Major
- Heat 10/10 Extreme 7 d/yr ≥107°F today · 29 d/yr by 30 yrs out
- Wind 10/10 Extreme 99% chance of damaging wind over 30 yrs
- Air quality 2/10 Low 1 unhealthy d/yr today · 1 by 30 yrs out
Nearby sold comps map
Loading sold comps map…
Walkable amenities ~0.75 mi
Loading nearby amenities…
Taxation est. · year 1
- Rental income
- $23,539
- − Mortgage interest
- −$11,203
- − Property taxes
- −$568
- − Insurance
- −$6,118
- − Repairs & maintenance
- −$1,883
- − Management
- −$1,883
- − Depreciation
- −$5,818
- Taxable loss
- −$3,935
- Est. tax savings @ 24.0%
- +$944
- After-tax cash flow
- $268/yr
For passive investors: Depreciation is non-cash, so a rental often shows a tax loss while cash-flowing — sheltering income. Rental losses are passive: they offset passive income freely, and up to $25,000/yr can offset ordinary (W-2) income if you actively participate and your MAGI is under $100k (phasing out to $0 by $150k); unused losses carry forward. On sale, claimed depreciation is recaptured at up to 25%, and gains may owe capital-gains tax (a 1031 exchange can defer both). Figures are a year-1 estimate at your 24.0% rate — not tax advice; consult a CPA.
Schools (NCES district)
- District
- Lee
- NCES district ID
- 1201080
- Math proficiency
- 47% ▼ -11.00%
- Reading proficiency
- 50% ▼ -4.00%
- Median HH income
- $49,518
- Composite
- 41.49/100
- National rank
- #3458
- State rank
- #42 of 73 in FL
Livability — North Fort Myers
- Score
- 74/100
- State rank
- #269
- US rank
- #4409
Category grades
Schools grade is shown separately in the Schools card above.
Census & demographics
- Census place
- North Fort Myers, FL
- County
- Lee County · 788,662 people
- City population
- 57,035
- Metro
- Cape Coral-Fort Myers, FL
- Population (ZIP)
- 33,380
- Household income
- $55,000
- Rent vs Own
- Severe rent burden
- 775.0
Population outlook (Lee County) Hauer SSP2
- Today (2025)
- 871,946 people
- By 2030
- 955,468 · +9.6%
- By 2040
- 1,113,587 · +27.7%
- By 2050
- 1,256,891 · +44.1%
- By 2075
- 1,560,270 · +78.9%
- By 2100
- 1,726,848 · +98.0%
Race, ethnicity, and origin ACS 2023
- Neighborhood character
- Predominantly White (85%)
- Race & ethnicity
- White 85% Hispanic / Latino 10% Two or more races 7% Asian 1% Black 1%
- Hispanic origin (detail)
- Mexican 2% Puerto Rican 1% Cuban 3%
- Common ancestry
- Lithuanian 3% Romanian 3% Slovak 2%
- Foreign-born
- 10% · Canada
- Languages at home
- 88% English-only · Spanish 9% Other Indo-European 1% Russian/Polish/Slavic 1%
Political lean MEDSL · Lee
- 2024 margin
- Strong R (+28.4) · D 35.5% · R 63.9%
- 2008→2024 swing
- -18.0pp toward R · 2008: -10.4pp · 2024: -28.4pp
- All cycles
- 2024: R+28.4 2020: R+19.2 2016: R+20.4 2012: R+16.6 2008: R+10.4
Not yet ingested
- Civics
- —
Market trends
- HPI YoY
- ▼ -122.28%
- Current HPI
- 282.2895
- Rent YoY
- ▲ 2.63%
- Metro
- Cape Coral-Fort Myers, FL
- State GDP YoY
- ▲ 3.28%
- F500 in state
- 36
Industry mix (Fortune 500 HQ in FL)
| Industry | F500 HQs | Revenue |
|---|---|---|
| Industrial Technology | 2 | $29B |
|
||
| Insurance | 2 | $17B |
|
||
| Retail | 1 | $60B |
|
||
| Technology Distribution | 1 | $58B |
|
||
| Homebuilding | 1 | $35B |
|
||
| Technology Manufacturing | 1 | $35B |
|
||
Price history
+325.5% since first listed7 events — show timeline
- 2026-05-15 Price Changed $200,000 FORTMLS
- 2026-01-31 Listed $220,000 FORTMLS
- 2002-04-08 Sold (Public Records) $86,000 Public Records
- 2001-12-21 Sold (MLS) $44,200 FORTMLS
- 2001-12-06 Price Changed $46,500 FORTMLS
- 1999-12-13 Sold (Public Records) $51,500 Public Records
- 1990-05-29 Sold (Public Records) $47,000 Public Records
Property tax history
+4.4%/yrLatest (2025): $568 · +11.1% YoY. Source: county tax records.
Cash-flow waterfall
monthlySold comps — $/sqft
last 12 mo · ≤1 miLoading sold comps…