4603-4605 E Washington St · Indianapolis city (balance), IN
Flood risk 1/10 · Minimal
- FEMA flood zone
- X (unshaded)
- Chance of flooding over 30 yrs
- 0.0%
- Est. flood insurance / yr
- $473 – $860
Fire risk 1/10 · Minimal
- Est. fire insurance / yr
- $717 – $1,331
Heat risk 4/10 · Minor
- Hot days now (above 102°F)
- 7 days/yr
- Hot days in 30 yrs
- 19 days/yr
Wind risk 2/10 · Minimal
- Chance of severe wind over 30 yrs
- 1.0%
Air-quality risk 4/10 · Minor
- Unhealthy air days now
- 5 days/yr
- Unhealthy air days in 30 yrs
- 7 days/yr
Risk factors via First Street. Map © Google.
Why this score? — see what drove the B- grade
The composite is a weighted blend of 9 inputs, each scored 0–100. Each bar is that input's sub-score; the figure is the points it added to the 100-point composite (weight × sub-score).
- Cash flow +30.0/30.0
- DSCR +10.0/10.0
- 1% rule +9.0/10.0
- ARV discount +7.5/15.0
- Rent growth +4.3/5.0
- Livability +2.5/5.0
- Schools +1.4/10.0
- Condition / age +1.0/5.0
- Appreciation +0.0/10.0
$105,000
🖨 Deal sheet 📄 Offer letter ✓ Due diligence
Listing remarks MLS
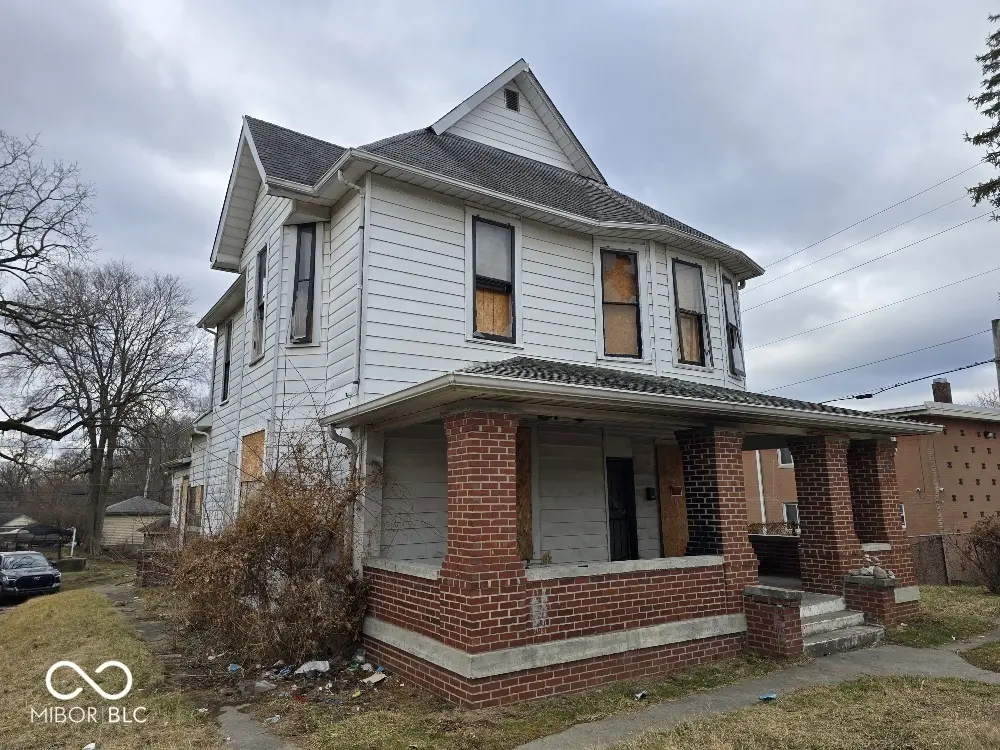
Fixer upper duplex on Indy's east side! This property is full of potential, but for the serious investor only. Currently zoned as a duplex, this property offers an abundance of space for several options. Includes detached garage in back. Come take a look
Key facts
- Zoned as a duplex
- Detached garage
- Abundance of space
Tags
Neighborhood map
What this means for you Summary
Snapshot
- This is a 4-bed/2.0-bath condo listed at $105k. Condition is rated poor.
Deal economics
- At list price, monthly cash flow is $436 ($5k/yr) — positive.
- The deal already cash-flows at list — no discount required.
- Meets the 1% rule at list price ($1k rent vs $105k).
- Recommended offer: $99k (6.0% below list) — sets the bar for market timing.
- Cap rate 11.3% vs local median 4.4% in Indianapolis city (balance) — top-decile yield for the area; either an underpriced asset or a hidden risk that comps aren't pricing in. Stress-test before assuming the spread holds.
Location & tenants
- Location reads: area grade B — affects rentability + tenant quality, not the cash-flow math above.
- Indianapolis Public Schools (urban): math 14% / reading 20% proficiency, ranked #286 of 301 in IN (top 95%) — low school quality limits family demand, transient renter base, plan for 1-2y turnover; 77% free/reduced lunch — lower-income household profile, screen leases tightly.
- Market conditions: Rents rising fast (+7.3%/yr); 480 active listings in the ZIP; 40 comparable units currently listed for rent nearby; rentals lingering (median 44d on market — plan ~5-8 weeks vacancy on turnover, expect pricing pressure); 52% of comp listings sitting > 30 days — soft ceiling on asking rent; 1,906 units permitted in Marion County in 2024 (621 in 5+ unit buildings).
- This rent runs 36% of the median local income ($49k/yr) — at the standard rent-burdened threshold; future hikes will face affordability resistance.
Forward outlook
- Local home prices are declining (-3.0%/yr); year-one equity from $726 of loan paydown is wiped out by about $3k of value loss. Plan a longer hold.
- Marion County population projected at +18% by 2050 — long-run rental-demand tailwind backs the buy-and-hold thesis.
- At projected returns (-3.0% appreciation + 7.3% rent growth), your $29k cash investment doubles in ~6 years — after that, you're playing with house money.
Negotiation context
- It's been on market 85 days — a 6% lower offer ($99k) is reasonable based on typical stale-listing flexibility.
Risks & watch-outs
- Watch-outs: built in 1890 — expect roof / HVAC / electrical / plumbing capex.
Questions for the listing agent
- It's been on market 85 days. Have you received any prior offers? Is the seller open to a 6% concession, seller financing, or rate buy-down credit?
- Have any recent inspections been done? Can we get a copy of the seller's disclosures and any deferred-maintenance estimates?
- Built in 1890 — when were the roof, HVAC, electrical panel, plumbing, and water heater last replaced?
- Any open or pending special assessments — roof, HVAC, plumbing, elevator, façade? What's the per-unit balance and payoff schedule, and is the seller paying it off at close or rolling it to the buyer?
- Why hasn't it sold? Are there any deal-killer items the seller is aware of (foundation, flood, title, zoning, code violations)?
- Is there a deadline driving the sale (1031 exchange, divorce, estate, relocation)? That informs how much negotiation room exists.
- What's the average days-on-market for RENTAL listings here right now (not sales)? A rising rental-DOM trend means longer vacancies and softer asking-rent achievability than the comps imply.
- What's the recent tenant-quality profile in this submarket — average credit score on applications, eviction rate, late-payment / NSF rate, and stable-employment percentage? A property-management company in the area should have these aggregated.
- How much new apartment / multifamily construction is in the pipeline within 1–3 miles? Heavy new supply (>2% of stock underway) typically softens rents 12–24 months out; light construction supports rent growth.
Investment metrics
- 1% rule
- 1.40% ✓
- Cap rate
- 11.27%
- Cash-on-cash
- 17.79%
- DSCR
- 1.79
- GRM
- 6.0
CMA / ARV
- ARV (median comp)
- $238,271
- List price
- $105,000
- Delta
- -55.93%
- Verdict
- UNDERPRICED
- Comps
- 20 within 1.0 mi
Projected returns pro-forma
-3.0% appreciation · 7.31% rent growth · sell at horizon
- IRR
- 14.1%
- Equity multiple
- 1.59×
- Total profit
- $17,418
- Equity at exit
- $15,656
- IRR
- 25.9%
- Equity multiple
- 3.75×
- Total profit
- $80,839
- Equity at exit
- $9,078
Cash invested: $29,400 (down + closing). Projections, not guarantees.
Landlord ↔ Tenant lean methodology
- Overall (STATE)
- 90 Strongly Landlord-Friendly
- State Indiana
- 90 Strongly Landlord-Friendly · R+11
- County
- — inherits STATE
- City
- — inherits STATE
ZIP-level market 46201
- Home prices YoY
- -33.9%
- Rents YoY
- 7.3%
- Active inventory
- 480
- Price-to-rent
- 6.0×
Monthly cashflow live
- Estimated rent
- $1,470 high interval (Pro) →
- Mortgage (P&I)
- −$551
- Tax est. 1.5%
- −$131 /mo · $1,575/yr
- Insurance
- −$44
- HOA
- −$0
- Vacancy / Maint / Mgmt
- −$309
- Net cashflow
- $436
Break-even live
UW: 25.0% down · 7.5% · 30yr · 1.5% tax · 5.0% vac · 8.0% maint · 8.0% mgmt
Financing live
Cash to close
- Down payment
- $26,250
- Closing costs
- $3,150
- Reserves months
- —
- Total cash needed
- —
Loan-product check · same deal, 3 products live
Conventional
25% down · 7.5% · 30yr
- Down + closing
- —
- Monthly P&I
- —
- Monthly cashflow
- —
- DSCR
- —
- Eligible?
- —
Personal DTI + credit; lowest rate.
DSCR
20% down · 8.5% · 30yr
- Down + closing
- —
- Monthly P&I
- —
- Monthly cashflow
- —
- DSCR
- —
- Eligible?
- —
No personal income docs; deal must DSCR.
Hard money
10% down · 12.0% · 12mo
- Down + closing
- —
- Monthly P&I
- —
- Monthly cashflow
- —
- DSCR
- —
- Eligible?
- —
Short-term bridge; refi at stabilization.
Rent comps 40 comps
| Address | Beds | Baths | Sqft | Rent | $/sqft | DOM | Units | Dist |
|---|---|---|---|---|---|---|---|---|
| 25 N Drexel Ave Unit A Indianapolis, IN | 3.0 | 2.0 | 1250 | $1,325 | $1.06 | 43d | 1 | 0.04mi |
| 21 N Colorado Ave Indianapolis, IN | 3.0 | 1.5 | 1520 | $2,000 | $1.32 | 43d | 1 | 0.20mi |
| 4214 E Washington St Indianapolis, IN | 3.0 | 2.0 | 961 | $1,195 | $1.24 | 7d | 1 | 0.25mi |
| 117 N Riley Ave Indianapolis, IN | 3.0 | 3.0 | 1664 | $1,600 | $0.96 | 20d | 1 | 0.31mi |
| 306 N Riley Ave Indianapolis, IN | 3.0 | 1.0 | 1320 | $1,095 | $0.83 | 17d | 1 | 0.32mi |
| 415 N Dequincy St Indianapolis, IN | 3.0 | 2.0 | 1250 | $1,900 | $1.52 | 14d | 1 | 0.34mi |
| 119 N Grant Ave Indianapolis, IN | 3.0 | 1.0 | 1408 | $1,195 | $0.85 | 43d | 1 | 0.35mi |
| 622 N Linwood Ave Indianapolis, IN | 3.0 | 2.0 | 985 | $1,299 | $1.32 | 43d | 1 | 0.43mi |
| 642 N Colorado Ave Indianapolis, IN | 3.0 | 2.0 | 1572 | $1,450 | $0.92 | 43d | 1 | 0.51mi |
| 314 N Denny St Indianapolis, IN | 3.0 | 1.0 | 1184 | $975 | $0.82 | 23d | 1 | 0.51mi |
| 508 Emerson Ave Indianapolis, IN | 3.0 | 1.5 | 1094 | $1,150 | $1.05 | 14d | 1 | 0.54mi |
| 442 N Denny St Indianapolis, IN | 3.0 | 1.0 | 1140 | $1,045 | $0.92 | 23d | 1 | 0.58mi |
| 33 N Sherman Dr Unit 33 Indianapolis, IN | 3.0 | 1.5 | 1288 | $1,500 | $1.16 | 7d | 1 | 0.58mi |
| 801 N Gladstone Ave Indianapolis, IN | 3.0 | 1.5 | 1776 | $1,225 | $0.69 | 43d | 1 | 0.58mi |
| 861 N Drexel Ave Indianapolis, IN | 3.0 | 1.0 | 1000 | $1,200 | $1.20 | 7d | 1 | 0.63mi |
| 861 N Drexel Ave Unit 863 Indianapolis, IN | 3.0 | 1.0 | 1000 | $1,200 | $1.20 | 43d | 1 | 0.63mi |
| 5010 Brookville Rd Indianapolis, IN | 3.0 | 2.0 | 1656 | $1,350 | $0.82 | 7d | 1 | 0.63mi |
| 447 N Sherman Dr Indianapolis, IN | 3.0 | 1.5 | 1312 | $1,195 | $0.91 | 43d | 1 | 0.66mi |
| 3712 E Market St Indianapolis, IN | 3.0 | 1.0 | 1800 | $1,450 | $0.81 | 14d | 1 | 0.66mi |
| 603 N Sherman Dr Indianapolis, IN | 3.0 | 1.0 | 1250 | $1,300 | $1.04 | 43d | 1 | 0.70mi |
| 83 N Ewing St Unit 83 Indianapolis, IN | 3.0 | 1.0 | 1016 | $1,199 | $1.18 | 43d | 1 | 0.74mi |
| 4318 Spann Ave Indianapolis, IN | 3.0 | 1.0 | 1411 | $1,200 | $0.85 | 43d | 1 | 0.74mi |
| 822 N Bradley Ave Unit 822 Indianapolis, IN | 3.0 | 1.0 | 1100 | $1,200 | $1.09 | 43d | 1 | 0.79mi |
| 739 Temperance Ave Indianapolis, IN | 3.0 | 1.0 | 1136 | $1,350 | $1.19 | 43d | 1 | 0.90mi |
| 750 S Dequincy St Indianapolis, IN | 3.0 | 1.5 | 936 | $1,500 | $1.60 | 43d | 1 | 0.92mi |
| 37 S Tuxedo St Indianapolis, IN | 3.0 | 1.0 | 950 | $1,150 | $1.21 | 43d | 1 | 0.93mi |
| 28 S Dearborn St Unit A Indianapolis, IN | 3.0 | 1.0 | 1100 | $1,400 | $1.27 | 10d | 1 | 1.06mi |
| 408 N Dearborn St Indianapolis, IN | 3.0 | 2.5 | 1740 | $1,750 | $1.01 | 43d | 1 | 1.08mi |
| 3706 Hoyt Ave Indianapolis, IN | 3.0 | 1.0 | 960 | $1,500 | $1.56 | 14d | 1 | 1.09mi |
| 3702 Hoyt Ave Indianapolis, IN | 3.0 | 2.0 | 960 | $1,500 | $1.56 | 14d | 1 | 1.09mi |
| 430 N Dearborn St Indianapolis, IN | 3.0 | 1.0 | 1128 | $1,300 | $1.15 | 43d | 1 | 1.09mi |
| 253 N Gray St Indianapolis, IN | 3.0 | 1.5 | 1176 | $1,660 | $1.41 | 7d | 1 | 1.10mi |
| 510 N Dearborn St Indianapolis, IN | 3.0 | 1.0 | 1008 | $1,350 | $1.34 | 43d | 1 | 1.12mi |
| 20 N Gray St Indianapolis, IN | 3.0 | 2.0 | 1300 | $1,800 | $1.38 | 43d | 1 | 1.12mi |
| 1015 N Gale St Indianapolis, IN | 3.0 | 2.0 | 1200 | $1,550 | $1.29 | 14d | 1 | 1.13mi |
| 953 N Tuxedo St Indianapolis, IN | 3.0 | 1.0 | 1200 | $950 | $0.79 | 23d | 1 | 1.17mi |
| 840 N Lasalle St Indianapolis, IN | 3.0 | 1.0 | 1215 | $1,100 | $0.91 | 23d | 1 | 1.17mi |
| 253 S Gray St Indianapolis, IN | 3.0 | 1.5 | 1176 | $1,660 | $1.41 | 2d | 1 | 1.17mi |
| 909 N Lasalle St Indianapolis, IN | 3.0 | 2.0 | 1717 | $1,600 | $0.93 | 44d | 1 | 1.18mi |
| 409 N Oakland Ave Unit 411 Indianapolis, IN | 3.0 | 2.0 | 1300 | $1,495 | $1.15 | 43d | 1 | 1.19mi |
HOA detail condo
- Monthly dues
- $0 · $0/yr
- Assessments
- None detected in remarks — confirm with the listing agent.
Listing history 17 events
-
2026-06-18days on market $105,000 Active 85 DOM
-
2026-06-17days on market $105,000 Active 84 DOM
-
2026-06-16days on market $105,000 Active 83 DOM
-
2026-06-15days on market $105,000 Active 82 DOM
-
2026-06-13days on market $105,000 Active 80 DOM
-
2026-06-13days on market $105,000 Active 79 DOM
-
2026-06-09days on market $105,000 Active 76 DOM
-
2026-06-08days on market $105,000 Active 75 DOM
-
2026-06-07days on market $105,000 Active 74 DOM
-
2026-06-03days on market $105,000 Active 72 DOM
-
2026-06-02days on market $105,000 Active 71 DOM
-
2026-06-01days on market $105,000 Active 70 DOM
-
2026-05-31days on market $105,000 Active 69 DOM
-
2026-04-30price $105,000 258-char remark
Show marketing remark (258 chars)
Fixer upper duplex on Indy's east side! This property is full of potential, but for the serious investor only. Currently zoned as a duplex, this property offers an abundance of space for several options. Includes detached garage in back. Come take a look
-
2026-04-30price $119,900 258-char remark
Show marketing remark (258 chars)
Fixer upper duplex on Indy's east side! This property is full of potential, but for the serious investor only. Currently zoned as a duplex, this property offers an abundance of space for several options. Includes detached garage in back. Come take a look
-
2026-04-08price $129,900 258-char remark
Show marketing remark (258 chars)
Fixer upper duplex on Indy's east side! This property is full of potential, but for the serious investor only. Currently zoned as a duplex, this property offers an abundance of space for several options. Includes detached garage in back. Come take a look
-
2026-03-21$139,900 Active 258-char remark
Show marketing remark (258 chars)
Fixer upper duplex on Indy's east side! This property is full of potential, but for the serious investor only. Currently zoned as a duplex, this property offers an abundance of space for several options. Includes detached garage in back. Come take a look
ⓘ Source: listings_history table (triggers on properties + properties_extension) + one-shot
backfill from property_details.listing_events for pre-trigger history.
Climate risk First Street
- Flood 1/10 Low FEMA zone X (unshaded) · 0% chance over 30 yrs
- Wildfire 1/10 Low
- Heat 4/10 Moderate 7 d/yr ≥102°F today · 19 d/yr by 30 yrs out
- Wind 2/10 Low 100% chance of damaging wind over 30 yrs
- Air quality 4/10 Moderate 5 unhealthy d/yr today · 7 by 30 yrs out
Nearby sold comps map
Loading sold comps map…
Walkable amenities ~0.75 mi
Loading nearby amenities…
Taxation est. · year 1
- Rental income
- $17,642
- − Mortgage interest
- −$5,882
- − Property taxes
- −$1,575
- − Insurance
- −$525
- − Repairs & maintenance
- −$1,411
- − Management
- −$1,411
- − Depreciation
- −$3,055
- Taxable income
- $3,783
- Est. tax owed @ 24.0%
- −$908
- After-tax cash flow
- $4,322/yr
For passive investors: Depreciation is non-cash, so a rental often shows a tax loss while cash-flowing — sheltering income. Rental losses are passive: they offset passive income freely, and up to $25,000/yr can offset ordinary (W-2) income if you actively participate and your MAGI is under $100k (phasing out to $0 by $150k); unused losses carry forward. On sale, claimed depreciation is recaptured at up to 25%, and gains may owe capital-gains tax (a 1031 exchange can defer both). Figures are a year-1 estimate at your 24.0% rate — not tax advice; consult a CPA.
Condition & rehab AI · 12 photos
This fixer-upper duplex requires extensive rehabilitation to become move-in ready. Significant repairs and updates are needed to improve the home's condition and increase its resale and rental value.
Repairs flagged
- Major roof — Severe damage to the roof is evident.
- Major exterior siding — Significant portions of the siding are missing or damaged.
- Major interior walls/paint — Peeling paint and deteriorated walls indicate extensive damage.
- Major windows — Boarded-up windows suggest structural damage or abandonment.
- Major foundation/structure — The foundation appears to be in poor condition, indicating potential structural issues.
- Major HVAC/mechanicals — No visible HVAC or mechanical systems, indicating potential issues with heating and cooling.
- Major landscaping — Overgrown and unkempt landscaping suggests neglect and requires significant work to improve curb appeal.
Value-add opportunities
- Both Rehabilitation of the roof, exterior siding, and interior walls/paint — These repairs would significantly improve the home's appearance and functionality, attracting both buyers and renters.
- Both Rehabilitation of the windows and foundation — These repairs would address structural issues and improve the home's overall condition.
- Both HVAC and mechanical systems — Upgrading the HVAC and mechanical systems would improve comfort and energy efficiency, attracting both buyers and renters.
- Both Landscaping and curb appeal — A well-maintained and attractive exterior would enhance the home's curb appeal and attract potential buyers and renters.
Renovation cost estimate screening
| Repair item | Severity | Est. cost |
|---|---|---|
| roof · Severe damage to the roof is evident. | Major | $15,000–50,000 |
| exterior siding · Significant portions of the siding are missing or damaged. | Major | $15,000–50,000 |
| interior walls/paint · Peeling paint and deteriorated walls indicate extensive damage. | Major | $15,000–50,000 |
| windows · Boarded-up windows suggest structural damage or abandonment. | Major | $15,000–50,000 |
| foundation/structure · The foundation appears to be in poor condition, indicating potential structural issues. | Major | $15,000–50,000 |
| HVAC/mechanicals · No visible HVAC or mechanical systems, indicating potential issues with heating and cooling. | Major | $15,000–50,000 |
| landscaping · Overgrown and unkempt landscaping suggests neglect and requires significant work to improve curb appeal. | Major | $15,000–50,000 |
| Total estimated repair cost · 7 items | $105,000–350,000 |
Value-add ROI direction
- Both Rehabilitation of the roof, exterior siding, and interior walls/paint — These repairs would significantly improve the home's appearance and functionality, attracting both buyers and renters. ↑
- Both Rehabilitation of the windows and foundation — These repairs would address structural issues and improve the home's overall condition. ↑
- Both HVAC and mechanical systems — Upgrading the HVAC and mechanical systems would improve comfort and energy efficiency, attracting both buyers and renters. ↑
- Both Landscaping and curb appeal — A well-maintained and attractive exterior would enhance the home's curb appeal and attract potential buyers and renters. ↑
ⓘ Cost ranges are severity-bucket heuristics (US national rule-of-thumb). Get contractor quotes + a written scope before underwriting a rehab budget.
Schools (NCES district)
- District
- Indianapolis Public Schools
- NCES district ID
- 1804770
- Math proficiency
- 14% ▼ -7.00%
- Reading proficiency
- 20% ▼ -3.00%
- Median HH income
- $32,034
- Composite
- 13.69/100
- National rank
- #9499
- State rank
- #286 of 301 in IN
Livability — Indianapolis city (balance)
No livability data for this city. (Only ~50 U.S. cities are tracked.)
Census & demographics
- Census place
- Indianapolis city (balance), IN
- County
- Marion County · 998,460 people
- City population
- 881,119
- Metro
- Indianapolis-Carmel-Anderson, IN
- Population (ZIP)
- 30,335
- Household income
- $49,195
- Rent vs Own
- Severe rent burden
- 1906.0
Population outlook (Marion County) Hauer SSP2
- Today (2025)
- 1,025,572 people
- By 2030
- 1,065,727 · +3.9%
- By 2040
- 1,141,577 · +11.3%
- By 2050
- 1,208,920 · +17.9%
- By 2075
- 1,367,288 · +33.3%
- By 2100
- 1,438,201 · +40.2%
Race, ethnicity, and origin ACS 2023
- Neighborhood character
- Diverse neighborhood (Simpson 0.63)
- Race & ethnicity
- White 53% Hispanic / Latino 23% Black 18% Two or more races 9%
- Hispanic origin (detail)
- Mexican 14% Puerto Rican 2%
- Common ancestry
- Slovak 2% Lithuanian 2% Italian 1%
- Foreign-born
- 9% · Canada
- Languages at home
- 81% English-only · Spanish 17%
Political lean MEDSL · Marion
- 2024 margin
- Strong D (+27.7) · D 63.0% · R 35.3% · Other 1.7%
- 2008→2024 swing
- -0.7pp no change · 2008: 28.4pp · 2024: 27.7pp
- All cycles
- 2024: D+27.7 2020: D+29.1 2016: D+22.8 2012: D+22.2 2008: D+28.4
Not yet ingested
- Civics
- —
Market trends
- HPI YoY
- ▼ -192.51%
- Current HPI
- 375.0969
- Rent YoY
- ▲ 7.31%
- Metro
- Indianapolis-Carmel-Anderson, IN
- State GDP YoY
- ▲ 2.90%
- F500 in state
- 18
Industry mix (Fortune 500 HQ in IN)
| Industry | F500 HQs | Revenue |
|---|---|---|
| Industrial Machinery | 2 | $37B |
|
||
| Healthcare | 1 | $177B |
|
||
| Pharmaceuticals | 1 | $45B |
|
||
| Metals / Steel | 1 | $18B |
|
||
| Agriculture | 1 | $17B |
|
||
| Packaging | 1 | $12B |
|
||
Price history
-24.9% since first listed4 events — show timeline
- 2026-04-30 Price Changed $105,000 MIBOR as Distributed by MLS Grid
- 2026-04-30 Price Changed $119,900 MIBOR as Distributed by MLS Grid
- 2026-04-08 Price Changed $129,900 MIBOR as Distributed by MLS Grid
- 2026-03-21 Listed $139,900 MIBOR as Distributed by MLS Grid
Property tax history
+34.6%/yrLatest (2025): $5,413 · -16.6% YoY. Source: county tax records.
Cash-flow waterfall
monthlySold comps — $/sqft
last 12 mo · ≤1 miLoading sold comps…