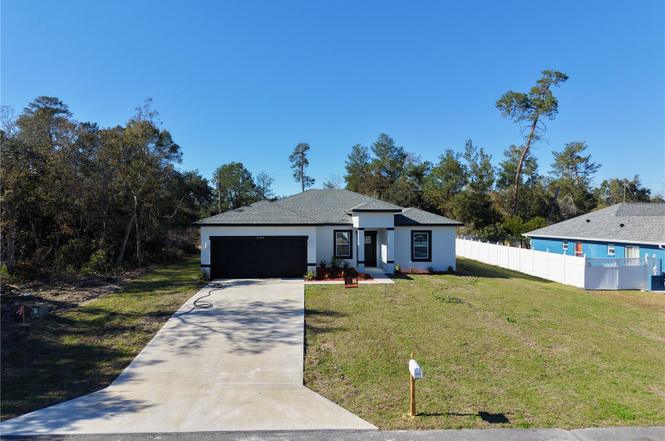
2402 SW 156th Loop · Marion Oaks, FL
Flood risk 1/10 · Minimal
- FEMA flood zone
- X (unshaded)
- Chance of flooding over 30 yrs
- 0.0%
- Est. flood insurance / yr
- $507 – $1,088
Fire risk 5/10 · Moderate
- Est. fire insurance / yr
- $947 – $1,759
Heat risk 8/10 · Major
- Hot days now (above 108°F)
- 5 days/yr
- Hot days in 30 yrs
- 16 days/yr
Wind risk 9/10 · Severe
- Chance of severe wind over 30 yrs
- 99.0%
Air-quality risk 3/10 · Minor
- Unhealthy air days now
- 2 days/yr
- Unhealthy air days in 30 yrs
- 4 days/yr
Risk factors via First Street. Map © Google.
Why this score? — see what drove the F grade
The composite is a weighted blend of 9 inputs, each scored 0–100. Each bar is that input's sub-score; the figure is the points it added to the 100-point composite (weight × sub-score).
- ARV discount +7.5/15.0
- Cash flow +7.2/30.0
- Schools +3.6/10.0
- Livability +2.5/5.0
- Condition / age +2.5/5.0
- Rent growth +2.3/5.0
- 1% rule +2.0/10.0
- DSCR +1.4/10.0
- Appreciation +0.0/10.0
$299,900
🖨 Deal sheet 📄 Offer letter ✓ Due diligence
Listing remarks
This beautifully designed Arpoador model features 4 spacious bedrooms, 3 full bathrooms, and 1,892 sq ft of heated living space, with a total construction area of 2,333 sq ft. The home is finished with SLEEK BRUSHED NICKEL FIXTURES AND ACCENTS, giving it a clean, modern aesthetic throughout. The open-concept kitchen is a showstopper with a WATERFALL QUARTZ ISLAND and comes fully equipped with stainless steel appliances—refrigerator, range, microwave, dishwasher, and disposal. The luxurious owner’s suite offers a STANDALONE TUB, glass-enclosed SHOWER DOOR, and dual vanities. Additional highlights include a SMART KEY entry system, double car garage, covered entry, and a 2-10 HOME
Key facts
- Dual vanities
- Standalone tub
- Covered entry
Tags
Property features AI
Finance
- Other: Lot approximately 0.23 acres (about 931 sq m); Living area reported as 1,892 sq ft (builder source); total building area 2,333 sq ft; Zoned R1
Exterior
- Parking: Attached 2-car garage
- Utilities: Public water; Septic tank; Electricity connected; Water connected
- Home design: Single-family residence; Completed condition; One story; Faces southwest; New construction
- Construction: Block and stucco construction; Shingle roof; Slab foundation; Built by 4U Custom Homes Corp (model: Arpoador)
- Exterior features: Exterior lighting; Asphalt road access
Interior
- Kitchen: Dishwasher; Disposal; Microwave; Range; Refrigerator
- Bedrooms: 4 bedrooms
- Flooring: Vinyl
- Bathrooms: 3 full bathrooms
- Heating & cooling: Central heating; Central air conditioning
- Interior features: Walk-in closets; Lighting (exterior lighting noted under exterior but contributes to interior ambiance)
- Laundry & utility: Inside laundry
Neighborhood map
What this means for you Summary
Snapshot
- This is a 4-bed/3.0-bath land listed at $300k.
Deal economics
- At list price, monthly cash flow is $-411 ($-5k/yr) — negative.
- To cash-flow at today's rent, offer at most $240k (19.8% below list).
- To meet the 1% rule (rent ≥ 1% of price), the offer needs to be $210k (29.9% below list).
- Recommended offer: $210k (29.9% below list) — sets the bar for 1% rule.
Location & tenants
- Location reads: area grade F — affects rentability + tenant quality, not the cash-flow math above.
- Marion (rural): math 42% / reading 43% proficiency, ranked #61 of 73 in FL (top 84%) — families likely to look elsewhere, expect single-tenant / working-renter base with shorter leases; 61% free/reduced lunch — lower-income household profile, screen leases tightly.
- Market conditions: Rents soft (-0.7%/yr); 1355 active listings in the ZIP; 40 comparable units currently listed for rent nearby; rentals leasing fast (median 14d on market — plan ~1-2 weeks tenant-placement turnaround); 7,071 units permitted in Marion County in 2024 (534 in 5+ unit buildings).
- This rent runs 35% of the median local income ($72k/yr) — at the standard rent-burdened threshold; future hikes will face affordability resistance.
Forward outlook
- Local home prices are declining (-3.0%/yr); year-one equity from $2k of loan paydown is wiped out by about $9k of value loss. Plan a longer hold.
- Marion County population projected at +13% by 2050 — modest demand growth; plan on rents tracking national, not racing it.
Negotiation context
- It's been on market 204 days — a 12% lower offer ($264k) is reasonable based on typical stale-listing flexibility.
- Current owner paid $16k; list at $300k implies a 1774% gain — meaningful room to come down on a strong offer.
Risks & watch-outs
- Climate carrying-cost: severe wind risk, 99% chance of damaging wind over 30y; moderate wildfire risk; extreme-heat days projected 5→16/yr by 2055 (HVAC capex compounding) — expect insurance premiums to compound above CPI over the hold.
Questions for the listing agent
- What do current leases actually rent for vs. the listed asking? Can we see a recent rent roll and the last 12 months of T-12 income?
- It's been on market 204 days. Have you received any prior offers? Is the seller open to a 30% concession, seller financing, or rate buy-down credit?
- Why hasn't it sold? Are there any deal-killer items the seller is aware of (foundation, flood, title, zoning, code violations)?
- Is there a deadline driving the sale (1031 exchange, divorce, estate, relocation)? That informs how much negotiation room exists.
- The area grade is low — what's the realistic commute time and amenity access for the typical tenant pool here? Any planned neighborhood developments (good or bad) we should know about?
- What's the average days-on-market for RENTAL listings here right now (not sales)? A rising rental-DOM trend means longer vacancies and softer asking-rent achievability than the comps imply.
- What's the recent tenant-quality profile in this submarket — average credit score on applications, eviction rate, late-payment / NSF rate, and stable-employment percentage? A property-management company in the area should have these aggregated.
- How much new for-sale + rental construction is in the pipeline within 1–3 miles? Heavy new supply typically softens prices + rents 12–24 months out; constrained supply supports both.
Investment metrics
- 1% rule
- 0.70% ✗
- Cap rate
- 4.65%
- Cash-on-cash
- -5.87%
- DSCR
- 0.74
- GRM
- 11.9
CMA / ARV
No comps found within radius.
Projected returns pro-forma
-3.0% appreciation · 0.0% rent growth · sell at horizon
- IRR
- -29.7%
- Equity multiple
- 0.04×
- Total profit
- $-80,904
- Equity at exit
- $44,716
- IRR
- -49.6%
- Equity multiple
- -0.52×
- Total profit
- $-127,846
- Equity at exit
- $25,930
Cash invested: $83,972 (down + closing). Projections, not guarantees.
Landlord ↔ Tenant lean methodology
- Overall (STATE)
- 87 Strongly Landlord-Friendly
- State Florida
- 87 Strongly Landlord-Friendly · R+3
- County
- — inherits STATE
- City
- — inherits STATE
ZIP-level market 34473
- Home prices YoY
- -16.8%
- Rents YoY
- -0.7%
- Active inventory
- 1355
- Price-to-rent
- 11.9×
Monthly cashflow live
- Estimated rent
- $2,103 high interval (Pro) →
- Mortgage (P&I)
- −$1,573
- Tax est. 1.5%
- −$375 /mo · $4,498/yr
- Insurance
- −$125
- HOA
- −$0
- Vacancy / Maint / Mgmt
- −$442
- Net cashflow
- $-411
Break-even live
UW: 25.0% down · 7.5% · 30yr · 1.5% tax · 5.0% vac · 8.0% maint · 8.0% mgmt
Financing live
Cash to close
- Down payment
- $74,975
- Closing costs
- $8,997
- Reserves months
- —
- Total cash needed
- —
Loan-product check · same deal, 3 products live
Conventional
25% down · 7.5% · 30yr
- Down + closing
- —
- Monthly P&I
- —
- Monthly cashflow
- —
- DSCR
- —
- Eligible?
- —
Personal DTI + credit; lowest rate.
DSCR
20% down · 8.5% · 30yr
- Down + closing
- —
- Monthly P&I
- —
- Monthly cashflow
- —
- DSCR
- —
- Eligible?
- —
No personal income docs; deal must DSCR.
Hard money
10% down · 12.0% · 12mo
- Down + closing
- —
- Monthly P&I
- —
- Monthly cashflow
- —
- DSCR
- —
- Eligible?
- —
Short-term bridge; refi at stabilization.
Rent comps 40 comps
| Address | Beds | Baths | Sqft | Rent | $/sqft | DOM | Units | Dist |
|---|---|---|---|---|---|---|---|---|
| 16008 SW 23rd Court Rd Ocala, FL | 3.0 | 2.0 | 1755 | $2,400 | $1.37 | 21d | 1 | 0.15mi |
| 16200 SW 21st Ct Ocala, FL | 4.0 | 2.0 | 1578 | $1,800 | $1.14 | 21d | 1 | 0.19mi |
| 16124 SW 23rd Court Rd Ocala, FL | 3.0 | 2.0 | 1357 | $1,715 | $1.26 | 13d | 1 | 0.25mi |
| 16252 SW 27th Terrace Rd Ocala, FL | 4.0 | 2.0 | 1850 | $2,200 | $1.19 | 13d | 1 | 0.25mi |
| 529 Marion Oaks Ln Ocala, FL | 4.0 | 2.0 | 1883 | $2,200 | $1.17 | 13d | 1 | 0.27mi |
| 15701 SW 23rd Court Rd Ocala, FL | 4.0 | 2.0 | 1630 | $1,900 | $1.17 | 21d | 1 | 0.35mi |
| 2161 SW 153rd Loop Ocala, FL | 4.0 | 2.0 | 1578 | $2,000 | $1.27 | 21d | 1 | 0.35mi |
| 15741 SW 23rd Avenue Rd Ocala, FL | 3.0 | 2.0 | 1337 | $1,595 | $1.19 | 13d | 1 | 0.37mi |
| 15761 SW 23rd Avenue Rd Ocala, FL | 3.0 | 2.0 | 1229 | $2,000 | $1.63 | 21d | 1 | 0.37mi |
| 2500 SW 156th Lane Rd Ocala, FL | 4.0 | 2.0 | 1850 | $2,200 | $1.19 | 21d | 1 | 0.42mi |
| 2670 162nd Ln Unit 2670 Ocala, FL | 4.0 | 2.0 | 1730 | $2,000 | $1.16 | 21d | 1 | 0.46mi |
| 2660 SW 162nd Street Rd Ocala, FL | 4.0 | 2.0 | 1765 | $1,999 | $1.13 | 21d | 1 | 0.50mi |
| 16390 SW 17th Terrace Rd Ocala, FL | 4.0 | 2.0 | 1578 | $1,825 | $1.16 | 13d | 1 | 0.50mi |
| 2711 SW 162nd Ln Ocala, FL | 4.0 | 2.0 | 1786 | $2,150 | $1.20 | 13d | 1 | 0.51mi |
| 2240 SW 156th Loop Ocala, FL | 3.0 | 2.0 | 1570 | $1,600 | $1.02 | 21d | 1 | 0.53mi |
| 1631 SW 160th Pl Ocala, FL | 4.0 | 2.0 | 1617 | $1,795 | $1.11 | 13d | 1 | 0.55mi |
| 2673 SW 156th Pl Ocala, FL | 4.0 | 2.0 | 1850 | $1,950 | $1.05 | 13d | 1 | 0.55mi |
| 2725 SW 158th St Ocala, FL | 4.0 | 2.0 | 1580 | $2,000 | $1.27 | 13d | 1 | 0.56mi |
| 16015 SW 29th Court Rd Unit 2 Ocala, FL | 3.0 | 2.0 | 1321 | $1,450 | $1.10 | 21d | 1 | 0.66mi |
| 2584 SW 154th Ln Ocala, FL | 3.0 | 2.0 | 1251 | $1,975 | $1.58 | 21d | 1 | 0.66mi |
| 2836 SW 161st Loop Ocala, FL | 3.0 | 2.0 | 1357 | $1,675 | $1.23 | 13d | 1 | 0.68mi |
| 15353 SW 21st Ct Ocala, FL | 4.0 | 2.0 | 1696 | $2,200 | $1.30 | 13d | 1 | 0.69mi |
| 405 Marion Oaks Ln Ocala, FL | 4.0 | 2.0 | 1578 | $1,700 | $1.08 | 13d | 1 | 0.71mi |
| 405 Marion Oaks Ln Ocala, FL | 4.0 | 2.0 | 1578 | $1,699 | $1.08 | 21d | 1 | 0.71mi |
| 1663 SW 167th St Ocala, FL | 4.0 | 2.0 | 1751 | $2,000 | $1.14 | 13d | 1 | 0.78mi |
| 2220 SW 169th Pl Ocala, FL | 3.0 | 2.0 | 1368 | $1,650 | $1.21 | 21d | 1 | 0.79mi |
| 16846 SW 22nd Ct Ocala, FL | 4.0 | 2.0 | 1580 | $1,900 | $1.20 | 13d | 1 | 0.79mi |
| 2705 SW 153rd Place Rd Ocala, FL | 4.0 | 2.0 | 1580 | $1,745 | $1.10 | 21d | 1 | 0.81mi |
| 2628 SW 165th Street Rd Ocala, FL | 4.0 | 2.0 | 1796 | $1,899 | $1.06 | 13d | 1 | 0.83mi |
| 16292 SW 30th Ter Ocala, FL | 3.0 | 2.0 | 1482 | $1,650 | $1.11 | 21d | 1 | 0.84mi |
| 15434 SW 29th Terrace Rd Ocala, FL | 3.0 | 2.0 | 1399 | $1,780 | $1.27 | 13d | 1 | 0.92mi |
| 2603 SW 152nd Ln Ocala, FL | 3.0 | 1.5 | 1402 | $1,550 | $1.11 | 13d | 1 | 0.94mi |
| 16619 SW 31st Cir Ocala, FL | 3.0 | 2.0 | 1536 | $1,900 | $1.24 | 13d | 1 | 0.99mi |
| 16690 SW 29th Terrace Rd Ocala, FL | 4.0 | 2.0 | 1617 | $1,725 | $1.07 | 21d | 1 | 1.01mi |
| 15831 SW 34th Court Rd Ocala, FL | 3.0 | 2.0 | 1402 | $1,715 | $1.22 | 13d | 1 | 1.14mi |
| 16100 SW 35th Court Rd Ocala, FL | 4.0 | 2.0 | 1578 | $1,750 | $1.11 | 13d | 1 | 1.16mi |
| 16090 SW 35th Court Rd Ocala, FL | 4.0 | 2.0 | 1799 | $1,950 | $1.08 | 13d | 1 | 1.19mi |
| 3087 SW 172nd Lane Rd Ocala, FL | 4.0 | 2.0 | 1676 | $2,150 | $1.28 | 13d | 1 | 1.21mi |
| 2211 SW 153rd Place Rd Ocala, FL | 4.0 | 2.0 | 1730 | $2,000 | $1.16 | 21d | 1 | 1.22mi |
| 17029 SW 30th Avenue Rd Ocala, FL | 3.0 | 2.0 | 1312 | $1,745 | $1.33 | 13d | 1 | 1.27mi |
Listing history 17 events
-
2026-06-18days on market $299,900 Active 204 DOM
-
2026-06-17days on market $299,900 Active 203 DOM
-
2026-06-16days on market $299,900 Active 202 DOM
-
2026-06-15days on market $299,900 Active 201 DOM
-
2026-06-14days on market $299,900 Active 199 DOM
-
2026-06-13days on market $299,900 Active 198 DOM
-
2026-06-10days on market $299,900 Active 196 DOM
-
2026-06-09days on market $299,900 Active 195 DOM
-
2026-06-08days on market $299,900 Active 194 DOM
-
2026-06-07statusdays on market $299,900 Active 193 DOM
-
2026-05-08status Pending
-
2026-04-29price $299,900
-
2026-04-08price $303,900
-
2026-03-25price $304,900
-
2026-02-11price $309,900
-
2025-10-29$314,900 Active
-
2005-01-21soldstatus $16,000
ⓘ Source: listings_history table (triggers on properties + properties_extension) + one-shot
backfill from property_details.listing_events for pre-trigger history.
Climate risk First Street
- Flood 1/10 Low FEMA zone X (unshaded) · 0% chance over 30 yrs
- Wildfire 5/10 Major
- Heat 8/10 Severe 5 d/yr ≥108°F today · 16 d/yr by 30 yrs out
- Wind 9/10 Extreme 99% chance of damaging wind over 30 yrs
- Air quality 3/10 Moderate 2 unhealthy d/yr today · 4 by 30 yrs out
Nearby sold comps map
Loading sold comps map…
Walkable amenities ~0.75 mi
Loading nearby amenities…
Taxation est. · year 1
- Rental income
- $25,239
- − Mortgage interest
- −$16,799
- − Property taxes
- −$4,498
- − Insurance
- −$1,500
- − Repairs & maintenance
- −$2,019
- − Management
- −$2,019
- − Depreciation
- −$8,724
- Taxable loss
- −$10,321
- Est. tax savings @ 24.0%
- +$2,477
- After-tax cash flow
- $-2,455/yr
For passive investors: Depreciation is non-cash, so a rental often shows a tax loss while cash-flowing — sheltering income. Rental losses are passive: they offset passive income freely, and up to $25,000/yr can offset ordinary (W-2) income if you actively participate and your MAGI is under $100k (phasing out to $0 by $150k); unused losses carry forward. On sale, claimed depreciation is recaptured at up to 25%, and gains may owe capital-gains tax (a 1031 exchange can defer both). Figures are a year-1 estimate at your 24.0% rate — not tax advice; consult a CPA.
Schools (NCES district)
- District
- Marion
- NCES district ID
- 1201260
- Math proficiency
- 42% ▼ -7.00%
- Reading proficiency
- 43% ▼ -4.00%
- Median HH income
- $40,015
- Composite
- 35.61/100
- National rank
- #4890
- State rank
- #61 of 73 in FL
Livability — Marion Oaks
No livability data for this city. (Only ~50 U.S. cities are tracked.)
Census & demographics
- Census place
- Marion Oaks, FL
- County
- Marion County · 315,796 people
- City population
- 25,030
- Metro
- Ocala, FL
- Population (ZIP)
- 26,813
- Household income
- $72,366
- Rent vs Own
- Severe rent burden
- 228.0
Population outlook (Marion County) Hauer SSP2
- Today (2025)
- 365,905 people
- By 2030
- 376,768 · +3.0%
- By 2040
- 396,555 · +8.4%
- By 2050
- 412,723 · +12.8%
- By 2075
- 446,090 · +21.9%
- By 2100
- 436,193 · +19.2%
Race, ethnicity, and origin ACS 2023
- Neighborhood character
- Diverse neighborhood (Simpson 0.69)
- Race & ethnicity
- White 34% Black 33% Hispanic / Latino 29% Two or more races 19% Asian 1%
- Hispanic origin (detail)
- Mexican 1% Puerto Rican 17% Cuban 3%
- Common ancestry
- Hispanic 3% Portuguese 2% Romanian 1%
- Foreign-born
- 17% · Canada, Jamaica
- Languages at home
- 67% English-only · Spanish 27% French/Haitian/Cajun 4% Other Indo-European 1%
Political lean MEDSL · Marion
- 2024 margin
- Solid R (+31.6) · D 33.8% · R 65.5%
- 2008→2024 swing
- -20.0pp toward R · 2008: -11.6pp · 2024: -31.6pp
- All cycles
- 2024: R+31.6 2020: R+25.9 2016: R+26.2 2012: R+16.2 2008: R+11.6
Not yet ingested
- Civics
- —
Market trends
- HPI YoY
- ▼ -45.25%
- Current HPI
- 224.3536
- Rent YoY
- ▼ -0.67%
- Metro
- Ocala, FL
- State GDP YoY
- ▲ 3.28%
- F500 in state
- 36
Industry mix (Fortune 500 HQ in FL)
| Industry | F500 HQs | Revenue |
|---|---|---|
| Industrial Technology | 2 | $29B |
|
||
| Insurance | 2 | $17B |
|
||
| Retail | 1 | $60B |
|
||
| Technology Distribution | 1 | $58B |
|
||
| Homebuilding | 1 | $35B |
|
||
| Technology Manufacturing | 1 | $35B |
|
||
Price history
+1774.4% since first listed7 events — show timeline
- 2026-05-08 Pending — Stellar MLS as Distributed by MLS Grid
- 2026-04-29 Price Changed $299,900 Stellar MLS as Distributed by MLS Grid
- 2026-04-08 Price Changed $303,900 Stellar MLS as Distributed by MLS Grid
- 2026-03-25 Price Changed $304,900 Stellar MLS as Distributed by MLS Grid
- 2026-02-11 Price Changed $309,900 Stellar MLS as Distributed by MLS Grid
- 2025-10-29 Listed $314,900 Stellar MLS as Distributed by MLS Grid
- 2005-01-21 Sold (Public Records) $16,000 Public Records
Property tax history
+10.5%/yrLatest (2025): $427 · +15.9% YoY. Source: county tax records.
Cash-flow waterfall
monthlySold comps — $/sqft
last 12 mo · ≤1 miLoading sold comps…