 🏗️ New Construction
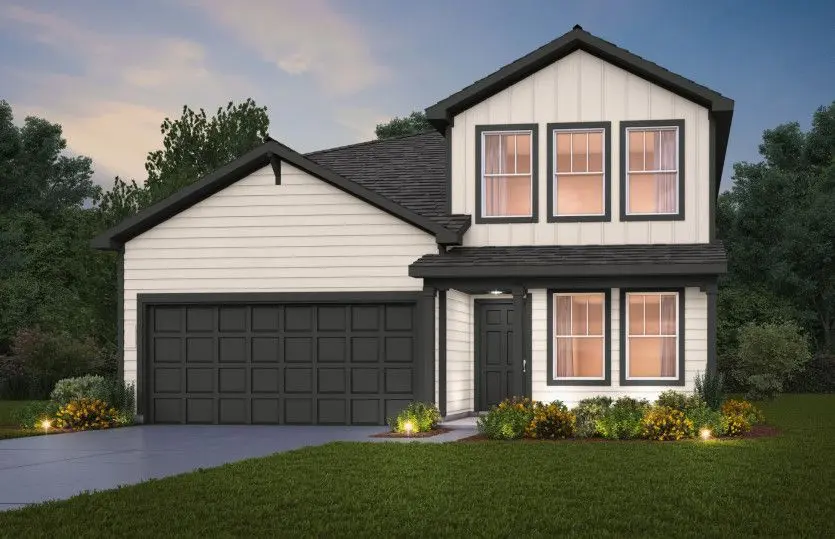
Dinero Plan · Cove, TX
Flood risk No data
- FEMA flood zone
- —
- Chance of flooding over 30 yrs
- —
- Est. flood insurance / yr
- —
Fire risk No data
- Est. fire insurance / yr
- —
Heat risk No data
- Hot days now (above threshold)
- —
- Hot days in 30 yrs
- —
Wind risk No data
- Chance of severe wind over 30 yrs
- —
Air-quality risk No data
- Unhealthy air days now
- —
- Unhealthy air days in 30 yrs
- —
Risk factors via First Street. Map © Google.
Why this score? — see what drove the D grade
The composite is a weighted blend of 9 inputs, each scored 0–100. Each bar is that input's sub-score; the figure is the points it added to the 100-point composite (weight × sub-score).
- Cash flow +10.7/30.0
- ARV discount +7.5/15.0
- Schools +6.2/10.0
- Condition / age +5.0/5.0
- Rent growth +3.4/5.0
- 1% rule +3.2/10.0
- Livability +3.2/5.0
- DSCR +3.1/10.0
- Appreciation +0.0/10.0
$317,990
🖨 Deal sheet (PDF) 📄 Offer letter ✓ Due diligence
Listing remarks MLS
A great home for growing families, the Dinero plan features plenty of space for everyday living and entertaining guests. The study with French doors flanks the front door foyer area, and an island kitchen opens to the café and gathering room. The private owner's suite has dual bathroom vanities and an oversized walk-in closet. The upstairs boasts 3 bedrooms and a loft for the kid's play space.
Key facts
- Loft for play space
- Island kitchen
- 2 garage spots
Tags
Neighborhood map
What this means for you Summary
Snapshot
- This is a 4-bed/2.5-bath single-family listed at $318k. Condition is rated excellent.
Deal economics
- At list price, monthly cash flow is $-155 ($-2k/yr) — negative.
- To cash-flow at today's rent, offer at most $308k (3.3% below list).
- To meet the 1% rule (rent ≥ 1% of price), the offer needs to be $269k (15.4% below list).
- Recommended offer: $269k (15.4% below list) — sets the bar for 1% rule.
Location & tenants
- Location reads 64/100 on livability (#766 in TX) — a middle-class / working-renter tenant base. Strengths: employment A+, housing A+, crime A; Watch: schools D, amenities F, commute F.
- Barbers Hill ISD (rural): math 72% / reading 65% proficiency, ranked #12 of 826 in TX (top 2%) — acceptable for families but not a draw, mixed tenant base, ~2y average lease.
- Market conditions: Rents rising (+3.4%/yr); 781 active listings in the ZIP; 4 comparable units currently listed for rent nearby; rentals at typical pace (median 26d on market — plan ~3-4 weeks tenant-placement turnaround); high-income renter base; 629 units permitted in Chambers County in 2024 (0 in 5+ unit buildings).
Forward outlook
- Local home prices are declining (-3.0%/yr); year-one equity from $2k of loan paydown is wiped out by about $10k of value loss. Plan a longer hold.
- Chambers County population projected at +46% by 2050 — long-run rental-demand tailwind backs the buy-and-hold thesis.
Negotiation context
- It's been on market 464 days — a 12% lower offer ($280k) is reasonable based on typical stale-listing flexibility.
Questions for the listing agent
- What do current leases actually rent for vs. the listed asking? Can we see a recent rent roll and the last 12 months of T-12 income?
- It's been on market 464 days. Have you received any prior offers? Is the seller open to a 15% concession, seller financing, or rate buy-down credit?
- Why hasn't it sold? Are there any deal-killer items the seller is aware of (foundation, flood, title, zoning, code violations)?
- Is there a deadline driving the sale (1031 exchange, divorce, estate, relocation)? That informs how much negotiation room exists.
- Schools are D-rated, which usually means shorter tenancies and higher turnover. Who's the typical renter profile here, and what's been the actual vacancy rate?
- The area grade is low — what's the realistic commute time and amenity access for the typical tenant pool here? Any planned neighborhood developments (good or bad) we should know about?
- What's the average days-on-market for RENTAL listings here right now (not sales)? A rising rental-DOM trend means longer vacancies and softer asking-rent achievability than the comps imply.
- What's the recent tenant-quality profile in this submarket — average credit score on applications, eviction rate, late-payment / NSF rate, and stable-employment percentage? A property-management company in the area should have these aggregated.
- How much new for-sale + rental construction is in the pipeline within 1–3 miles? Heavy new supply typically softens prices + rents 12–24 months out; constrained supply supports both.
Investment metrics
- 1% rule
- 0.82% ✗
- Cap rate
- 5.73%
- Cash-on-cash
- -2.01%
- DSCR
- 0.91
- GRM
- 10.2
CMA / ARV
- ARV (median comp)
- $329,990
- List price
- $317,990
- Delta
- -3.64%
- Verdict
- FAIR
- Comps
- 20 within 1.0 mi
Show comp detail 12 sales within ~0.75 mi
| Address | Dist | Beds/Ba | Sqft | Sold | Price | $/sf | Match |
|---|---|---|---|---|---|---|---|
| 427 Ruby Ford Dr | 0.13mi | 4/2.5 | 2,285 (0%) | 2mo | $319,990 | $140 | 92 |
| 6739 Camila St | 0.19mi | 4/2.5 | 2,285 (0%) | 2mo | $314,990 | $138 | 90 |
| 523 Louis Ln | 0.23mi | 4/2.5 | 2,218 (-3%) | 6mo | $299,990 | $135 | 79 |
| 6735 Camila St | 0.18mi | 4/2.5 | 2,466 (+8%) | 2mo | $314,990 | $128 | 77 |
| 6703 Alejandro Pl | 0.20mi | 4/3.0 | 2,055 (-10%) | 0mo | $341,580 | $166 | 72 |
| 6711 Alejandro Pl | 0.21mi | 4/2.5 | 2,530 (+11%) | 1mo | $379,990 | $150 | 71 |
| 7118 Thomas James Ct | 0.53mi | 4/2.5 | 2,218 (-3%) | 1mo | $326,130 | $147 | 69 |
| 422 Ruby Ford Dr | 0.15mi | 4/3.0 | 2,055 (-10%) | 6mo | $359,950 | $175 | 69 |
| 1911 Lafayette Ln | 0.63mi | 4/3.0 | 2,254 (-1%) | 6mo | $429,999 | $191 | 61 |
| 1815 Magnolia Bnd | 0.59mi | 3/2.5 (-1) | 2,100 (-8%) | 0mo | $410,000 | $195 | 54 |
| 1914 Lafayette Ln | 0.59mi | 4/2.5 | 2,514 (+10%) | 6mo | $439,000 | $175 | 51 |
| 6723 Camila St | 0.29mi | 3/2.0 (-1) | 1,943 (-15%) | 4mo | $309,990 | $160 | 51 |
Match score weights: distance 35% · size 25% · config 20% · recency 20%. Top-matched comps best support the ARV.
Projected returns pro-forma
-3.0% appreciation · 3.42% rent growth · sell at horizon
- IRR
- -19.1%
- Equity multiple
- 0.33×
- Total profit
- $-62,154
- Equity at exit
- $49,203
- IRR
- -10.9%
- Equity multiple
- 0.33×
- Total profit
- $-61,933
- Equity at exit
- $28,532
Cash invested: $92,397 (down + closing). Projections, not guarantees.
Landlord ↔ Tenant lean methodology
- Overall (STATE)
- 87 Strongly Landlord-Friendly
- State Texas
- 87 Strongly Landlord-Friendly · R+5
- County
- — inherits STATE
- City
- — inherits STATE
ZIP-level market 77523
- Home prices YoY
- -31.5%
- Rents YoY
- 3.4%
- Active inventory
- 781
- Price-to-rent
- 9.8×
Monthly cashflow live
- Estimated rent
- $2,691 medium interval (Pro) →
- Mortgage (P&I)
- −$1,731
- Tax est. 1.5%
- −$412 /mo · $4,950/yr
- Insurance
- −$137
- HOA
- −$0
- Vacancy / Maint / Mgmt
- −$565
- Net cashflow
- $-155
Break-even live
Sensitivity live
| Price | -10% $73 | -5% $-41 | +0% $-155 | +5% $-269 | +10% $-383 |
|---|---|---|---|---|---|
| Rent | -10% $-367 | -5% $-261 | +0% $-155 | +5% $-49 | +10% $58 |
| Rate | -1.0pp $11 | -0.5pp $-71 | base $-155 | +0.5pp $-240 | +1.0pp $-327 |
UW: 25.0% down · 7.5% · 30yr · 1.5% tax · 5.0% vac · 8.0% maint · 8.0% mgmt
Financing live
Cash to close
- Down payment
- $82,498
- Closing costs
- $9,900
- Reserves months
- —
- Total cash needed
- —
Loan-product check · same deal, 3 products live
Conventional
25% down · 7.5% · 30yr
- Down + closing
- —
- Monthly P&I
- —
- Monthly cashflow
- —
- DSCR
- —
- Eligible?
- —
Personal DTI + credit; lowest rate.
DSCR
20% down · 8.5% · 30yr
- Down + closing
- —
- Monthly P&I
- —
- Monthly cashflow
- —
- DSCR
- —
- Eligible?
- —
No personal income docs; deal must DSCR.
Hard money
10% down · 12.0% · 12mo
- Down + closing
- —
- Monthly P&I
- —
- Monthly cashflow
- —
- DSCR
- —
- Eligible?
- —
Short-term bridge; refi at stabilization.
Rent comps 4 comps
| Address | Beds | Baths | Sqft | Rent | $/sqft | DOM | Units | Dist |
|---|---|---|---|---|---|---|---|---|
| 14930 Spring Forest Ln Baytown, TX | 4.0 | 2.0 | 1829 | $2,750 | $1.50 | 45d | 1 | 0.65mi |
| 14739 Sweet Water Dr Baytown, TX | 4.0 | 2.0 | 1821 | $2,395 | $1.32 | 3d | 1 | 0.66mi |
| 8411 Hannah Rd Baytown, TX | 4.0 | 2.5 | 2329 | $2,195 | $0.94 | 26d | 1 | 1.12mi |
| 8414 Liberty Sky Rd Baytown, TX | 3.0 | 2.5 | 2046 | $2,095 | $1.02 | 26d | 1 | 1.13mi |
Listing history 18 events
-
2026-06-21days on market $317,990 Active 464 DOM
-
2026-06-18days on market $317,990 Active 461 DOM
-
2026-06-17days on market $317,990 Active 460 DOM
-
2026-06-16days on market $317,990 Active 459 DOM
-
2026-06-15days on market $317,990 Active 458 DOM
-
2026-06-13days on market $317,990 Active 456 DOM
-
2026-06-09days on market $317,990 Active 452 DOM
-
2026-06-08days on market $317,990 Active 451 DOM
-
2026-06-07days on market $317,990 Active 450 DOM
-
2026-06-04days on market $317,990 Active 447 DOM
-
2026-06-03days on market $317,990 Active 446 DOM
-
2026-06-02days on market $317,990 Active 445 DOM
-
2026-06-01days on market $317,990 Active 444 DOM
-
2026-05-31days on market $317,990 Active 443 DOM
-
2026-04-08price $317,990 403-char remark
Show marketing remark (403 chars)
A great home for growing families, the Dinero plan features plenty of space for everyday living and entertaining guests. The study with French doors flanks the front door foyer area, and an island kitchen opens to the café and gathering room. The private owner's suite has dual bathroom vanities and an oversized walk-in closet. The upstairs boasts 3 bedrooms and a loft for the kid's play space.
-
2026-01-11price $315,990 403-char remark
Show marketing remark (403 chars)
A great home for growing families, the Dinero plan features plenty of space for everyday living and entertaining guests. The study with French doors flanks the front door foyer area, and an island kitchen opens to the café and gathering room. The private owner's suite has dual bathroom vanities and an oversized walk-in closet. The upstairs boasts 3 bedrooms and a loft for the kid's play space.
-
2025-06-13price $327,990 403-char remark
Show marketing remark (403 chars)
A great home for growing families, the Dinero plan features plenty of space for everyday living and entertaining guests. The study with French doors flanks the front door foyer area, and an island kitchen opens to the café and gathering room. The private owner's suite has dual bathroom vanities and an oversized walk-in closet. The upstairs boasts 3 bedrooms and a loft for the kid's play space.
-
2025-03-15$324,990 Active 403-char remark
Show marketing remark (403 chars)
A great home for growing families, the Dinero plan features plenty of space for everyday living and entertaining guests. The study with French doors flanks the front door foyer area, and an island kitchen opens to the café and gathering room. The private owner's suite has dual bathroom vanities and an oversized walk-in closet. The upstairs boasts 3 bedrooms and a loft for the kid's play space.
ⓘ Source: listings_history table (triggers on properties + properties_extension) + one-shot
backfill from property_details.listing_events for pre-trigger history.
Nearby sold comps map
Loading sold comps map…
Walkable amenities ~0.75 mi
Loading nearby amenities…
Taxation est. · year 1
- Rental income
- $32,288
- − Mortgage interest
- −$18,485
- − Property taxes
- −$4,950
- − Insurance
- −$1,650
- − Repairs & maintenance
- −$2,583
- − Management
- −$2,583
- − Depreciation
- −$9,600
- Taxable loss
- −$7,562
- Est. tax savings @ 24.0%
- +$1,815
- After-tax cash flow
- $-43/yr
For passive investors: Depreciation is non-cash, so a rental often shows a tax loss while cash-flowing — sheltering income. Rental losses are passive: they offset passive income freely, and up to $25,000/yr can offset ordinary (W-2) income if you actively participate and your MAGI is under $100k (phasing out to $0 by $150k); unused losses carry forward. On sale, claimed depreciation is recaptured at up to 25%, and gains may owe capital-gains tax (a 1031 exchange can defer both). Figures are a year-1 estimate at your 24.0% rate — not tax advice; consult a CPA.
Condition & rehab AI · 12 photos
This home is in excellent condition with a modern kitchen, good exterior, and well-maintained landscaping. It is move-in ready and would benefit from a fresh coat of paint and landscaping improvements.
Value-add opportunities
- Resale Painting the exterior — Fresh paint can enhance curb appeal and property value
- Rental Landscaping improvements — A well-maintained yard can attract more renters
- Both Add a smart home system — Modern technology can increase both resale and rental value
Renovation cost estimate screening
Value-add ROI direction
- Resale Painting the exterior — Fresh paint can enhance curb appeal and property value ↑
- Rental Landscaping improvements — A well-maintained yard can attract more renters ↑
- Both Add a smart home system — Modern technology can increase both resale and rental value ↑
ⓘ Cost ranges are severity-bucket heuristics (US national rule-of-thumb). Get contractor quotes + a written scope before underwriting a rehab budget.
Schools (NCES district)
- District
- Barbers Hill ISD
- NCES district ID
- 4809450
- Math proficiency
- 72% ▼ -5.00%
- Reading proficiency
- 65% ▼ -1.00%
- Median HH income
- $87,257
- Composite
- 61.73/100
- National rank
- #737
- State rank
- #12 of 826 in TX
Livability — Cove
- Score
- 64/100
- State rank
- #766
- US rank
- #13996
Category grades
Schools grade is shown separately in the Schools card above.
Census & demographics
- County
- Chambers County · 30,186 people
- Metro
- Houston-The Woodlands-Sugar Land, TX
- Population (ZIP)
- 30,186
- Household income
- $124,188
- Rent vs Own
- Severe rent burden
- 549.0
Population outlook (Chambers County) Hauer SSP2
- Today (2025)
- 46,946 people
- By 2030
- 51,094 · +8.8%
- By 2040
- 59,578 · +26.9%
- By 2050
- 68,318 · +45.5%
- By 2075
- 90,485 · +92.7%
- By 2100
- 104,885 · +123.4%
Race, ethnicity, and origin ACS 2023
- Neighborhood character
- Majority White (62%)
- Race & ethnicity
- White 62% Hispanic / Latino 25% Two or more races 11% Black 8% Asian 2%
- Hispanic origin (detail)
- Mexican 22%
- Common ancestry
- Lithuanian 1% Slovak 1% Serbian 1%
- Foreign-born
- 9% · Canada
- Languages at home
- 82% English-only · Spanish 17%
Political lean MEDSL · Chambers
- 2024 margin
- Solid R (+65.6) · D 16.8% · R 82.4%
- 2008→2024 swing
- -14.4pp toward R · 2008: -51.2pp · 2024: -65.6pp
- All cycles
- 2024: R+65.6 2020: R+61.7 2016: R+62.1 2012: R+61.1 2008: R+51.2
Not yet ingested
- Civics
- —
Market trends
- HPI YoY
- ▼ -102.33%
- Current HPI
- 222.6999
- Rent YoY
- ▲ 3.42%
- Metro
- Houston-The Woodlands-Sugar Land, TX
- State GDP YoY
- ▲ 3.95%
- F500 in state
- 110
Industry mix (Fortune 500 HQ in TX)
| Industry | F500 HQs | Revenue |
|---|---|---|
| Energy | 16 | $1,198B |
|
||
| Technology | 5 | $198B |
|
||
| Engineering / Construction | 4 | $72B |
|
||
| Energy Services | 3 | $60B |
|
||
| Utilities | 3 | $41B |
|
||
| Healthcare | 2 | $330B |
|
||
Price history
-2.2% since first listed4 events — show timeline
- 2026-04-08 Price Changed $317,990 Zillow
- 2026-01-11 Price Changed $315,990 Zillow
- 2025-06-13 Price Changed $327,990 Zillow
- 2025-03-15 Listed $324,990 Zillow
Cash-flow waterfall
monthlySold comps — $/sqft
last 12 mo · ≤1 miLoading sold comps…