 Multi-family
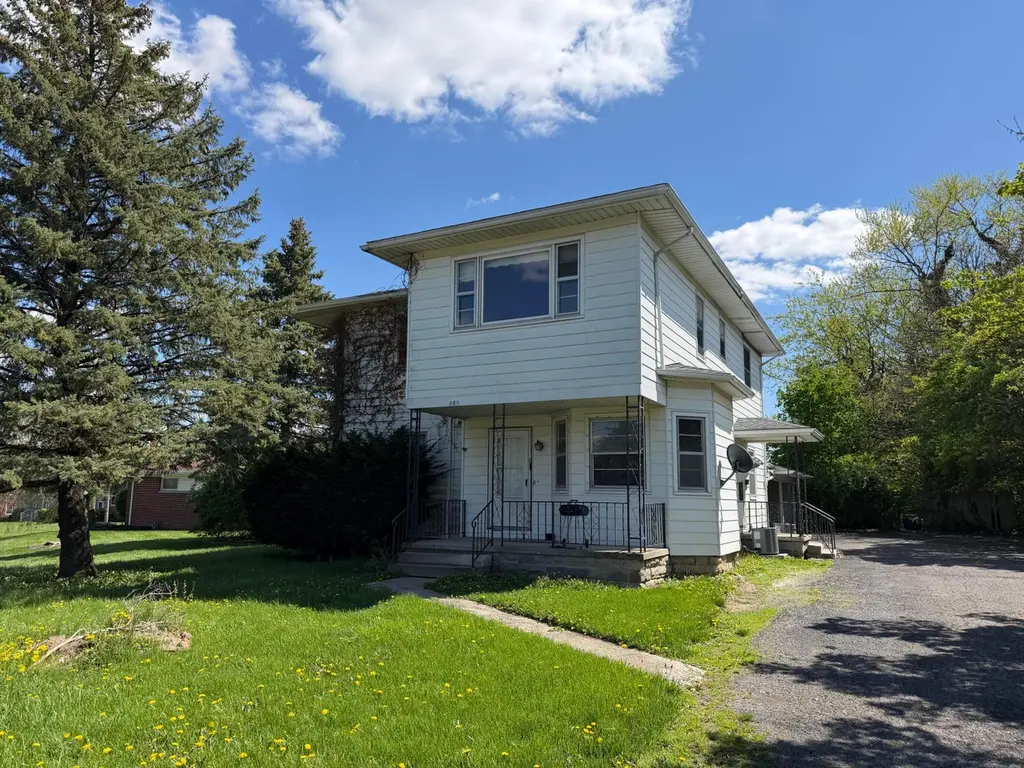
885 Mt Vernon Ave · Marion, OH
Flood risk 1/10 · Minimal
- FEMA flood zone
- X (unshaded)
- Chance of flooding over 30 yrs
- 0.0%
- Est. flood insurance / yr
- $473 – $860
Fire risk 1/10 · Minimal
- Est. fire insurance / yr
- $713 – $1,323
Heat risk 3/10 · Minor
- Hot days now (above 100°F)
- 7 days/yr
- Hot days in 30 yrs
- 17 days/yr
Wind risk 2/10 · Minimal
- Chance of severe wind over 30 yrs
- —
Air-quality risk 2/10 · Minimal
- Unhealthy air days now
- 1 days/yr
- Unhealthy air days in 30 yrs
- 1 days/yr
Risk factors via First Street. Map © Google.
Why this score? — see what drove the D grade
The composite is a weighted blend of 9 inputs, each scored 0–100. Each bar is that input's sub-score; the figure is the points it added to the 100-point composite (weight × sub-score).
- Cash flow +22.1/30.0
- DSCR +7.1/10.0
- 1% rule +5.3/10.0
- Livability +3.2/5.0
- Rent growth +2.5/5.0
- Condition / age +2.5/5.0
- Schools +2.2/10.0
- ARV discount +0.0/15.0
- Appreciation +0.0/10.0
$219,900
🖨 Deal sheet (PDF) 📄 Offer letter ✓ Due diligence
Multi-family units
County records classify this as Multi-Family (2-4 Unit). Listing-text estimate: 1 unit. estimate disagrees with records
Listing remarks MLS
Duplex on east side of city with separate utilities. Off street parking and offering attached double carport in rear. 100% Occupied with same tenants for years. Laundry facilities are shared by both tenants. ;null
Key facts
- 7,405 sq ft lot
- 4 parking spots
- Built 1907
Property features AI
Finance
- Other: Annual tax amount (2025): $2,342
- Financial info: Two-unit property; Net operating income: $13,714; Operating expenses: $2,486
Exterior
- Parking: 4 parking spaces
- Utilities: Public water; Public sewer; Natural gas available; Electricity available
- Home design: Duplex; Built in 1907 (effectively updated 2022)
- Construction: Year built 1907; Effective year built 2022
- Exterior features: Lot approximately 0.17 acre; Storm sewer available
Interior
- Heating & cooling: Central Air; Forced Air
- Interior features: Central air conditioning; Forced air heating
Neighborhood map
What this means for you Summary
Snapshot
- This is a 4-bed/2.0-bath multifamily listed at $220k.
Deal economics
- At list price, monthly cash flow is $356 ($4k/yr) — positive.
- The deal already cash-flows at list — no discount required.
- Meets the 1% rule at list price ($2k rent vs $220k).
- Recommended offer: $207k (6.0% below list) — sets the bar for market timing.
- Cap rate 8.2% vs local median 6.8% in Marion — meaningfully above typical; check what's discounted (condition, days-on-market, listing class) to confirm the premium yield is real.
Location & tenants
- Location reads 65/100 on livability (#704 in OH) — a middle-class / working-renter tenant base. Strengths: cost of living A+, housing A+; Watch: crime D+, amenities F, commute F.
- Marion City (town): math 22% / reading 31% proficiency, ranked #600 of 656 in OH (top 92%) — low school quality limits family demand, transient renter base, plan for 1-2y turnover; 67% free/reduced lunch — lower-income household profile, screen leases tightly.
- Zoned schools: Benjamin Harrison Elementary School (math 40% / reading 51%, grade D-, #980 of 1,584 statewide, top 62%, 391 students, 0% FRL); Ulysses S. Grant Middle School (math 22% / reading 25%, grade F, #597 of 654 statewide, top 92%, 998 students, 0% FRL); Harding High School (math 16% / reading 36%, grade F, #636 of 781 statewide, top 82%, 1,050 students, 0% FRL) — zoned schools average 0% FRL vs 67% district-wide (67 pts lower); this property's tenant base skews higher-income than the district average.
- Market conditions: 208 active listings in the ZIP; 53 units permitted in Marion County in 2024 (0 in 5+ unit buildings).
- At $2,273/mo this rent would consume 50% of the median local household income ($55k/yr) (locally 1554% of renters already pay >50% of income on rent) — very limited rent-growth headroom before tenants either downsize or default.
Forward outlook
- Local home prices are declining (-3.0%/yr); year-one equity from $2k of loan paydown is wiped out by about $7k of value loss. Plan a longer hold.
- Marion County population projected at -18% by 2050 — secular population decline; favor cash flow + early exit over multi-decade hold.
Negotiation context
- It's been on market 63 days — a 6% lower offer ($207k) is reasonable based on typical stale-listing flexibility.
- 3 sale attempts since 8y ago with the ask held roughly flat each time — persistent listings suggest the price (not the market) is what's stuck; bring a comps-based counter.
- Current owner paid $109k; list at $220k implies a 102% gain — meaningful room to come down on a strong offer.
Risks & watch-outs
- Watch-outs: built in 1907 — expect roof / HVAC / electrical / plumbing capex.
Questions for the listing agent
- It's been on market 63 days. Have you received any prior offers? Is the seller open to a 6% concession, seller financing, or rate buy-down credit?
- Built in 1907 — when were the roof, HVAC, electrical panel, plumbing, and water heater last replaced?
- Why hasn't it sold? Are there any deal-killer items the seller is aware of (foundation, flood, title, zoning, code violations)?
- Is there a deadline driving the sale (1031 exchange, divorce, estate, relocation)? That informs how much negotiation room exists.
- Schools are D-rated, which usually means shorter tenancies and higher turnover. Who's the typical renter profile here, and what's been the actual vacancy rate?
- Crime grade is D in this area — have there been break-ins, vandalism, or insurance claims at this property in the last 3 years? What carrier currently insures it and at what premium?
- The area grade is low — what's the realistic commute time and amenity access for the typical tenant pool here? Any planned neighborhood developments (good or bad) we should know about?
- What's the average days-on-market for RENTAL listings here right now (not sales)? A rising rental-DOM trend means longer vacancies and softer asking-rent achievability than the comps imply.
- What's the recent tenant-quality profile in this submarket — average credit score on applications, eviction rate, late-payment / NSF rate, and stable-employment percentage? A property-management company in the area should have these aggregated.
- How much new apartment / multifamily construction is in the pipeline within 1–3 miles? Heavy new supply (>2% of stock underway) typically softens rents 12–24 months out; light construction supports rent growth.
Investment metrics
- 1% rule
- 1.03% ✓
- Cap rate
- 8.23%
- Cash-on-cash
- 6.93%
- DSCR
- 1.31
- GRM
- 8.1
CMA / ARV
- ARV (median comp)
- $149,535
- List price
- $219,900
- Delta
- 47.06%
- Verdict
- OVERPRICED
- Comps
- 15 within 1.0 mi
Show comp detail 1 sale within ~0.75 mi
| Address | Dist | Beds/Ba | Sqft | Sold | Price | $/sf | Match |
|---|---|---|---|---|---|---|---|
| 292 Belmont St | 0.71mi | 4/— | 2,256 (+5%) | 14mo | $156,000 | $69 | 46 |
Match score weights: distance 35% · size 25% · config 20% · recency 20%. Top-matched comps best support the ARV.
Projected returns pro-forma
-3.0% appreciation · 3.0% rent growth · sell at horizon
- IRR
- -5.7%
- Equity multiple
- 0.79×
- Total profit
- $-12,994
- Equity at exit
- $32,788
- IRR
- 4.0%
- Equity multiple
- 1.29×
- Total profit
- $17,795
- Equity at exit
- $19,013
Cash invested: $61,572 (down + closing). Projections, not guarantees.
Landlord ↔ Tenant lean methodology
- Overall (STATE)
- 73 Landlord-Friendly
- State Ohio
- 73 Landlord-Friendly · R+6
- County
- — inherits STATE
- City
- — inherits STATE
ZIP-level market 43302
- Home prices YoY
- -33.9%
- Active inventory
- 208
- Price-to-rent
- 16.1×
Monthly cashflow live
- Estimated rent
- $2,273 medium interval (Pro) →
- Mortgage (P&I)
- −$1,153
- Tax from tax record
- −$195 /mo · $2,342/yr
- Insurance
- −$92
- HOA
- −$0
- Vacancy / Maint / Mgmt
- −$477
- Net cashflow
- $356
Break-even live
Sensitivity live
| Price | -10% $480 | -5% $418 | +0% $356 | +5% $293 | +10% $231 |
|---|---|---|---|---|---|
| Rent | -10% $176 | -5% $266 | +0% $356 | +5% $445 | +10% $535 |
| Rate | -1.0pp $466 | -0.5pp $412 | base $356 | +0.5pp $299 | +1.0pp $241 |
2-unit breakdown (identical units grouped — click to expand)
| Units | Beds | Baths | Est. rent |
|---|---|---|---|
| 2× units | 2 | 1 | $2,274 |
| #1 | 2 | 1 | $1,137 |
| #2 | 2 | 1 | $1,137 |
| Total (2 units) | $2,273 | ||
UW: 25.0% down · 7.5% · 30yr · 1.5% tax · 5.0% vac · 8.0% maint · 8.0% mgmt
Financing live
Cash to close
- Down payment
- $54,975
- Closing costs
- $6,597
- Reserves months
- —
- Total cash needed
- —
Loan-product check · same deal, 3 products live
Conventional
25% down · 7.5% · 30yr
- Down + closing
- —
- Monthly P&I
- —
- Monthly cashflow
- —
- DSCR
- —
- Eligible?
- —
Personal DTI + credit; lowest rate.
DSCR
20% down · 8.5% · 30yr
- Down + closing
- —
- Monthly P&I
- —
- Monthly cashflow
- —
- DSCR
- —
- Eligible?
- —
No personal income docs; deal must DSCR.
Hard money
10% down · 12.0% · 12mo
- Down + closing
- —
- Monthly P&I
- —
- Monthly cashflow
- —
- DSCR
- —
- Eligible?
- —
Short-term bridge; refi at stabilization.
Listing history 25 events
-
2026-06-21days on market $219,900 Active 63 DOM
-
2026-06-19days on market $219,900 Active 61 DOM
-
2026-06-18days on market $219,900 Active 60 DOM
-
2026-06-17days on market $219,900 Active 59 DOM
-
2026-06-16days on market $219,900 Active 58 DOM
-
2026-06-15days on market $219,900 Active 57 DOM
-
2026-06-14days on market $219,900 Active 55 DOM
-
2026-06-12days on market $219,900 Active 54 DOM
-
2026-06-09days on market $219,900 Active 51 DOM
-
2026-06-08days on market $219,900 Active 50 DOM
-
2026-06-07days on market $219,900 Active 49 DOM
-
2026-06-05days on market $219,900 Active 46 DOM
-
2026-06-03days on market $219,900 Active 45 DOM
-
2026-06-02days on market $219,900 Active 44 DOM
-
2026-06-01days on market $219,900 Active 43 DOM
-
2026-05-31days on market $219,900 Active 42 DOM
-
2026-05-30days on market $219,900 Active 41 DOM
-
2026-04-17$219,900 Active 266-char remark
-
2025-02-11historical
-
2024-06-03$215,000 Active
-
2021-05-22historical
Show marketing remark (213 chars)
Duplex on east side of city with separate utilities. Off street parking and offering attached double carport in rear. 100% Occupied with same tenants for years. Laundry facilities are shared by both tenants. ;null
-
2019-05-15soldstatus $108,900 Closed
Show marketing remark (213 chars)
Duplex on east side of city with separate utilities. Off street parking and offering attached double carport in rear. 100% Occupied with same tenants for years. Laundry facilities are shared by both tenants. ;null
-
2018-04-16$119,900
Show marketing remark (213 chars)
Duplex on east side of city with separate utilities. Off street parking and offering attached double carport in rear. 100% Occupied with same tenants for years. Laundry facilities are shared by both tenants. ;null
-
2005-06-15soldstatus $140,000
-
2001-05-18soldstatus $110,000
ⓘ Source: listings_history table (triggers on properties + properties_extension) + one-shot
backfill from property_details.listing_events for pre-trigger history.
Tax reassessment forecast OH · Partial reset (capped growth)
- Current annual tax
- $2,342 · $195/mo
- Projected year-2 tax
- $2,886 · $241/mo
- Expected delta
- +$544/yr (+$45/mo · 23.2%)
ⓘ Screening estimate from a state-policy table — verify with the county assessor before closing.
Climate risk First Street
- Flood 1/10 Low FEMA zone X (unshaded) · 0% chance over 30 yrs
- Wildfire 1/10 Low
- Heat 3/10 Moderate 7 d/yr ≥100°F today · 17 d/yr by 30 yrs out
- Wind 2/10 Low
- Air quality 2/10 Low 1 unhealthy d/yr today · 1 by 30 yrs out
Nearby sold comps map
Loading sold comps map…
Walkable amenities ~0.75 mi
Loading nearby amenities…
Taxation est. · year 1
- Rental income
- $27,276
- − Mortgage interest
- −$12,318
- − Property taxes
- −$2,342
- − Insurance
- −$1,100
- − Repairs & maintenance
- −$2,182
- − Management
- −$2,182
- − Depreciation
- −$6,397
- Taxable income
- $755
- Est. tax owed @ 24.0%
- −$181
- After-tax cash flow
- $4,087/yr
For passive investors: Depreciation is non-cash, so a rental often shows a tax loss while cash-flowing — sheltering income. Rental losses are passive: they offset passive income freely, and up to $25,000/yr can offset ordinary (W-2) income if you actively participate and your MAGI is under $100k (phasing out to $0 by $150k); unused losses carry forward. On sale, claimed depreciation is recaptured at up to 25%, and gains may owe capital-gains tax (a 1031 exchange can defer both). Figures are a year-1 estimate at your 24.0% rate — not tax advice; consult a CPA.
Schools (NCES district)
- District
- Marion City
- NCES district ID
- 3904433
- Math proficiency
- 22% ▼ -17.00%
- Reading proficiency
- 31% ▼ -8.00%
- Median HH income
- $32,327
- Composite
- 21.58/100
- National rank
- #8306
- State rank
- #600 of 656 in OH
Livability — Marion
- Score
- 65/100
- State rank
- #704
- US rank
- #12605
Category grades
Schools grade is shown separately in the Schools card above.
Census & demographics
- Census place
- Marion, OH
- County
- Marion County · 53,702 people
- City population
- 53,702
- Metro
- Marion, OH
- Population (ZIP)
- 53,702
- Household income
- $55,057
- Rent vs Own
- Severe rent burden
- 1554.0
Population outlook (Marion County) Hauer SSP2
- Today (2025)
- 62,078 people
- By 2030
- 60,049 · -3.3%
- By 2040
- 55,413 · -10.7%
- By 2050
- 50,604 · -18.5%
- By 2075
- 40,162 · -35.3%
- By 2100
- 29,105 · -53.1%
Race, ethnicity, and origin ACS 2023
- Neighborhood character
- Predominantly White (85%)
- Race & ethnicity
- White 85% Black 6% Two or more races 6% Hispanic / Latino 3%
- Common ancestry
- Slovak 2% Romanian 2% Lithuanian 2%
- Foreign-born
- 2% · Canada
- Languages at home
- 96% English-only · Spanish 2% Arabic 1%
Political lean MEDSL · Marion
- 2024 margin
- Solid R (+41.4) · D 28.9% · R 70.3%
- 2008→2024 swing
- -32.5pp toward R · 2008: -8.9pp · 2024: -41.4pp
- All cycles
- 2024: R+41.4 2020: R+38.6 2016: R+34.4 2012: R+7.6 2008: R+8.9
Not yet ingested
- Civics
- —
Market trends
- HPI YoY
- ▼ -114.52%
- Current HPI
- 223.5344
- Rent YoY
- —
- Metro
- Marion, OH
- State GDP YoY
- ▲ 1.98%
- F500 in state
- 48
Industry mix (Fortune 500 HQ in OH)
| Industry | F500 HQs | Revenue |
|---|---|---|
| Insurance | 3 | $145B |
|
||
| Industrial Machinery | 3 | $49B |
|
||
| Financial Services | 3 | $24B |
|
||
| Consumer Goods | 2 | $93B |
|
||
| Aerospace / Defense | 2 | $47B |
|
||
| Utilities | 2 | $33B |
|
||
Price history
+99.9% since first listed8 events — show timeline
- 2026-04-17 Listed $219,900 CBRMLS
- 2025-02-11 Listing Removed — CBRMLS
- 2024-06-03 Listed $215,000 CBRMLS
- 2021-05-22 Listing Removed — CBRMLS
- 2019-05-15 Sold (MLS) $108,900 CBRMLS
- 2018-04-16 Listed $119,900 CBRMLS
- 2005-06-15 Sold (Public Records) $140,000 Public Records
- 2001-05-18 Sold (Public Records) $110,000 Public Records
Property tax history
+4.0%/yrLatest (2025): $2,342 · +0.0% YoY. Source: county tax records.
Cash-flow waterfall
monthlySold comps — $/sqft
last 12 mo · ≤1 miLoading sold comps…