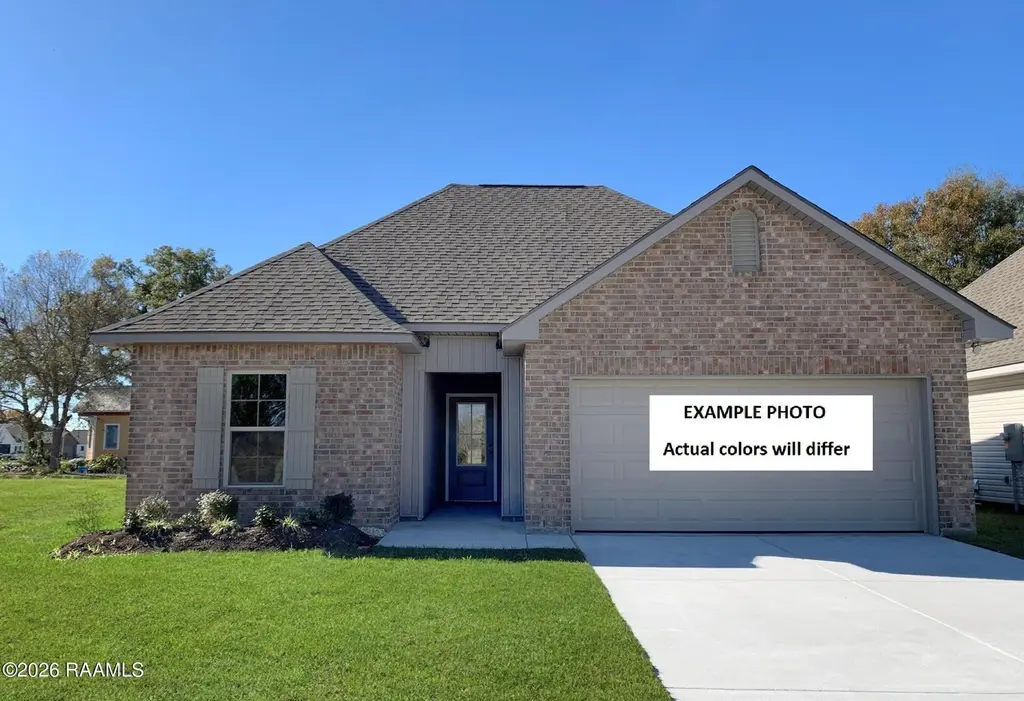
 🏗️ New Construction
140 Ember Ridge Ln · Duson, LA
Flood risk No data
- FEMA flood zone
- —
- Chance of flooding over 30 yrs
- —
- Est. flood insurance / yr
- —
Fire risk No data
- Est. fire insurance / yr
- —
Heat risk No data
- Hot days now (above threshold)
- —
- Hot days in 30 yrs
- —
Wind risk No data
- Chance of severe wind over 30 yrs
- —
Air-quality risk No data
- Unhealthy air days now
- —
- Unhealthy air days in 30 yrs
- —
Risk factors via First Street. Map © Google.
Why this score? — see what drove the D grade
The composite is a weighted blend of 9 inputs, each scored 0–100. Each bar is that input's sub-score; the figure is the points it added to the 100-point composite (weight × sub-score).
- Cash flow +12.0/30.0
- ARV discount +7.5/15.0
- Condition / age +4.0/5.0
- 1% rule +3.6/10.0
- Schools +3.6/10.0
- DSCR +3.5/10.0
- Livability +3.3/5.0
- Rent growth +2.5/5.0
- Appreciation +0.0/10.0
$221,795
🖨 Deal sheet 📄 Offer letter ✓ Due diligence
Listing remarks
* SOLD BEFORE LISTED * Brand New Construction built by DSLD HOMES in Rosemont Village. This CONNELLY IV G has an open floor plan with upgraded stainless appliances, blinds for windows, luxury vinyl plank flooring added in bedrooms, undermount cabinet lighting & more. Special plan features: granite counters, kitchen island & walk-in pantry, undermount single bowl kitchen sink, vinyl plank flooring in living room and all wet areas, walk-in closet, garden tub & separate shower in primary suite, smart connect Wi-Fi thermostat, structured wiring panel box, post tension slab, fully sodded yard with seasonal landscaping package, Low E tilt-in windows, radiant barrier roof decki
Key facts
- 8,276 sq ft lot
- 2 garage spots
- Built 2026
Neighborhood map
What this means for you Summary
Snapshot
- This is a 3-bed/2.0-bath single-family listed at $222k. Condition is rated good.
Deal economics
- At list price, monthly cash flow is $-54 ($-646/yr) — negative.
- To cash-flow at today's rent, offer at most $212k (4.2% below list).
- To meet the 1% rule (rent ≥ 1% of price), the offer needs to be $190k (14.3% below list).
- Recommended offer: $190k (14.3% below list) — sets the bar for 1% rule.
Location & tenants
- Location reads 66/100 on livability (#134 in LA) — a middle-class / working-renter tenant base. Strengths: cost of living A+, housing A+, health & safety B+; Watch: amenities F, commute F, employment F.
- Lafayette Parish (urban): math 38% / reading 46% proficiency, ranked #19 of 98 in LA (top 19%) — families likely to look elsewhere, expect single-tenant / working-renter base with shorter leases.
- Zoned schools: Duson Elementary School (math 37% / reading 32%, grade F, #284 of 646 statewide, top 46%, 242 students, 74% FRL); Scott Middle School (math 20% / reading 28%, grade F, #143 of 218 statewide, top 65%, 559 students, 65% FRL); Acadiana High School (math 31% / reading 29%, grade F, #125 of 265 statewide, top 47%, 1,813 students, 56% FRL).
- Zoned-school proficiency averages 30% at this address vs 42% district-wide (-12 pts) — the specific schools serving this property underperform the Lafayette Parish average; the district grade overstates school quality for this exact location.
- Market conditions: 196 active listings in the ZIP; 1 comparable units currently listed for rent nearby; 1,585 units permitted in Lafayette Parish in 2024 (10 in 5+ unit buildings).
Forward outlook
- Local home prices are declining (-3.0%/yr); year-one equity from $2k of loan paydown is wiped out by about $7k of value loss. Plan a longer hold.
- Lafayette County population projected at +34% by 2050 — long-run rental-demand tailwind backs the buy-and-hold thesis.
Negotiation context
- Only 0 days on market — expect competitive offers; lowballing is unlikely to land.
Questions for the listing agent
- What do current leases actually rent for vs. the listed asking? Can we see a recent rent roll and the last 12 months of T-12 income?
- What does the HOA fee cover, when was the last increase, and are there any pending special assessments or reserve-fund shortfalls?
- Is there a deadline driving the sale (1031 exchange, divorce, estate, relocation)? That informs how much negotiation room exists.
- The area grade is low — what's the realistic commute time and amenity access for the typical tenant pool here? Any planned neighborhood developments (good or bad) we should know about?
- What's the average days-on-market for RENTAL listings here right now (not sales)? A rising rental-DOM trend means longer vacancies and softer asking-rent achievability than the comps imply.
- What's the recent tenant-quality profile in this submarket — average credit score on applications, eviction rate, late-payment / NSF rate, and stable-employment percentage? A property-management company in the area should have these aggregated.
- How much new for-sale + rental construction is in the pipeline within 1–3 miles? Heavy new supply typically softens prices + rents 12–24 months out; constrained supply supports both.
Investment metrics
- 1% rule
- 0.86% ✗
- Cap rate
- 6.00%
- Cash-on-cash
- -1.05%
- DSCR
- 0.95
- GRM
- 9.7
CMA / ARV
- ARV (on-the-fly)
- $220,206
- Comps found
- 12
Show comp detail 12 sales within ~0.75 mi
| Address | Dist | Beds/Ba | Sqft | Sold | Price | $/sf | Match |
|---|---|---|---|---|---|---|---|
| 113 Ember Ridge Ln | 0.02mi | 3/2.0 | 1,498 (0%) | 5mo | $217,910 | $145 | 94 |
| 409 Meadow Ridge Ln | 0.13mi | 3/2.0 | 1,498 (0%) | 2mo | $221,370 | $148 | 92 |
| 401 Meadow Ridge Ln | 0.13mi | 3/2.0 | 1,498 (0%) | 4mo | $220,746 | $147 | 90 |
| 118 Ember Ridge Ln | 0.00mi | 3/2.0 | 1,422 (-5%) | 2mo | $208,187 | $146 | 90 |
| 305 Meadow Ridge Ln | 0.14mi | 3/2.0 | 1,482 (-1%) | 4mo | $217,946 | $147 | 89 |
| 111 Ember Ridge Ln | 0.02mi | 3/2.0 | 1,422 (-5%) | 6mo | $208,040 | $146 | 86 |
| 106 Rosebrook Ln | 0.05mi | 3/2.0 | 1,578 (+5%) | 5mo | $221,610 | $140 | 85 |
| 119 Rosebrook Ln | 0.10mi | 3/2.0 | 1,422 (-5%) | 4mo | $209,339 | $147 | 84 |
| 303 Ravensdale Ln | 0.32mi | 3/2.0 | 1,578 (+5%) | 2mo | $223,102 | $141 | 75 |
| 307 Meadow Ridge Ln | 0.13mi | 3/2.0 | 1,321 (-12%) | 2mo | $199,035 | $151 | 72 |
| 205 Meadow Ridge Ln | 0.16mi | 3/2.0 | 1,321 (-12%) | 1mo | $199,880 | $151 | 72 |
| 500 4th St | 0.42mi | 3/2.0 | 1,296 (-14%) | 3mo | $60,000 | $46 | 56 |
Match score weights: distance 35% · size 25% · config 20% · recency 20%. Top-matched comps best support the ARV.
Projected returns pro-forma
-3.0% appreciation · 3.0% rent growth · sell at horizon
- IRR
- -18.0%
- Equity multiple
- 0.37×
- Total profit
- $-39,060
- Equity at exit
- $32,833
- IRR
- -10.2%
- Equity multiple
- 0.38×
- Total profit
- $-38,226
- Equity at exit
- $19,039
Cash invested: $61,658 (down + closing). Projections, not guarantees.
Landlord ↔ Tenant lean methodology
- Overall (STATE)
- 90 Strongly Landlord-Friendly
- State Louisiana
- 90 Strongly Landlord-Friendly · R+12
- County
- — inherits STATE
- City
- — inherits STATE
ZIP-level market 70529
- Home prices YoY
- -11.1%
- Active inventory
- 196
- Price-to-rent
- 9.7×
Monthly cashflow live
- Estimated rent
- $1,900 medium interval (Pro) →
- Mortgage (P&I)
- −$1,155
- Tax est. 1.5%
- −$275 /mo · $3,303/yr
- Insurance
- −$92
- HOA
- −$33
- Vacancy / Maint / Mgmt
- −$399
- Net cashflow
- $-54
Break-even live
UW: 25.0% down · 7.5% · 30yr · 1.5% tax · 5.0% vac · 8.0% maint · 8.0% mgmt
Financing live
Cash to close
- Down payment
- $55,052
- Closing costs
- $6,606
- Reserves months
- —
- Total cash needed
- —
Loan-product check · same deal, 3 products live
Conventional
25% down · 7.5% · 30yr
- Down + closing
- —
- Monthly P&I
- —
- Monthly cashflow
- —
- DSCR
- —
- Eligible?
- —
Personal DTI + credit; lowest rate.
DSCR
20% down · 8.5% · 30yr
- Down + closing
- —
- Monthly P&I
- —
- Monthly cashflow
- —
- DSCR
- —
- Eligible?
- —
No personal income docs; deal must DSCR.
Hard money
10% down · 12.0% · 12mo
- Down + closing
- —
- Monthly P&I
- —
- Monthly cashflow
- —
- DSCR
- —
- Eligible?
- —
Short-term bridge; refi at stabilization.
Rent comps 1 comps
| Address | Beds | Baths | Sqft | Rent | $/sqft | DOM | Units | Dist |
|---|---|---|---|---|---|---|---|---|
| 211 Winter Park PL Duson, LA | 2.0–3.0 | 2.0 | 1275 | $1,900 | $1.49 | 13d | 1 | 0.33mi |
HOA detail
- Monthly dues
- $33 · $396/yr
- Likely covers
- internetlandscaping
Listing history 1 events
-
2026-05-12$221,795
ⓘ Source: listings_history table (triggers on properties + properties_extension) + one-shot
backfill from property_details.listing_events for pre-trigger history.
Nearby sold comps map
Loading sold comps map…
Walkable amenities ~0.75 mi
Loading nearby amenities…
Taxation est. · year 1
- Rental income
- $22,800
- − Mortgage interest
- −$12,335
- − Property taxes
- −$3,303
- − Insurance
- −$1,101
- − Repairs & maintenance
- −$1,824
- − Management
- −$1,824
- − HOA
- −$396
- − Depreciation
- −$6,406
- Taxable loss
- −$4,389
- Est. tax savings @ 24.0%
- +$1,053
- After-tax cash flow
- $408/yr
For passive investors: Depreciation is non-cash, so a rental often shows a tax loss while cash-flowing — sheltering income. Rental losses are passive: they offset passive income freely, and up to $25,000/yr can offset ordinary (W-2) income if you actively participate and your MAGI is under $100k (phasing out to $0 by $150k); unused losses carry forward. On sale, claimed depreciation is recaptured at up to 25%, and gains may owe capital-gains tax (a 1031 exchange can defer both). Figures are a year-1 estimate at your 24.0% rate — not tax advice; consult a CPA.
Condition & rehab AI · 2 photos
This single-family home is in good condition with a good exterior and landscaping. Painting the exterior and improving the landscaping can significantly increase its value.
Value-add opportunities
- Both Painting exterior brick — Enhances curb appeal and can increase both resale and rental value
- Both Landscaping improvements — Enhances curb appeal and can increase both resale and rental value
Renovation cost estimate screening
Value-add ROI direction
- Both Painting exterior brick — Enhances curb appeal and can increase both resale and rental value ↑
- Both Landscaping improvements — Enhances curb appeal and can increase both resale and rental value ↑
ⓘ Cost ranges are severity-bucket heuristics (US national rule-of-thumb). Get contractor quotes + a written scope before underwriting a rehab budget.
Schools (NCES district)
- District
- Lafayette Parish
- NCES district ID
- 2200870
- Math proficiency
- 38% ▼ -32.00%
- Reading proficiency
- 46% ▼ -24.00%
- Median HH income
- $50,238
- Composite
- 36.15/100
- National rank
- #4741
- State rank
- #19 of 98 in LA
Livability — Duson
- Score
- 66/100
- State rank
- #134
- US rank
- #12322
Category grades
Schools grade is shown separately in the Schools card above.
Census & demographics
- Census place
- Duson, LA
- Population (ZIP)
- 13,557
Population outlook (Lafayette County) Hauer SSP2
- Today (2025)
- 280,930 people
- By 2030
- 301,092 · +7.2%
- By 2040
- 339,456 · +20.8%
- By 2050
- 375,156 · +33.5%
- By 2075
- 451,672 · +60.8%
- By 2100
- 497,203 · +77.0%
Race, ethnicity, and origin ACS 2023
- Neighborhood character
- Diverse neighborhood (Simpson 0.55)
- Race & ethnicity
- White 62% Black 25% Hispanic / Latino 6% Two or more races 6%
- Hispanic origin (detail)
- Common ancestry
- Lithuanian 16% English 1% Iranian 1%
- Foreign-born
- 6% · Canada
- Languages at home
- 90% English-only · Spanish 5% French/Haitian/Cajun 4%
Political lean MEDSL · Lafayette
- 2024 margin
- Solid R (+31.4) · D 33.5% · R 64.8% · Other 1.7%
- 2008→2024 swing
- -0.1pp no change · 2008: -31.3pp · 2024: -31.4pp
- All cycles
- 2024: R+31.4 2020: R+28.7 2016: R+33.6 2012: R+33.7 2008: R+31.3
Not yet ingested
- Civics
- —
Market trends
- HPI YoY
- ▼ -23.96%
- Current HPI
- 192.2639
- Rent YoY
- —
- Metro
- —
- State GDP YoY
- ▲ 3.29%
- F500 in state
- 10
Industry mix (Fortune 500 HQ in LA)
| Industry | F500 HQs | Revenue |
|---|---|---|
| Telecommunications | 2 | $23B |
|
||
| Utilities | 1 | $12B |
|
||
| Wholesale / Distribution | 1 | $5B |
|
||
| Advertising | 1 | $2B |
|
||
Price history
1 event — show timeline
- 2026-05-12 Listed $221,795 AcadianaMLS
Cash-flow waterfall
monthlySold comps — $/sqft
last 12 mo · ≤1 miLoading sold comps…