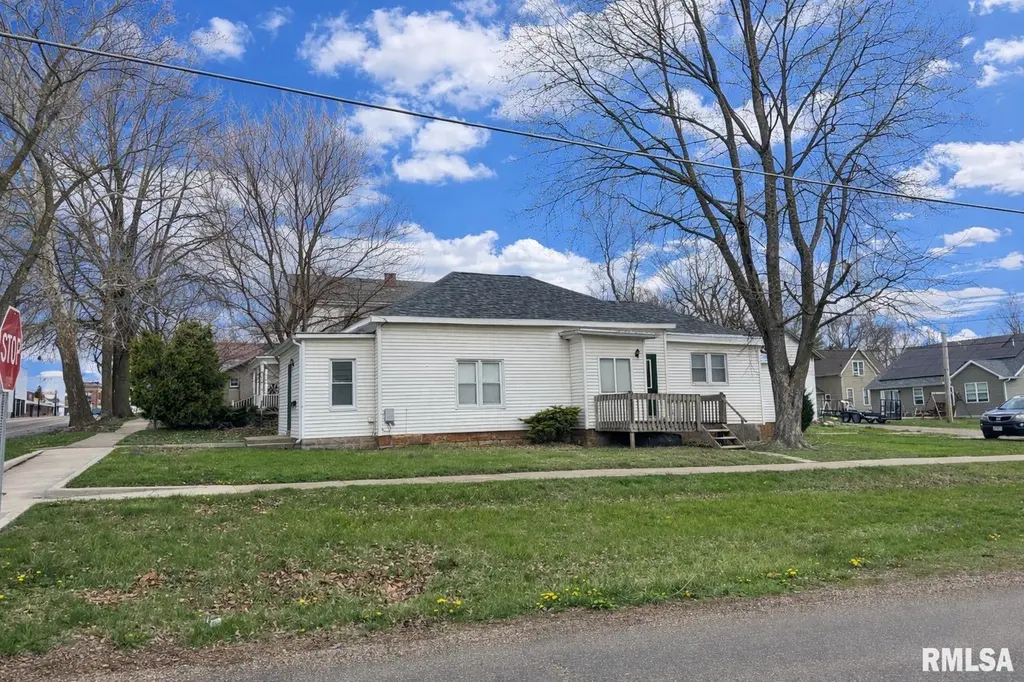
135 E Main St · Mount Sterling, IL
Flood risk 1/10 · Minimal
- FEMA flood zone
- X (unshaded)
- Chance of flooding over 30 yrs
- 0.0%
- Est. flood insurance / yr
- $473 – $860
Fire risk 1/10 · Minimal
- Est. fire insurance / yr
- $804 – $1,492
Heat risk 3/10 · Minor
- Hot days now (above 106°F)
- 7 days/yr
- Hot days in 30 yrs
- 18 days/yr
Wind risk 2/10 · Minimal
- Chance of severe wind over 30 yrs
- 0.0%
Air-quality risk 1/10 · Minimal
- Unhealthy air days now
- 0 days/yr
- Unhealthy air days in 30 yrs
- 0 days/yr
Risk factors via First Street. Map © Google.
Why this score? — see what drove the C grade
The composite is a weighted blend of 9 inputs, each scored 0–100. Each bar is that input's sub-score; the figure is the points it added to the 100-point composite (weight × sub-score).
- Cash flow +19.6/30.0
- Appreciation +10.0/10.0
- ARV discount +7.5/15.0
- DSCR +6.2/10.0
- 1% rule +5.3/10.0
- Livability +3.4/5.0
- Rent growth +2.5/5.0
- Condition / age +2.5/5.0
- Schools +2.3/10.0
$125,000
🖨 Deal sheet 📄 Offer letter ✓ Due diligence
Listing remarks MLS
Excellent investment opportunity with this well maintained duplex ideally located just one block from uptown restaurants, shopping, and everyday conveniences. This property features two separate rental units, including one two bedroom one bath unit and one one bedroom one bath unit, both offering comfortable layouts and practical living spaces. Each unit has remained consistently rented, making this a strong option for investors seeking reliable income potential. The interiors offer spacious rooms, functional kitchens with ample cabinet space, and updated flooring in portions of the home. Natural light fills the living areas, creating welcoming spaces that tenants appreciate. The property’s close proximity to uptown amenities is a major advantage, allowing tenants easy access to dining, shopping, and local services without the need for extended travel. This location continues to support strong rental demand and long term occupancy. Whether you are expanding your portfolio or looking for a solid entry into investment property ownership, this duplex offers dependable rental history, a convenient location, and excellent potential for continued income. Complete expenses unknown and can vary by owner.
Key facts
- Natural light
- Functional kitchens
- Updated flooring
Tags
Neighborhood map
What this means for you Summary
Snapshot
- This is a 6-bed/4.0-bath other listed at $125k.
Deal economics
- At list price, monthly cash flow is $144 ($2k/yr) — positive.
- The deal already cash-flows at list — no discount required.
- Meets the 1% rule at list price ($1k rent vs $125k).
- Recommended offer: $118k (6.0% below list) — sets the bar for market timing.
Location & tenants
- Location reads 67/100 on livability (#521 in IL) — a middle-class / working-renter tenant base. Strengths: cost of living A+, housing A+, crime A; Watch: employment C-, schools D, amenities F.
- Brown County CUSD 1 (town): math 24% / reading 28% proficiency, ranked #306 of 620 in IL (top 49%) — low school quality limits family demand, transient renter base, plan for 1-2y turnover.
- Market conditions: 55 active listings in the ZIP; 1 units permitted in Brown County in 2024 (0 in 5+ unit buildings).
Forward outlook
- In year one you build about $13k of equity ($864 loan paydown + $12k appreciation (10.0% local appreciation)).
- Brown County population projected at +8% by 2050 — modest demand growth; plan on rents tracking national, not racing it.
- At projected returns (10.0% appreciation + 3.0% rent growth), your $35k cash investment doubles in ~3 years — after that, you're playing with house money.
- By year 3, paydown + projected appreciation supports a ~$34k cash-out refi (75% LTV) — recoverable capital for the next deal without selling this one.
Negotiation context
- It's been on market 76 days — a 6% lower offer ($118k) is reasonable based on typical stale-listing flexibility.
- 2 sale attempts since 3y ago with the ask held roughly flat each time — persistent listings suggest the price (not the market) is what's stuck; bring a comps-based counter.
- Current owner paid $100k; 25% above their basis — modest negotiation headroom, anchor on the comps not their cost.
Questions for the listing agent
- It's been on market 76 days. Have you received any prior offers? Is the seller open to a 6% concession, seller financing, or rate buy-down credit?
- Why hasn't it sold? Are there any deal-killer items the seller is aware of (foundation, flood, title, zoning, code violations)?
- Is there a deadline driving the sale (1031 exchange, divorce, estate, relocation)? That informs how much negotiation room exists.
- Schools are D-rated, which usually means shorter tenancies and higher turnover. Who's the typical renter profile here, and what's been the actual vacancy rate?
- What's the average days-on-market for RENTAL listings here right now (not sales)? A rising rental-DOM trend means longer vacancies and softer asking-rent achievability than the comps imply.
- What's the recent tenant-quality profile in this submarket — average credit score on applications, eviction rate, late-payment / NSF rate, and stable-employment percentage? A property-management company in the area should have these aggregated.
- How much new for-sale + rental construction is in the pipeline within 1–3 miles? Heavy new supply typically softens prices + rents 12–24 months out; constrained supply supports both.
Investment metrics
- 1% rule
- 1.03% ✓
- Cap rate
- 7.68%
- Cash-on-cash
- 4.95%
- DSCR
- 1.22
- GRM
- 8.1
CMA / ARV
No comps found within radius.
Projected returns pro-forma
10.0% appreciation · 3.0% rent growth · sell at horizon
- IRR
- 27.9%
- Equity multiple
- 3.21×
- Total profit
- $77,299
- Equity at exit
- $112,610
- IRR
- 24.3%
- Equity multiple
- 7.30×
- Total profit
- $220,449
- Equity at exit
- $242,848
Cash invested: $35,000 (down + closing). Projections, not guarantees.
Landlord ↔ Tenant lean methodology
- Overall (STATE)
- 43 Moderately Tenant-Leaning
- State Illinois
- 43 Moderately Tenant-Leaning · D+7
- County
- — inherits STATE
- City
- — inherits STATE
ZIP-level market 62353
- Home prices YoY
- 8.6%
- Active inventory
- 55
- Price-to-rent
- 8.1×
Monthly cashflow live
- Estimated rent
- $1,286 medium interval (Pro) →
- Mortgage (P&I)
- −$656
- Tax from tax record
- −$164 /mo · $1,972/yr
- Insurance
- −$52
- HOA
- −$0
- Vacancy / Maint / Mgmt
- −$270
- Net cashflow
- $144
Break-even live
UW: 25.0% down · 7.5% · 30yr · 1.5% tax · 5.0% vac · 8.0% maint · 8.0% mgmt
Financing live
Cash to close
- Down payment
- $31,250
- Closing costs
- $3,750
- Reserves months
- —
- Total cash needed
- —
Loan-product check · same deal, 3 products live
Conventional
25% down · 7.5% · 30yr
- Down + closing
- —
- Monthly P&I
- —
- Monthly cashflow
- —
- DSCR
- —
- Eligible?
- —
Personal DTI + credit; lowest rate.
DSCR
20% down · 8.5% · 30yr
- Down + closing
- —
- Monthly P&I
- —
- Monthly cashflow
- —
- DSCR
- —
- Eligible?
- —
No personal income docs; deal must DSCR.
Hard money
10% down · 12.0% · 12mo
- Down + closing
- —
- Monthly P&I
- —
- Monthly cashflow
- —
- DSCR
- —
- Eligible?
- —
Short-term bridge; refi at stabilization.
Listing history 20 events
-
2026-06-18days on market $125,000 Active 76 DOM
-
2026-06-17days on market $125,000 Active 75 DOM
-
2026-06-16days on market $125,000 Active 74 DOM
-
2026-06-15days on market $125,000 Active 73 DOM
-
2026-06-13days on market $125,000 Active 71 DOM
-
2026-06-12days on market $125,000 Active 70 DOM
-
2026-06-09days on market $125,000 Active 67 DOM
-
2026-06-08days on market $125,000 Active 66 DOM
-
2026-06-07days on market $125,000 Active 65 DOM
-
2026-06-07days on market $125,000 Active 64 DOM
-
2026-06-04days on market $125,000 Active 61 DOM
-
2026-06-02days on market $125,000 Active 60 DOM
-
2026-06-01days on market $125,000 Active 59 DOM
-
2026-05-31days on market $125,000 Active 58 DOM
-
2026-05-31days on market $125,000 Active 57 DOM
-
2026-03-27$125,000 Active 1222-char remark
Show marketing remark (1222 chars)
Excellent investment opportunity with this well maintained duplex ideally located just one block from uptown restaurants, shopping, and everyday conveniences. This property features two separate rental units, including one two bedroom one bath unit and one one bedroom one bath unit, both offering comfortable layouts and practical living spaces. Each unit has remained consistently rented, making this a strong option for investors seeking reliable income potential. The interiors offer spacious rooms, functional kitchens with ample cabinet space, and updated flooring in portions of the home. Natural light fills the living areas, creating welcoming spaces that tenants appreciate. The property’s close proximity to uptown amenities is a major advantage, allowing tenants easy access to dining, shopping, and local services without the need for extended travel. This location continues to support strong rental demand and long term occupancy. Whether you are expanding your portfolio or looking for a solid entry into investment property ownership, this duplex offers dependable rental history, a convenient location, and excellent potential for continued income. Complete expenses unknown and can vary by owner.
-
2024-06-04soldstatus $100,000
-
2024-03-26historical
-
2024-01-19price $109,500
-
2023-11-13$125,000 Active
ⓘ Source: listings_history table (triggers on properties + properties_extension) + one-shot
backfill from property_details.listing_events for pre-trigger history.
Tax reassessment forecast IL · Partial reset (capped growth)
- Current annual tax
- $1,972 · $164/mo
- Projected year-2 tax
- $2,405 · $200/mo
- Expected delta
- +$433/yr (+$36/mo · 21.9%)
ⓘ Screening estimate from a state-policy table — verify with the county assessor before closing.
Climate risk First Street
- Flood 1/10 Low FEMA zone X (unshaded) · 0% chance over 30 yrs
- Wildfire 1/10 Low
- Heat 3/10 Moderate 7 d/yr ≥106°F today · 18 d/yr by 30 yrs out
- Wind 2/10 Low 0% chance of damaging wind over 30 yrs
- Air quality 1/10 Low 0 unhealthy d/yr today · 0 by 30 yrs out
Nearby sold comps map
Loading sold comps map…
Walkable amenities ~0.75 mi
Loading nearby amenities…
Taxation est. · year 1
- Rental income
- $15,438
- − Mortgage interest
- −$7,002
- − Property taxes
- −$1,972
- − Insurance
- −$625
- − Repairs & maintenance
- −$1,235
- − Management
- −$1,235
- − Depreciation
- −$3,636
- Taxable loss
- −$268
- Est. tax savings @ 24.0%
- +$64
- After-tax cash flow
- $1,797/yr
For passive investors: Depreciation is non-cash, so a rental often shows a tax loss while cash-flowing — sheltering income. Rental losses are passive: they offset passive income freely, and up to $25,000/yr can offset ordinary (W-2) income if you actively participate and your MAGI is under $100k (phasing out to $0 by $150k); unused losses carry forward. On sale, claimed depreciation is recaptured at up to 25%, and gains may owe capital-gains tax (a 1031 exchange can defer both). Figures are a year-1 estimate at your 24.0% rate — not tax advice; consult a CPA.
Schools (NCES district)
- District
- Brown County CUSD 1
- NCES district ID
- 1727300
- Math proficiency
- 24% ▲ 4.00%
- Reading proficiency
- 28% ▼ -4.00%
- Median HH income
- $46,421
- Composite
- 22.54/100
- National rank
- #8086
- State rank
- #306 of 620 in IL
Livability — Mount Sterling
- Score
- 67/100
- State rank
- #521
- US rank
- #10759
Category grades
Schools grade is shown separately in the Schools card above.
Census & demographics
- Census place
- Mount Sterling, IL
- Population (ZIP)
- 5,012
Population outlook (Brown County) Hauer SSP2
- Today (2025)
- 6,790 people
- By 2030
- 6,900 · +1.6%
- By 2040
- 7,195 · +6.0%
- By 2050
- 7,299 · +7.5%
- By 2075
- 6,469 · -4.7%
- By 2100
- 5,194 · -23.5%
Race, ethnicity, and origin ACS 2023
- Neighborhood character
- Predominantly White (71%)
- Race & ethnicity
- White 71% Black 22% Hispanic / Latino 6% Two or more races 2%
- Hispanic origin (detail)
- Mexican 4% Puerto Rican 1%
- Common ancestry
- Italian 2% Lithuanian 1% Romanian 1%
- Foreign-born
- 2% · Canada
- Languages at home
- 93% English-only · Spanish 6% Other Indo-European 1%
Political lean MEDSL · Brown
- 2024 margin
- Solid R (+59.9) · D 19.0% · R 78.9% · Other 2.0%
- 2008→2024 swing
- -38.2pp toward R · 2008: -21.7pp · 2024: -59.9pp
- All cycles
- 2024: R+59.9 2020: R+57.2 2016: R+55.7 2012: R+30.6 2008: R+21.7
Not yet ingested
- Civics
- —
Market trends
- HPI YoY
- ▲ 13.18%
- Current HPI
- 166.29
- Rent YoY
- —
- Metro
- —
- State GDP YoY
- ▲ 1.59%
- F500 in state
- 60
Industry mix (Fortune 500 HQ in IL)
| Industry | F500 HQs | Revenue |
|---|---|---|
| Insurance | 4 | $201B |
|
||
| Consumer Goods | 4 | $87B |
|
||
| Industrial Machinery | 3 | $64B |
|
||
| Healthcare | 2 | $55B |
|
||
| Retail / Pharmacy | 1 | $148B |
|
||
| Agriculture / Food | 1 | $86B |
|
||
Price history
+0.0% since first listed5 events — show timeline
- 2026-03-27 Listed $125,000 RMLSA as Distributed by MLS Grid
- 2024-06-04 Sold (Public Records) $100,000 Public Records
- 2024-03-26 Listing Removed — MRED as Distributed by MLS Grid
- 2024-01-19 Price Changed $109,500 Quincy AOR
- 2023-11-13 Listed $125,000 Quincy AOR
Property tax history
+2.5%/yrLatest (2024): $1,972 · +3.1% YoY. Source: county tax records.
Cash-flow waterfall
monthlySold comps — $/sqft
last 12 mo · ≤1 miLoading sold comps…