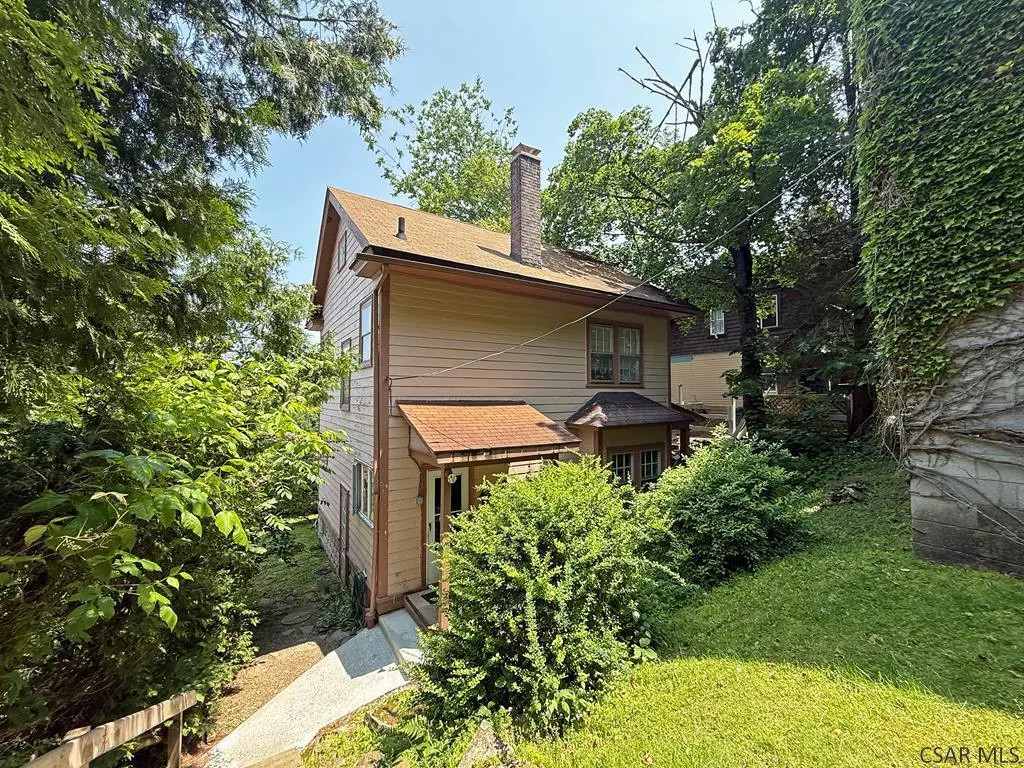
1492 Franklin St · Johnstown, PA
Flood risk 1/10 · Minimal
- FEMA flood zone
- X (unshaded)
- Chance of flooding over 30 yrs
- 0.0%
- Est. flood insurance / yr
- $473 – $860
Fire risk 1/10 · Minimal
- Est. fire insurance / yr
- $511 – $949
Heat risk 3/10 · Minor
- Hot days now (above 93°F)
- 7 days/yr
- Hot days in 30 yrs
- 16 days/yr
Wind risk 2/10 · Minimal
- Chance of severe wind over 30 yrs
- —
Air-quality risk 2/10 · Minimal
- Unhealthy air days now
- 1 days/yr
- Unhealthy air days in 30 yrs
- 2 days/yr
Risk factors via First Street. Map © Google.
Why this score? — see what drove the B+ grade
The composite is a weighted blend of 9 inputs, each scored 0–100. Each bar is that input's sub-score; the figure is the points it added to the 100-point composite (weight × sub-score).
- Cash flow +30.0/30.0
- ARV discount +15.0/15.0
- 1% rule +10.0/10.0
- DSCR +10.0/10.0
- Livability +3.9/5.0
- Rent growth +2.5/5.0
- Condition / age +2.5/5.0
- Schools +1.3/10.0
- Appreciation +0.0/10.0
$54,900
🖨 Deal sheet 📄 Offer letter ✓ Due diligence
Listing remarks
Don't miss your chance to tour this 3 Bedroom, 1 Bathroom two story home in the City of Johnstown - 8th Ward. The first floor has a spacious Living Room with fireplace, Kitchen with appliances included and a separate Dining Room with built-in storage cabinets. There are three Bedrooms and a Bathroom with tub/shower and a dual vanity on the second floor. Laundry area in the basement with washer & dryer included. Detached two car garage. Sewer compliant. Call today!!
Key facts
- Sewer compliant
- 5,663 sq ft lot
- 2 garage spots
Tags
Property features AI
Exterior
- Parking: Detached 2-car garage
- Utilities: Public water; Public sewer; Sewer available
- Home design: Single-family residence; Two-story home
- Construction: Wood siding; Shingle roof; Built with traditional foundation (basement present)
- Exterior features: Rectangular lot; No pool
Interior
- Kitchen: Range; Oven; Refrigerator; Dishwasher (not listed separately — appliances include range/oven/refrigerator)
- Bathrooms: 1 full bathroom
- Heating & cooling: Hot water heating (natural gas); Window cooling units
- Interior features: Wood-burning fireplace (1); Full, unfinished basement
- Laundry & utility: Washer; Dryer; Laundry located in the basement
Neighborhood map
What this means for you Summary
Snapshot
- This is a 3-bed/1.0-bath single-family listed at $55k.
Deal economics
- At list price, monthly cash flow is $330 ($4k/yr) — positive.
- The deal already cash-flows at list — no discount required.
- Meets the 1% rule at list price ($978 rent vs $55k).
Location & tenants
- Location reads 77/100 on livability (#363 in PA, #3,168 nationally) — a middle-class / working-renter tenant base. Strengths: amenities A+, commute A+, cost of living A+; Watch: schools D+, crime F, employment F.
- Greater Johnstown SD (urban): math 9% / reading 25% proficiency, ranked #509 of 539 in PA (top 94%) — low school quality limits family demand, transient renter base, plan for 1-2y turnover; 80% free/reduced lunch — lower-income household profile, screen leases tightly.
- Market conditions: 92 active listings in the ZIP; 6 comparable units currently listed for rent nearby; rentals lingering (median 44d on market — plan ~5-8 weeks vacancy on turnover, expect pricing pressure); 83% of comp listings sitting > 30 days — soft ceiling on asking rent; 64 units permitted in Cambria County in 2024 (0 in 5+ unit buildings).
- This rent is only 17% of the median local income ($69k/yr) — well below the 30% rent-burden line; pricing power to push rent on renewal without tenant pushback.
Forward outlook
- Local home prices are declining (-3.0%/yr); year-one equity from $380 of loan paydown is wiped out by about $2k of value loss. Plan a longer hold.
- Cambria County population projected at -28% by 2050 — secular population decline; favor cash flow + early exit over multi-decade hold.
- At projected returns (-3.0% appreciation + 3.0% rent growth), your $15k cash investment doubles in ~5 years — after that, you're playing with house money.
Negotiation context
- Only 6 days on market — expect competitive offers; lowballing is unlikely to land.
- 3 sale attempts with the ask held roughly flat each time — persistent listings suggest the price (not the market) is what's stuck; bring a comps-based counter.
- Current owner paid $47k; 17% above their basis — modest negotiation headroom, anchor on the comps not their cost.
Risks & watch-outs
- Watch-outs: property tax is 2.9% of price; built in 1916 — expect roof / HVAC / electrical / plumbing capex.
Questions for the listing agent
- Built in 1916 — when were the roof, HVAC, electrical panel, plumbing, and water heater last replaced?
- Property tax is high relative to price — has the assessment been appealed recently, and will the sale trigger a re-assessment?
- Is there a deadline driving the sale (1031 exchange, divorce, estate, relocation)? That informs how much negotiation room exists.
- Schools are D-rated, which usually means shorter tenancies and higher turnover. Who's the typical renter profile here, and what's been the actual vacancy rate?
- Crime grade is F in this area — have there been break-ins, vandalism, or insurance claims at this property in the last 3 years? What carrier currently insures it and at what premium?
- What's the average days-on-market for RENTAL listings here right now (not sales)? A rising rental-DOM trend means longer vacancies and softer asking-rent achievability than the comps imply.
- What's the recent tenant-quality profile in this submarket — average credit score on applications, eviction rate, late-payment / NSF rate, and stable-employment percentage? A property-management company in the area should have these aggregated.
- How much new for-sale + rental construction is in the pipeline within 1–3 miles? Heavy new supply typically softens prices + rents 12–24 months out; constrained supply supports both.
Investment metrics
- 1% rule
- 1.78% ✓
- Cap rate
- 13.51%
- Cash-on-cash
- 25.78%
- DSCR
- 2.15
- GRM
- 4.7
CMA / ARV
- ARV (median comp)
- $72,249
- List price
- $54,900
- Delta
- -24.01%
- Verdict
- UNDERPRICED
- Comps
- 20 within 1.0 mi
Show comp detail 12 sales within ~0.75 mi
| Address | Dist | Beds/Ba | Sqft | Sold | Price | $/sf | Match |
|---|---|---|---|---|---|---|---|
| 1492 Franklin St | 0.00mi | 3/1.0 | 1,248 (0%) | 1mo | $47,000 | $38 | 100 |
| 394 Plainfield Ave | 0.24mi | 2/1.0 (-1) | 1,150 (-8%) | 2mo | $27,900 | $24 | 69 |
| 545 Summit Ave | 0.48mi | 3/1.0 | 1,187 (-5%) | 3mo | $89,000 | $75 | 67 |
| 707 Tammie Ct | 0.65mi | 3/1.0 | 1,282 (+3%) | 7mo | $48,000 | $37 | 59 |
| 627 Vickroy Ave | 0.51mi | 2/1.5 (-1) | 1,188 (-5%) | 3mo | $125,000 | $105 | 59 |
| 100 Donna Dr | 0.50mi | 4/2.0 (+1) | 1,312 (+5%) | 1mo | $115,000 | $88 | 58 |
| 182 Watson St | 0.38mi | 2/1.5 (-1) | 1,337 (+7%) | 7mo | $114,000 | $85 | 58 |
| 751 Park Ave | 0.46mi | 3/1.5 | 1,388 (+11%) | 3mo | $43,500 | $31 | 55 |
| 1138 Shaffer St | 0.51mi | 3/2.0 | 1,358 (+9%) | 6mo | $113,000 | $83 | 52 |
| 800 Highland Ave | 0.63mi | 4/1.0 (+1) | 1,320 (+6%) | 7mo | $45,000 | $34 | 50 |
| 714 Glenwood Ave | 0.62mi | 3/1.5 | 1,432 (+15%) | 1mo | $113,420 | $79 | 44 |
| 217 Bond St | 0.66mi | 3/2.0 | 1,391 (+12%) | 6mo | $63,500 | $46 | 41 |
Match score weights: distance 35% · size 25% · config 20% · recency 20%. Top-matched comps best support the ARV.
Projected returns pro-forma
-3.0% appreciation · 3.0% rent growth · sell at horizon
- IRR
- 19.5%
- Equity multiple
- 1.79×
- Total profit
- $12,195
- Equity at exit
- $8,186
- IRR
- 27.8%
- Equity multiple
- 3.47×
- Total profit
- $37,925
- Equity at exit
- $4,747
Cash invested: $15,372 (down + closing). Projections, not guarantees.
Landlord ↔ Tenant lean methodology
- Overall (STATE)
- 62 Landlord-Friendly
- State Pennsylvania
- 62 Landlord-Friendly · EVEN
- County
- — inherits STATE
- City
- — inherits STATE
ZIP-level market 15905
- Home prices YoY
- -31.1%
- Active inventory
- 92
- Price-to-rent
- 4.7×
Monthly cashflow live
- Estimated rent
- $978 high interval (Pro) →
- Mortgage (P&I)
- −$288
- Tax from tax record
- −$132 /mo · $1,579/yr
- Insurance
- −$23
- HOA
- −$0
- Vacancy / Maint / Mgmt
- −$205
- Net cashflow
- $330
Break-even live
UW: 25.0% down · 7.5% · 30yr · 1.5% tax · 5.0% vac · 8.0% maint · 8.0% mgmt
Financing live
Cash to close
- Down payment
- $13,725
- Closing costs
- $1,647
- Reserves months
- —
- Total cash needed
- —
Loan-product check · same deal, 3 products live
Conventional
25% down · 7.5% · 30yr
- Down + closing
- —
- Monthly P&I
- —
- Monthly cashflow
- —
- DSCR
- —
- Eligible?
- —
Personal DTI + credit; lowest rate.
DSCR
20% down · 8.5% · 30yr
- Down + closing
- —
- Monthly P&I
- —
- Monthly cashflow
- —
- DSCR
- —
- Eligible?
- —
No personal income docs; deal must DSCR.
Hard money
10% down · 12.0% · 12mo
- Down + closing
- —
- Monthly P&I
- —
- Monthly cashflow
- —
- DSCR
- —
- Eligible?
- —
Short-term bridge; refi at stabilization.
Rent comps 6 comps
| Address | Beds | Baths | Sqft | Rent | $/sqft | DOM | Units | Dist |
|---|---|---|---|---|---|---|---|---|
| 129-131 Plainfield Ave Johnstown, PA | 3.0 | 1.0 | 1300 | $850 | $0.65 | 43d | 1 | 0.15mi |
| 522 Vickroy Ave Johnstown, PA | 3.0 | 1.0 | 1125 | $850 | $0.76 | 43d | 1 | 0.38mi |
| 550 Ferndale Ave Johnstown, PA | 3.0 | 1.0 | 1300 | $1,100 | $0.85 | 43d | 1 | 0.42mi |
| 553 Vickroy Ave #555 Johnstown, PA | 3.0 | 1.0 | 1300 | $985 | $0.76 | 43d | 1 | 0.43mi |
| 619 Grove Ave Johnstown, PA | 2.0 | 2.0 | 1100 | $1,050 | $0.95 | 43d | 1 | 0.64mi |
| 1201 Heeney Ave Johnstown, PA | 1.0–3.0 | 1.0 | 750 | $1,050 | $1.40 | 4d | 1 | 1.05mi |
Listing history 7 events
-
2026-05-05status Pending 475-char remark
-
2026-05-04historical Active Under Contract 475-char remark
-
2026-05-01status Active 475-char remark
-
2026-04-30status Pending 475-char remark
-
2026-04-29$54,900 Active 475-char remark
-
2025-06-05$54,900 Active
-
1978-06-01soldstatus $28,500
ⓘ Source: listings_history table (triggers on properties + properties_extension) + one-shot
backfill from property_details.listing_events for pre-trigger history.
Tax reassessment forecast PA · Partial reset (capped growth)
- Current annual tax
- $1,579 · $132/mo
- Projected year-2 tax
- $1,579 · $132/mo
- Expected delta
- $0/yr ($0/mo · 0.0%)
ⓘ Screening estimate from a state-policy table — verify with the county assessor before closing.
Climate risk First Street
- Flood 1/10 Low FEMA zone X (unshaded) · 0% chance over 30 yrs
- Wildfire 1/10 Low
- Heat 3/10 Moderate 7 d/yr ≥93°F today · 16 d/yr by 30 yrs out
- Wind 2/10 Low
- Air quality 2/10 Low 1 unhealthy d/yr today · 2 by 30 yrs out
Nearby sold comps map
Loading sold comps map…
Walkable amenities ~0.75 mi
Loading nearby amenities…
Taxation est. · year 1
- Rental income
- $11,737
- − Mortgage interest
- −$3,075
- − Property taxes
- −$1,579
- − Insurance
- −$274
- − Repairs & maintenance
- −$939
- − Management
- −$939
- − Depreciation
- −$1,597
- Taxable income
- $3,333
- Est. tax owed @ 24.0%
- −$800
- After-tax cash flow
- $3,164/yr
For passive investors: Depreciation is non-cash, so a rental often shows a tax loss while cash-flowing — sheltering income. Rental losses are passive: they offset passive income freely, and up to $25,000/yr can offset ordinary (W-2) income if you actively participate and your MAGI is under $100k (phasing out to $0 by $150k); unused losses carry forward. On sale, claimed depreciation is recaptured at up to 25%, and gains may owe capital-gains tax (a 1031 exchange can defer both). Figures are a year-1 estimate at your 24.0% rate — not tax advice; consult a CPA.
Schools (NCES district)
- District
- Greater Johnstown SD
- NCES district ID
- 4210950
- Math proficiency
- 9% ▼ -6.00%
- Reading proficiency
- 25% ▼ -6.00%
- Median HH income
- $27,890
- Composite
- 13.25/100
- National rank
- #9550
- State rank
- #509 of 539 in PA
Livability — Johnstown
- Score
- 77/100
- State rank
- #363
- US rank
- #3168
Category grades
Schools grade is shown separately in the Schools card above.
Census & demographics
- Census place
- Johnstown, PA
- County
- Cambria County · 30,791 people
- City population
- 30,791
- Metro
- Johnstown, PA
- Population (ZIP)
- 19,329
- Household income
- $69,212
- Rent vs Own
- Severe rent burden
- 359.0
Population outlook (Cambria County) Hauer SSP2
- Today (2025)
- 122,754 people
- By 2030
- 115,827 · -5.6%
- By 2040
- 101,309 · -17.5%
- By 2050
- 88,379 · -28.0%
- By 2075
- 65,237 · -46.9%
- By 2100
- 46,909 · -61.8%
Race, ethnicity, and origin ACS 2023
- Neighborhood character
- Predominantly White (92%)
- Race & ethnicity
- White 92% Two or more races 3% Hispanic / Latino 2% Black 2%
- Common ancestry
- Romanian 7% Scotch-Irish 1% Italian 1%
- Foreign-born
- 2% · Canada
- Languages at home
- 96% English-only · Spanish 1%
Political lean MEDSL · Cambria
- 2024 margin
- Solid R (+39.7) · D 29.8% · R 69.5%
- 2008→2024 swing
- -40.4pp toward R · 2008: 0.7pp · 2024: -39.7pp
- All cycles
- 2024: R+39.7 2020: R+37.3 2016: R+37.8 2012: R+17.8 2008: D+0.7
Not yet ingested
- Civics
- —
Market trends
- HPI YoY
- ▼ -64.18%
- Current HPI
- 142.5218
- Rent YoY
- —
- Metro
- Johnstown, PA
- State GDP YoY
- ▲ 1.68%
- F500 in state
- 34
Industry mix (Fortune 500 HQ in PA)
| Industry | F500 HQs | Revenue |
|---|---|---|
| Healthcare | 2 | $309B |
|
||
| Insurance | 2 | $27B |
|
||
| Telecommunications / Media | 1 | $124B |
|
||
| Industrial Distribution | 1 | $22B |
|
||
| Financial Services | 1 | $20B |
|
||
| Chemicals / Materials | 1 | $18B |
|
||
Price history
+64.9% since first listed8 events — show timeline
- 2026-06-02 Sold (MLS) $47,000 CSMLS
- 2026-05-05 Pending — CSMLS
- 2026-05-04 Contingent — CSMLS
- 2026-05-01 Relisted — CSMLS
- 2026-04-30 Pending — CSMLS
- 2026-04-29 Listed $54,900 CSMLS
- 2025-06-05 Listed $54,900 CSMLS
- 1978-06-01 Sold (Public Records) $28,500 Public Records
Property tax history
+0.2%/yrLatest (2026): $1,579 · +0.0% YoY. Source: county tax records.
Cash-flow waterfall
monthlySold comps — $/sqft
last 12 mo · ≤1 miLoading sold comps…