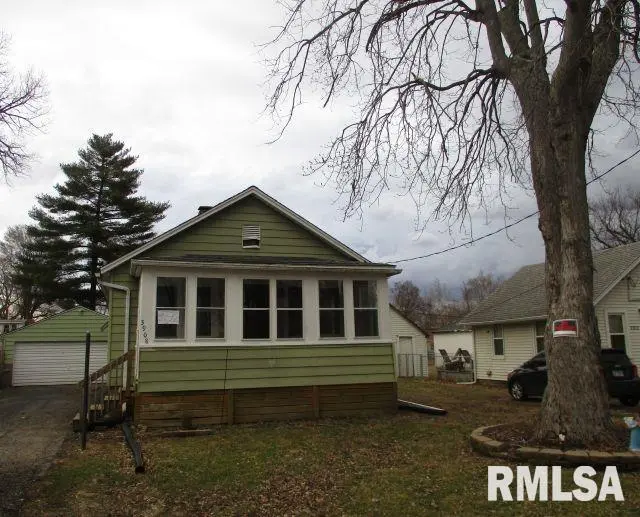
3908 S Lauder Ave · Bartonville, IL
Flood risk 1/10 · Minimal
- FEMA flood zone
- X
- Chance of flooding over 30 yrs
- 0.0%
- Est. flood insurance / yr
- $473 – $860
Fire risk 1/10 · Minimal
- Est. fire insurance / yr
- $804 – $1,492
Heat risk 3/10 · Minor
- Hot days now (above 105°F)
- 7 days/yr
- Hot days in 30 yrs
- 18 days/yr
Wind risk 2/10 · Minimal
- Chance of severe wind over 30 yrs
- 1.0%
Air-quality risk 2/10 · Minimal
- Unhealthy air days now
- 1 days/yr
- Unhealthy air days in 30 yrs
- 3 days/yr
Risk factors via First Street. Map © Google.
Why this score? — see what drove the B- grade
The composite is a weighted blend of 9 inputs, each scored 0–100. Each bar is that input's sub-score; the figure is the points it added to the 100-point composite (weight × sub-score).
- Cash flow +25.3/30.0
- ARV discount +15.0/15.0
- DSCR +8.3/10.0
- 1% rule +7.9/10.0
- Livability +3.1/5.0
- Schools +2.9/10.0
- Rent growth +2.5/5.0
- Condition / age +2.5/5.0
- Appreciation +0.0/10.0
$75,500
🖨 Deal sheet (PDF) 📄 Offer letter ✓ Due diligence
Listing remarks MLS
Nothing left to do but move in! This ranch style home in Bartonville has so much to offer including: 2 bedrooms plus den that could be potential 3rd bedroom or dining room, 1 full bath, detached 2 stall detached garage, fully fenced deep lot, enclosed front porch, and so much more! Almost this entire home has been updated with: newer windows, kitchen gut + remodel in 2017, bath gut + remodel in 2017, new roof on house and garage in 2017, new furnace in 2017, hardwood in 2016, new carpet and exterior doors in 2019, reverse osmosis water filtration system in 2018, updated electrical in 2019, and so much more! All kitchen appliances plus washer, dryer, shed, blinds, + utility bench in basement stay! Home already has a radon system! Basement has daylight windows. This home is a must see! Short notice showings welcome.
Key facts
- Partial basement
- Huge back yard
- Open kitchen
Tags
Property features AI
Finance
- Other: Subdivision: Broadmore Heights; Directions: Garfield to Lauder; Status: Active
Exterior
- Parking: Detached 2-car garage
- Utilities: Public water; Public sewer
- Home design: Single-family residence; Built in 1938; 880 building area total
- Construction: Shingle roof
- Exterior features: Level lot
Interior
- Kitchen: Kitchen on main level
- Bedrooms: 2 bedrooms (both on the main level)
- Flooring: Vinyl flooring in living, dining and kitchen; Other flooring in bedrooms
- Bathrooms: 1 full bathroom
- Heating & cooling: Central air
- Interior features: Cable available; Crawl space and partial unfinished basement
Neighborhood map
What this means for you Summary
Snapshot
- This is a 2-bed/1.0-bath single-family listed at $76k.
Deal economics
- At list price, monthly cash flow is $172 ($2k/yr) — positive.
- The deal already cash-flows at list — no discount required.
- Meets the 1% rule at list price ($975 rent vs $76k).
- Recommended offer: $73k (3.0% below list) — sets the bar for market timing.
- Cap rate 9.0% vs local median 3.6% in Bartonville — top-decile yield for the area; either an underpriced asset or a hidden risk that comps aren't pricing in. Stress-test before assuming the spread holds.
Location & tenants
- Location reads 62/100 on livability (#840 in IL) — a middle-class / working-renter tenant base. Strengths: cost of living A+, housing A+; Watch: crime D+, amenities F, commute F.
- Limestone Chsd 310 (rural): math 25% / reading 35% proficiency, ranked #486 of 919 in IL (top 53%) — families likely to look elsewhere, expect single-tenant / working-renter base with shorter leases.
- Zoned schools: Limestone Community High School (math 17% / reading 22%, grade F, #397 of 693 statewide, top 61%, 924 students, 0% FRL).
- Market conditions: 51 active listings in the ZIP; 1 comparable units currently listed for rent nearby; 73 units permitted in Peoria County in 2024 (0 in 5+ unit buildings).
Forward outlook
- Local home prices are declining (-3.0%/yr); year-one equity from $522 of loan paydown is wiped out by about $2k of value loss. Plan a longer hold.
- Peoria County population projected at -11% by 2050 — secular population decline; favor cash flow + early exit over multi-decade hold.
Negotiation context
- It's been on market 57 days — a 3% lower offer ($73k) is reasonable based on typical stale-listing flexibility.
- 3 sale attempts since 16y ago; this cycle's ask has dropped $14k (15%) from the opening price — seller is motivated, your offer sets the floor, not the list.
Risks & watch-outs
- Watch-outs: property tax is 2.7% of price; built in 1938 — expect roof / HVAC / electrical / plumbing capex.
Questions for the listing agent
- It's been on market 57 days. Have you received any prior offers? Is the seller open to a 3% concession, seller financing, or rate buy-down credit?
- Built in 1938 — when were the roof, HVAC, electrical panel, plumbing, and water heater last replaced?
- Property tax is high relative to price — has the assessment been appealed recently, and will the sale trigger a re-assessment?
- Is there a deadline driving the sale (1031 exchange, divorce, estate, relocation)? That informs how much negotiation room exists.
- Schools are D-rated, which usually means shorter tenancies and higher turnover. Who's the typical renter profile here, and what's been the actual vacancy rate?
- Crime grade is D in this area — have there been break-ins, vandalism, or insurance claims at this property in the last 3 years? What carrier currently insures it and at what premium?
- What's the average days-on-market for RENTAL listings here right now (not sales)? A rising rental-DOM trend means longer vacancies and softer asking-rent achievability than the comps imply.
- What's the recent tenant-quality profile in this submarket — average credit score on applications, eviction rate, late-payment / NSF rate, and stable-employment percentage? A property-management company in the area should have these aggregated.
- How much new for-sale + rental construction is in the pipeline within 1–3 miles? Heavy new supply typically softens prices + rents 12–24 months out; constrained supply supports both.
Investment metrics
- 1% rule
- 1.29% ✓
- Cap rate
- 9.02%
- Cash-on-cash
- 9.75%
- DSCR
- 1.43
- GRM
- 6.5
CMA / ARV
- ARV (on-the-fly)
- $104,720
- Comps found
- 12
Show comp detail 12 sales within ~0.75 mi
| Address | Dist | Beds/Ba | Sqft | Sold | Price | $/sf | Match |
|---|---|---|---|---|---|---|---|
| 3814 S Lauder Ave | 0.07mi | 2/1.0 | 900 (+2%) | 5mo | $55,000 | $61 | 88 |
| 4015 Lafayette Ave | 0.19mi | 2/1.0 | 912 (+4%) | 8mo | $83,000 | $91 | 78 |
| 4119 S Fairview Dr | 0.39mi | 2/1.0 | 832 (-6%) | 1mo | $105,000 | $126 | 72 |
| 3810 S Chalmers Ave | 0.15mi | 3/1.5 (+1) | 942 (+7%) | 4mo | $105,000 | $111 | 71 |
| 4030 S Granville Ave | 0.17mi | 3/1.0 (+1) | 957 (+9%) | 6mo | $137,000 | $143 | 67 |
| 27 Gulf Stream Ave | 0.35mi | 3/1.0 (+1) | 925 (+5%) | 4mo | $125,000 | $135 | 67 |
| 4005 Chalmers Ave | 0.13mi | 3/1.0 (+1) | 988 (+12%) | 9mo | $117,500 | $119 | 61 |
| 16 Hialeah Dr | 0.42mi | 3/1.0 (+1) | 925 (+5%) | 9mo | $125,000 | $135 | 59 |
| 4609 W Whipp Ave | 0.36mi | 3/1.0 (+1) | 943 (+7%) | 9mo | $85,000 | $90 | 59 |
| 4204 SE Scholl Ct | 0.27mi | 1/1.0 (-1) | 952 (+8%) | 12mo | $50,000 | $53 | 58 |
| 1 New Salem Rd | 0.43mi | 3/1.0 (+1) | 988 (+12%) | 3mo | $116,000 | $117 | 52 |
| 4522 W Correll Ct | 0.66mi | 2/2.0 | 1,008 (+14%) | 9mo | $172,000 | $171 | 33 |
Match score weights: distance 35% · size 25% · config 20% · recency 20%. Top-matched comps best support the ARV.
Projected returns pro-forma
-3.0% appreciation · 3.0% rent growth · sell at horizon
- IRR
- -1.5%
- Equity multiple
- 0.94×
- Total profit
- $-1,232
- Equity at exit
- $11,257
- IRR
- 8.2%
- Equity multiple
- 1.63×
- Total profit
- $13,266
- Equity at exit
- $6,528
Cash invested: $21,140 (down + closing). Projections, not guarantees.
Landlord ↔ Tenant lean methodology
- Overall (STATE)
- 43 Moderately Tenant-Leaning
- State Illinois
- 43 Moderately Tenant-Leaning · D+7
- County
- — inherits STATE
- City
- — inherits STATE
ZIP-level market 61607
- Home prices YoY
- -27.1%
- Active inventory
- 51
- Price-to-rent
- 6.5×
Monthly cashflow live
- Estimated rent
- $975 medium interval (Pro) →
- Mortgage (P&I)
- −$396
- Tax from tax record
- −$171 /mo · $2,053/yr
- Insurance
- −$31
- HOA
- −$0
- Vacancy / Maint / Mgmt
- −$205
- Net cashflow
- $172
Break-even live
Sensitivity live
| Price | -10% $215 | -5% $193 | +0% $172 | +5% $150 | +10% $129 |
|---|---|---|---|---|---|
| Rent | -10% $95 | -5% $133 | +0% $172 | +5% $210 | +10% $249 |
| Rate | -1.0pp $210 | -0.5pp $191 | base $172 | +0.5pp $152 | +1.0pp $132 |
UW: 25.0% down · 7.5% · 30yr · 1.5% tax · 5.0% vac · 8.0% maint · 8.0% mgmt
Financing live
Cash to close
- Down payment
- $18,875
- Closing costs
- $2,265
- Reserves months
- —
- Total cash needed
- —
Loan-product check · same deal, 3 products live
Conventional
25% down · 7.5% · 30yr
- Down + closing
- —
- Monthly P&I
- —
- Monthly cashflow
- —
- DSCR
- —
- Eligible?
- —
Personal DTI + credit; lowest rate.
DSCR
20% down · 8.5% · 30yr
- Down + closing
- —
- Monthly P&I
- —
- Monthly cashflow
- —
- DSCR
- —
- Eligible?
- —
No personal income docs; deal must DSCR.
Hard money
10% down · 12.0% · 12mo
- Down + closing
- —
- Monthly P&I
- —
- Monthly cashflow
- —
- DSCR
- —
- Eligible?
- —
Short-term bridge; refi at stabilization.
Rent comps 1 comps
| Address | Beds | Baths | Sqft | Rent | $/sqft | DOM | Units | Dist |
|---|---|---|---|---|---|---|---|---|
| 5817 S Adams St Bartonville, IL | 2.0 | 1.0 | 768 | $975 | $1.27 | 14d | 1 | 1.32mi |
Listing history 11 events
-
2026-05-14status Pending
-
2026-04-23price $75,500
-
2026-03-18$89,000 Active
-
2019-12-09soldstatus $79,000
-
2019-12-06soldstatus $79,000 834-char remark
Show marketing remark (834 chars)
Nothing left to do but move in! This ranch style home in Bartonville has so much to offer including: 2 bedrooms plus den that could be potential 3rd bedroom or dining room, 1 full bath, detached 2 stall detached garage, fully fenced deep lot, enclosed front porch, and so much more! Almost this entire home has been updated with: newer windows, kitchen gut + remodel in 2017, bath gut + remodel in 2017, new roof on house and garage in 2017, new furnace in 2017, hardwood in 2016, new carpet and exterior doors in 2019, reverse osmosis water filtration system in 2018, updated electrical in 2019, and so much more! All kitchen appliances plus washer, dryer, shed, blinds, + utility bench in basement stay! Home already has a radon system! Basement has daylight windows. This home is a must see! Short notice showings welcome.
-
2019-09-19$79,900 834-char remark
Show marketing remark (834 chars)
Nothing left to do but move in! This ranch style home in Bartonville has so much to offer including: 2 bedrooms plus den that could be potential 3rd bedroom or dining room, 1 full bath, detached 2 stall detached garage, fully fenced deep lot, enclosed front porch, and so much more! Almost this entire home has been updated with: newer windows, kitchen gut + remodel in 2017, bath gut + remodel in 2017, new roof on house and garage in 2017, new furnace in 2017, hardwood in 2016, new carpet and exterior doors in 2019, reverse osmosis water filtration system in 2018, updated electrical in 2019, and so much more! All kitchen appliances plus washer, dryer, shed, blinds, + utility bench in basement stay! Home already has a radon system! Basement has daylight windows. This home is a must see! Short notice showings welcome.
-
2010-05-26soldstatus $75,000
-
2010-05-25soldstatus $75,000 392-char remark
Show marketing remark (392 chars)
NICE 2-3 BR RANCH HOME WITH MANY UPDATES INCLUDING ALL NEW WINDOWS, NEW GARAGE ROOF, NEWER KITCHEN FLOORING, A/C-'08, SOME NEW GUTTERS & SOME FRESH PAINT * LARGE 2 CAR GARAGE, PULL DOWN ATTIC STAIRS, COZY ENCLOSED FRONT PORCH & A PARTIALLY FINISHED BASMENT * OAK GROVE SCHOOLS & CONVENIENT LOCATION * ALL SIZES & DIMENSIONS APPROX. ASK ABOUT RURAL DEVOPMENT 100 % FINANCIING!
-
2010-01-13$79,900 392-char remark
Show marketing remark (392 chars)
NICE 2-3 BR RANCH HOME WITH MANY UPDATES INCLUDING ALL NEW WINDOWS, NEW GARAGE ROOF, NEWER KITCHEN FLOORING, A/C-'08, SOME NEW GUTTERS & SOME FRESH PAINT * LARGE 2 CAR GARAGE, PULL DOWN ATTIC STAIRS, COZY ENCLOSED FRONT PORCH & A PARTIALLY FINISHED BASMENT * OAK GROVE SCHOOLS & CONVENIENT LOCATION * ALL SIZES & DIMENSIONS APPROX. ASK ABOUT RURAL DEVOPMENT 100 % FINANCIING!
-
1998-02-27soldstatus $53,000
-
1998-02-27soldstatus $53,000
ⓘ Source: listings_history table (triggers on properties + properties_extension) + one-shot
backfill from property_details.listing_events for pre-trigger history.
Tax reassessment forecast IL · Partial reset (capped growth)
- Current annual tax
- $2,053 · $171/mo
- Projected year-2 tax
- $2,053 · $171/mo
- Expected delta
- $0/yr ($0/mo · 0.0%)
ⓘ Screening estimate from a state-policy table — verify with the county assessor before closing.
Climate risk First Street
- Flood 1/10 Low FEMA zone X · 0% chance over 30 yrs
- Wildfire 1/10 Low
- Heat 3/10 Moderate 7 d/yr ≥105°F today · 18 d/yr by 30 yrs out
- Wind 2/10 Low 100% chance of damaging wind over 30 yrs
- Air quality 2/10 Low 1 unhealthy d/yr today · 3 by 30 yrs out
Nearby sold comps map
Loading sold comps map…
Walkable amenities ~0.75 mi
Loading nearby amenities…
Taxation est. · year 1
- Rental income
- $11,700
- − Mortgage interest
- −$4,229
- − Property taxes
- −$2,053
- − Insurance
- −$378
- − Repairs & maintenance
- −$936
- − Management
- −$936
- − Depreciation
- −$2,196
- Taxable income
- $972
- Est. tax owed @ 24.0%
- −$233
- After-tax cash flow
- $1,828/yr
For passive investors: Depreciation is non-cash, so a rental often shows a tax loss while cash-flowing — sheltering income. Rental losses are passive: they offset passive income freely, and up to $25,000/yr can offset ordinary (W-2) income if you actively participate and your MAGI is under $100k (phasing out to $0 by $150k); unused losses carry forward. On sale, claimed depreciation is recaptured at up to 25%, and gains may owe capital-gains tax (a 1031 exchange can defer both). Figures are a year-1 estimate at your 24.0% rate — not tax advice; consult a CPA.
Schools (NCES district)
- District
- Limestone Chsd 310
- NCES district ID
- 1722950
- Math proficiency
- 25% ▲ 5.00%
- Reading proficiency
- 35% ▲ 4.00%
- Median HH income
- $49,759
- Composite
- 28.99/100
- National rank
- #11932
- State rank
- #486 of 919 in IL
Livability — Bartonville
- Score
- 62/100
- State rank
- #840
- US rank
- #16553
Category grades
Schools grade is shown separately in the Schools card above.
Census & demographics
- Census place
- Bartonville, IL
- Population (ZIP)
- 10,734
Population outlook (Peoria County) Hauer SSP2
- Today (2025)
- 183,007 people
- By 2030
- 179,643 · -1.8%
- By 2040
- 171,782 · -6.1%
- By 2050
- 163,508 · -10.7%
- By 2075
- 140,178 · -23.4%
- By 2100
- 114,493 · -37.4%
Race, ethnicity, and origin ACS 2023
- Neighborhood character
- Predominantly White (91%)
- Race & ethnicity
- White 91% Two or more races 4% Black 2% Hispanic / Latino 2% Asian 2%
- Common ancestry
- Romanian 2% Italian 2% Portuguese 2%
- Foreign-born
- 1%
- Languages at home
- 98% English-only · Vietnamese 1% Tagalog/Filipino 1%
Political lean MEDSL · Peoria
- 2024 margin
- Toss-up / Even · D 51.5% · R 46.9% · Other 1.6%
- 2008→2024 swing
- -9.2pp toward R · 2008: 13.9pp · 2024: 4.7pp
- All cycles
- 2024: D+4.7 2020: D+6.3 2016: D+2.8 2012: D+4.4 2008: D+13.9
Not yet ingested
- Civics
- —
Market trends
- HPI YoY
- ▼ -71.81%
- Current HPI
- 193.6234
- Rent YoY
- —
- Metro
- —
- State GDP YoY
- ▲ 1.59%
- F500 in state
- 60
Industry mix (Fortune 500 HQ in IL)
| Industry | F500 HQs | Revenue |
|---|---|---|
| Insurance | 4 | $201B |
|
||
| Consumer Goods | 4 | $87B |
|
||
| Industrial Machinery | 3 | $64B |
|
||
| Healthcare | 2 | $55B |
|
||
| Retail / Pharmacy | 1 | $148B |
|
||
| Agriculture / Food | 1 | $86B |
|
||
Price history
+42.5% since first listed11 events — show timeline
- 2026-05-14 Pending — RMLSA as Distributed by MLS Grid
- 2026-04-23 Price Changed $75,500 RMLSA as Distributed by MLS Grid
- 2026-03-18 Listed $89,000 RMLSA as Distributed by MLS Grid
- 2019-12-09 Sold (Public Records) $79,000 Public Records
- 2019-12-06 Sold (MLS) $79,000 RMLSA as Distributed by MLS Grid
- 2019-09-19 Listed $79,900 RMLSA as Distributed by MLS Grid
- 2010-05-26 Sold (Public Records) $75,000 Public Records
- 2010-05-25 Sold (MLS) $75,000 RMLSA as Distributed by MLS Grid
- 2010-01-13 Listed $79,900 RMLSA as Distributed by MLS Grid
- 1998-02-27 Sold (Public Records) $53,000 Public Records
- 1998-02-27 Sold (Public Records) $53,000 Public Records
Property tax history
+2.7%/yrLatest (2024): $2,053 · +8.5% YoY. Source: county tax records.
Cash-flow waterfall
monthlySold comps — $/sqft
last 12 mo · ≤1 miLoading sold comps…