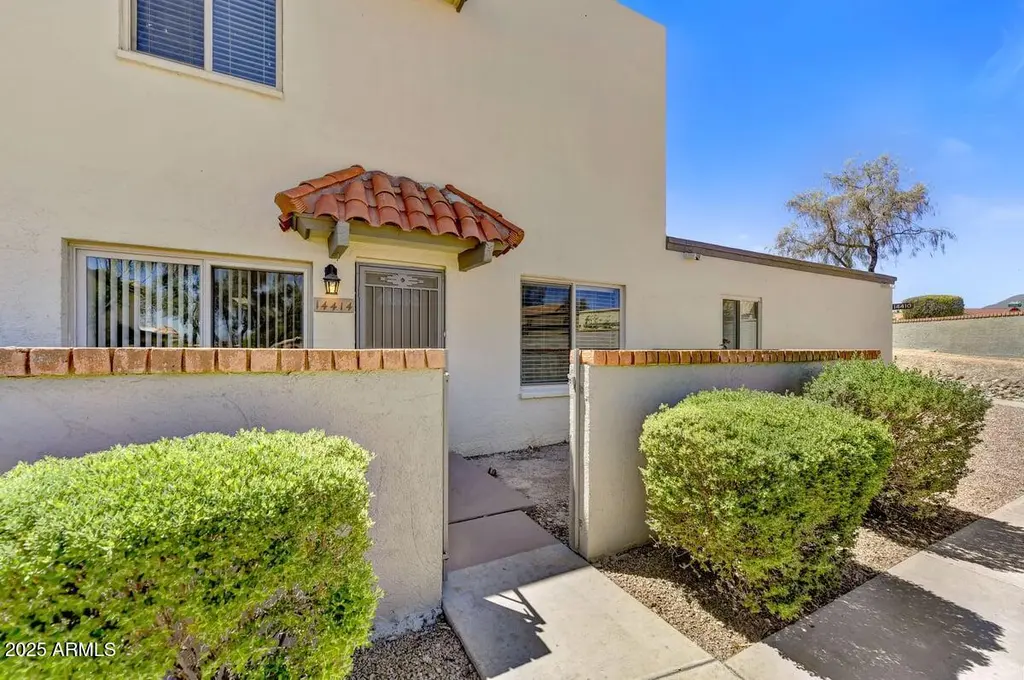
14414 N Boxwood Ln · Fountain Hills, AZ
Flood risk 1/10 · Minimal
- FEMA flood zone
- X (shaded)
- Chance of flooding over 30 yrs
- 0.0%
- Est. flood insurance / yr
- $507 – $1,088
Fire risk 5/10 · Moderate
- Est. fire insurance / yr
- $610 – $1,132
Heat risk 8/10 · Major
- Hot days now (above 113°F)
- 5 days/yr
- Hot days in 30 yrs
- 12 days/yr
Wind risk 1/10 · Minimal
- Chance of severe wind over 30 yrs
- —
Air-quality risk 4/10 · Minor
- Unhealthy air days now
- 4 days/yr
- Unhealthy air days in 30 yrs
- 5 days/yr
Risk factors via First Street. Map © Google.
Why this score? — see what drove the D grade
The composite is a weighted blend of 9 inputs, each scored 0–100. Each bar is that input's sub-score; the figure is the points it added to the 100-point composite (weight × sub-score).
- ARV discount +12.2/15.0
- Cash flow +9.4/30.0
- 1% rule +5.0/10.0
- Schools +3.6/10.0
- Livability +3.5/5.0
- Rent growth +2.8/5.0
- DSCR +2.6/10.0
- Condition / age +2.5/5.0
- Appreciation +0.0/10.0
$219,900
🖨 Deal sheet (PDF) 📄 Offer letter ✓ Due diligence
Listing remarks MLS
Your dream home awaits you in the heart of Fountain Hills. This spacious 2 bdrm, 1 bath beauty with a small gated courtyard style entry is looking for a new owner. Offers cozy great room, sep dining area, galley style kitchen with plenty of cabinets & counter space & a community pool. Experience vibrant living with parks, dining and entertainment just minutes away. This property isn't just a home; it's a great investment. With rising values, your dream awaits - act now & tour property today.
Key facts
- $371 HOA
- Parking
- Community pool
Neighborhood map
What this means for you Summary
Snapshot
- This is a 2-bed/2.0-bath condo listed at $220k.
Deal economics
- At list price, monthly cash flow is $-156 ($-2k/yr) — negative.
- To cash-flow at today's rent, offer at most $197k (10.3% below list).
- To meet the 1% rule (rent ≥ 1% of price), the offer needs to be $220k (0.1% below list).
- Recommended offer: $197k (10.3% below list) — sets the bar for cash-flow.
- Cap rate 5.4% vs local median 3.4% in Fountain Hills — top-decile yield for the area; either an underpriced asset or a hidden risk that comps aren't pricing in. Stress-test before assuming the spread holds.
Location & tenants
- Location reads 69/100 on livability (#45 in AZ) — a middle-class / working-renter tenant base. Strengths: employment A+, crime A, housing A; Watch: amenities F, commute F, cost of living F.
- Fountain Hills Unified District (4247) (other): math 32% / reading 47% proficiency, ranked #61 of 249 in AZ (top 24%) — families likely to look elsewhere, expect single-tenant / working-renter base with shorter leases; only 18% free/reduced lunch — higher-income household profile.
- Market conditions: Rents rising (+1.0%/yr); 448 active listings in the ZIP; 40 comparable units currently listed for rent nearby; rentals lingering (median 44d on market — plan ~5-8 weeks vacancy on turnover, expect pricing pressure); 50% of comp listings sitting > 30 days — soft ceiling on asking rent; high-income renter base; 36,011 units permitted in Maricopa County in 2024 (12,801 in 5+ unit buildings).
Forward outlook
- Local home prices are declining (-3.0%/yr); year-one equity from $2k of loan paydown is wiped out by about $7k of value loss. Plan a longer hold.
- Maricopa County population projected at +38% by 2050 — long-run rental-demand tailwind backs the buy-and-hold thesis.
Negotiation context
- It's been on market 74 days — a 6% lower offer ($207k) is reasonable based on typical stale-listing flexibility.
- 2 sale attempts with the ask held roughly flat each time — persistent listings suggest the price (not the market) is what's stuck; bring a comps-based counter.
- Current owner paid $35k; list at $220k implies a 528% gain — meaningful room to come down on a strong offer.
Risks & watch-outs
- Climate carrying-cost: moderate wildfire risk; extreme-heat days projected 5→12/yr by 2055 (HVAC capex compounding) — expect insurance premiums to compound above CPI over the hold.
Questions for the listing agent
- What do current leases actually rent for vs. the listed asking? Can we see a recent rent roll and the last 12 months of T-12 income?
- It's been on market 74 days. Have you received any prior offers? Is the seller open to a 10% concession, seller financing, or rate buy-down credit?
- Built in 1973 — when were the roof, HVAC, electrical panel, plumbing, and water heater last replaced?
- What does the HOA fee cover, when was the last increase, and are there any pending special assessments or reserve-fund shortfalls?
- Any open or pending special assessments — roof, HVAC, plumbing, elevator, façade? What's the per-unit balance and payoff schedule, and is the seller paying it off at close or rolling it to the buyer?
- Why hasn't it sold? Are there any deal-killer items the seller is aware of (foundation, flood, title, zoning, code violations)?
- Is there a deadline driving the sale (1031 exchange, divorce, estate, relocation)? That informs how much negotiation room exists.
- Schools are B-rated — typically a magnet for longer-tenancy family renters. What's the average tenant stay here, and is there a school-zone premium baked into asking?
- The area grade is low — what's the realistic commute time and amenity access for the typical tenant pool here? Any planned neighborhood developments (good or bad) we should know about?
- What's the average days-on-market for RENTAL listings here right now (not sales)? A rising rental-DOM trend means longer vacancies and softer asking-rent achievability than the comps imply.
- What's the recent tenant-quality profile in this submarket — average credit score on applications, eviction rate, late-payment / NSF rate, and stable-employment percentage? A property-management company in the area should have these aggregated.
- How much new apartment / multifamily construction is in the pipeline within 1–3 miles? Heavy new supply (>2% of stock underway) typically softens rents 12–24 months out; light construction supports rent growth.
Investment metrics
- 1% rule
- 1.00% ✗
- Cap rate
- 5.44%
- Cash-on-cash
- -3.04%
- DSCR
- 0.86
- GRM
- 8.3
CMA / ARV
- ARV (median comp)
- $245,629
- List price
- $219,900
- Delta
- -10.47%
- Verdict
- UNDERPRICED
- Comps
- 20 within 1.0 mi
Projected returns pro-forma
-3.0% appreciation · 1.03% rent growth · sell at horizon
- IRR
- -24.1%
- Equity multiple
- 0.19×
- Total profit
- $-49,574
- Equity at exit
- $32,788
- IRR
- -27.8%
- Equity multiple
- -0.17×
- Total profit
- $-71,736
- Equity at exit
- $19,013
Cash invested: $61,572 (down + closing). Projections, not guarantees.
Landlord ↔ Tenant lean methodology
- Overall (STATE)
- 87 Strongly Landlord-Friendly
- State Arizona
- 87 Strongly Landlord-Friendly · R+3
- County
- — inherits STATE
- City
- — inherits STATE
ZIP-level market 85268
- Rents YoY
- 1.0%
- Active inventory
- 448
- Price-to-rent
- 8.3×
Monthly cashflow live
- Estimated rent
- $2,196 high interval (Pro) →
- Mortgage (P&I)
- −$1,153
- Tax est. 1.5%
- −$275 /mo · $3,298/yr
- Insurance
- −$92
- HOA
- −$371
- Vacancy / Maint / Mgmt
- −$461
- Net cashflow
- $-156
Break-even live
Sensitivity live
| Price | -10% $-4 | -5% $-80 | +0% $-156 | +5% $-232 | +10% $-308 |
|---|---|---|---|---|---|
| Rent | -10% $-329 | -5% $-243 | +0% $-156 | +5% $-69 | +10% $18 |
| Rate | -1.0pp $-45 | -0.5pp $-100 | base $-156 | +0.5pp $-213 | +1.0pp $-271 |
UW: 25.0% down · 7.5% · 30yr · 1.5% tax · 5.0% vac · 8.0% maint · 8.0% mgmt
Financing live
Cash to close
- Down payment
- $54,975
- Closing costs
- $6,597
- Reserves months
- —
- Total cash needed
- —
Loan-product check · same deal, 3 products live
Conventional
25% down · 7.5% · 30yr
- Down + closing
- —
- Monthly P&I
- —
- Monthly cashflow
- —
- DSCR
- —
- Eligible?
- —
Personal DTI + credit; lowest rate.
DSCR
20% down · 8.5% · 30yr
- Down + closing
- —
- Monthly P&I
- —
- Monthly cashflow
- —
- DSCR
- —
- Eligible?
- —
No personal income docs; deal must DSCR.
Hard money
10% down · 12.0% · 12mo
- Down + closing
- —
- Monthly P&I
- —
- Monthly cashflow
- —
- DSCR
- —
- Eligible?
- —
Short-term bridge; refi at stabilization.
Rent comps 40 comps
| Address | Beds | Baths | Sqft | Rent | $/sqft | DOM | Units | Dist |
|---|---|---|---|---|---|---|---|---|
| 14404 N Boxwood Ln Fountain Hills, AZ | 2.0 | 1.5 | 967 | $2,900 | $3.00 | 44d | 1 | 0.01mi |
| 14259 N Boxwood Ln Fountain Hills, AZ | 2.0 | 1.0 | 1026 | $1,500 | $1.46 | 44d | 1 | 0.06mi |
| 14247 N Boxwood Ln Fountain Hills, AZ | 2.0 | 1.5 | 967 | $2,900 | $3.00 | 44d | 1 | 0.08mi |
| 14216 N Saguaro Blvd Fountain Hills, AZ | 2.0 | 2.0 | 1090 | $2,100 | $1.93 | 25d | 1 | 0.12mi |
| 14620 N Yerba Buena Way Unit D Fountain Hills, AZ | 2.0 | 2.0 | 1026 | $2,200 | $2.14 | 44d | 1 | 0.17mi |
| 14644 Yerba Buena Way Fountain Hills, AZ | 2.0 | 1.0 | 1000 | $1,499 | $1.50 | 44d | 1 | 0.21mi |
| 14802 N Yerba Buena Way Unit D Fountain Hills, AZ | 2.0 | 1.0 | 1026 | $1,200 | $1.17 | 44d | 1 | 0.24mi |
| 17014 E Calle Del Oro Unit C Fountain Hills, AZ | 2.0 | 1.0 | 1000 | $1,295 | $1.29 | 25d | 1 | 0.25mi |
| 17014 E Calle Del Oro Unit C Fountain Hills, AZ | 2.0 | 1.0 | 1000 | $1,295 | $1.29 | 44d | 1 | 0.25mi |
| 17014 E Calle del Oro Unit D Fountain Hills, AZ | 2.0 | 1.0 | 1026 | $2,050 | $2.00 | 44d | 1 | 0.25mi |
| 14645 N Fountain Hills Blvd #204 Fountain Hills, AZ | 2.0 | 2.0 | 1000 | $3,100 | $3.10 | 44d | 1 | 0.28mi |
| 13818 N Saguaro Blvd Fountain Hills, AZ | 2.0 | 2.0 | 1032 | $1,700 | $1.65 | 6d | 2 | 0.35mi |
| 16750 E Westby Dr Unit B Fountain Hills, AZ | 2.0 | 2.0 | 1076 | $2,800 | $2.60 | 44d | 1 | 0.38mi |
| 13804 N Saguaro Blvd #211 Fountain Hills, AZ | 2.0 | 2.0 | 1032 | $3,000 | $2.91 | 44d | 1 | 0.41mi |
| 13636 N Saguaro Blvd #103 Fountain Hills, AZ | 2.0 | 2.0 | 912 | $2,800 | $3.07 | 44d | 1 | 0.44mi |
| 13624 N Saguaro Blvd Unit B118 Fountain Hills, AZ | 2.0 | 2.0 | 1000 | $1,495 | $1.50 | 25d | 1 | 0.47mi |
| 13607 N Hamilton Dr Unit A18 Fountain Hills, AZ | 2.0 | 2.0 | 987 | $2,699 | $2.73 | 44d | 1 | 0.48mi |
| 16912 E La Montana Dr Unit D124 Fountain Hills, AZ | 2.0 | 2.0 | 987 | $3,500 | $3.55 | 44d | 1 | 0.49mi |
| 16510 E Palisades Blvd #22 Fountain Hills, AZ | 2.0 | 1.5 | 1105 | $2,900 | $2.62 | 44d | 1 | 0.63mi |
| 16344 E Arrow Dr Unit A1 Fountain Hills, AZ | 2.0 | 2.0 | 979 | $3,300 | $3.37 | 44d | 1 | 0.67mi |
| 16357 E Arrow Dr #115 Fountain Hills, AZ | 2.0 | 2.0 | 1074 | $1,850 | $1.72 | 44d | 1 | 0.71mi |
| 16715 E Parkview Ave Unit 201 Fountain Hills, AZ | 1.0 | 1.0 | 1100 | $1,725 | $1.57 | 5d | 1 | 0.76mi |
| 16550 E Avenue of the Fountains Fountain Hills, AZ | 1.0–2.0 | 1.0–2.0 | 896 | $2,440 | $2.72 | 3d | 8 | 0.80mi |
| 16725 E Avenue of the Fountains Fountain Hills, AZ | 1.0 | 1.0 | 860 | $1,649 | $1.92 | 3d | 1 | 0.91mi |
| 16725 E Avenue of the Fountains Fountain Hills, AZ | 1.0 | 1.0 | 860 | $1,675 | $1.95 | 13d | 1 | 0.91mi |
| 16216 E Rosetta Dr #31 Fountain Hills, AZ | 2.0 | 2.0 | 1000 | $3,700 | $3.70 | 3d | 1 | 1.08mi |
| 13225 N Fountain Hills Blvd Fountain Hills, AZ | 2.0 | 2.0 | 1063 | $1,750 | $1.65 | 25d | 1 | 1.10mi |
| 13225 N Fountain Hills Blvd Fountain Hills, AZ | 2.0 | 2.0 | 1005 | $1,750 | $1.74 | 44d | 1 | 1.10mi |
| 13225 N Fountain Hills Blvd Fountain Hills, AZ | 2.0 | 2.0 | 1063 | $1,750 | $1.65 | 22d | 1 | 1.10mi |
| 12635 N La Montana Dr #15 Fountain Hills, AZ | 2.0 | 1.0 | 858 | $1,495 | $1.74 | 44d | 1 | 1.14mi |
| 16631 E El Lago Blvd Fountain Hills, AZ | 2.0 | 2.0 | 1085 | $1,774 | $1.64 | 25d | 2 | 1.16mi |
| 16715 E El Lago Blvd #214 Fountain Hills, AZ | 2.0 | 2.0 | 1085 | $1,700 | $1.57 | 25d | 1 | 1.16mi |
| 17031 E El Lago Blvd #2106 Fountain Hills, AZ | 1.0 | 1.0 | 649 | $3,500 | $5.39 | 25d | 1 | 1.17mi |
| 17031 E El Lago Blvd Fountain Hills, AZ | 1.0 | 1.0 | 649 | $2,550 | $3.93 | 25d | 3 | 1.24mi |
| 17031 E El Lago Blvd Fountain Hills, AZ | 1.0 | 1.0 | 649 | $3,050 | $4.70 | 21d | 2 | 1.24mi |
| 16724 E Gunsight Dr #219 Fountain Hills, AZ | 2.0 | 1.5 | 1017 | $2,595 | $2.55 | 6d | 1 | 1.25mi |
| 16545 E Gunsight Dr #122 Fountain Hills, AZ | 1.0 | 2.0 | 750 | $1,500 | $2.00 | 15d | 1 | 1.26mi |
| 16545 E Gunsight Dr #223 Fountain Hills, AZ | 1.0 | 2.0 | 750 | $1,300 | $1.73 | 15d | 1 | 1.27mi |
| 16819 E Gunsight Dr Unit A8 Fountain Hills, AZ | 1.0 | 1.0 | 576 | $2,900 | $5.03 | 44d | 1 | 1.29mi |
| 16657 E Gunsight Dr Fountain Hills, AZ | 2.0 | 2.0 | 865 | $1,645 | $1.90 | 12d | 1 | 1.29mi |
HOA detail condo
- Monthly dues
- $371 · $4,452/yr
- Likely covers
- poolsecurity
- Assessments
- None detected in remarks — confirm with the listing agent.
Listing history 20 events
-
2026-06-18days on market $219,900 Active 74 DOM
-
2026-06-17days on market $219,900 Active 73 DOM
-
2026-06-16days on market $219,900 Active 72 DOM
-
2026-06-15days on market $219,900 Active 71 DOM
-
2026-06-13days on market $219,900 Active 69 DOM
-
2026-06-09days on market $219,900 Active 65 DOM
-
2026-06-08days on market $219,900 Active 64 DOM
-
2026-06-07days on market $219,900 Active 63 DOM
-
2026-06-04days on market $219,900 Active 60 DOM
-
2026-06-03days on market $219,900 Active 59 DOM
-
2026-06-02days on market $219,900 Active 58 DOM
-
2026-06-01days on market $219,900 Active 57 DOM
-
2026-05-31days on market $219,900 Active 56 DOM
-
2026-04-05$219,900 Active 510-char remark
Show marketing remark (510 chars)
Your dream home awaits you in the heart of Fountain Hills. This spacious 2 bdrm, 1 bath beauty with a small gated courtyard style entry is looking for a new owner. Offers cozy great room, sep dining area, galley style kitchen with plenty of cabinets & counter space & a community pool. Experience vibrant living with parks, dining and entertainment just minutes away. This property isn't just a home; it's a great investment. With rising values, your dream awaits - act now & tour property today.
-
2025-10-02historical
-
2025-09-03price $229,900
-
2025-05-14price $239,900
-
2025-03-28$244,900 Active
-
1994-01-31soldstatus $35,000
-
1988-06-06soldstatus $34,000
ⓘ Source: listings_history table (triggers on properties + properties_extension) + one-shot
backfill from property_details.listing_events for pre-trigger history.
Climate risk First Street
- Flood 1/10 Low FEMA zone X (shaded) · 0% chance over 30 yrs
- Wildfire 5/10 Major
- Heat 8/10 Severe 5 d/yr ≥113°F today · 12 d/yr by 30 yrs out
- Wind 1/10 Low
- Air quality 4/10 Moderate 4 unhealthy d/yr today · 5 by 30 yrs out
Nearby sold comps map
Loading sold comps map…
Walkable amenities ~0.75 mi
Loading nearby amenities…
Taxation est. · year 1
- Rental income
- $26,350
- − Mortgage interest
- −$12,318
- − Property taxes
- −$3,298
- − Insurance
- −$1,100
- − Repairs & maintenance
- −$2,108
- − Management
- −$2,108
- − HOA
- −$4,452
- − Depreciation
- −$6,397
- Taxable loss
- −$5,431
- Est. tax savings @ 24.0%
- +$1,303
- After-tax cash flow
- $-568/yr
For passive investors: Depreciation is non-cash, so a rental often shows a tax loss while cash-flowing — sheltering income. Rental losses are passive: they offset passive income freely, and up to $25,000/yr can offset ordinary (W-2) income if you actively participate and your MAGI is under $100k (phasing out to $0 by $150k); unused losses carry forward. On sale, claimed depreciation is recaptured at up to 25%, and gains may owe capital-gains tax (a 1031 exchange can defer both). Figures are a year-1 estimate at your 24.0% rate — not tax advice; consult a CPA.
Schools (NCES district)
- District
- Fountain Hills Unified District (4247)
- NCES district ID
- 0403040
- Math proficiency
- 32% ▼ -21.00%
- Reading proficiency
- 47% ▼ -8.00%
- Median HH income
- $75,038
- Composite
- 36.41/100
- National rank
- #4677
- State rank
- #61 of 249 in AZ
Livability — Fountain Hills
- Score
- 69/100
- State rank
- #45
- US rank
- #8769
Category grades
Schools grade is shown separately in the Schools card above.
Census & demographics
- Census place
- Fountain Hills, AZ
- County
- Maricopa County · 4,537,380 people
- City population
- 23,849
- Metro
- Phoenix-Mesa-Chandler, AZ
- Population (ZIP)
- 23,849
- Household income
- $112,795
- Rent vs Own
- Severe rent burden
- 374.0
Population outlook (Maricopa County) Hauer SSP2
- Today (2025)
- 4,979,203 people
- By 2030
- 5,378,229 · +8.0%
- By 2040
- 6,156,598 · +23.6%
- By 2050
- 6,872,376 · +38.0%
- By 2075
- 8,401,270 · +68.7%
- By 2100
- 9,247,439 · +85.7%
Race, ethnicity, and origin ACS 2023
- Neighborhood character
- Predominantly White (88%)
- Race & ethnicity
- White 88% Two or more races 5% Hispanic / Latino 4% Black 3% Asian 2%
- Common ancestry
- Romanian 4% Portuguese 4% Slovak 3%
- Foreign-born
- 8% · Canada
- Languages at home
- 94% English-only · Spanish 2% Other Indo-European 1% Russian/Polish/Slavic 1%
Political lean MEDSL · Maricopa
- 2024 margin
- Toss-up / Even · D 47.7% · R 51.2% · Other 1.1%
- 2008→2024 swing
- +7.1pp toward D · 2008: -10.6pp · 2024: -3.5pp
- All cycles
- 2024: R+3.5 2020: D+2.2 2016: R+3.5 2012: R+12.0 2008: R+10.6
Not yet ingested
- Civics
- —
Market trends
- HPI YoY
- ▼ -205.81%
- Current HPI
- 283.4064
- Rent YoY
- ▲ 1.03%
- Metro
- Phoenix-Mesa-Chandler, AZ
- State GDP YoY
- ▲ 4.54%
- F500 in state
- 20
Industry mix (Fortune 500 HQ in AZ)
| Industry | F500 HQs | Revenue |
|---|---|---|
| Technology | 2 | $13B |
|
||
| Mining / Metals | 1 | $23B |
|
||
| Environmental Services | 1 | $16B |
|
||
| Metals / Steel | 1 | $14B |
|
||
| Technology Distribution | 1 | $9B |
|
||
| Homebuilding | 1 | $8B |
|
||
Price history
+546.8% since first listed7 events — show timeline
- 2026-04-05 Listed $219,900 ARMLS
- 2025-10-02 Listing Removed — ARMLS
- 2025-09-03 Price Changed $229,900 ARMLS
- 2025-05-14 Price Changed $239,900 ARMLS
- 2025-03-28 Listed $244,900 ARMLS
- 1994-01-31 Sold (Public Records) $35,000 Public Records
- 1988-06-06 Sold (Public Records) $34,000 Public Records
Property tax history
-2.3%/yrLatest (2025): $418 · -3.7% YoY. Source: county tax records.
Cash-flow waterfall
monthlySold comps — $/sqft
last 12 mo · ≤1 miLoading sold comps…