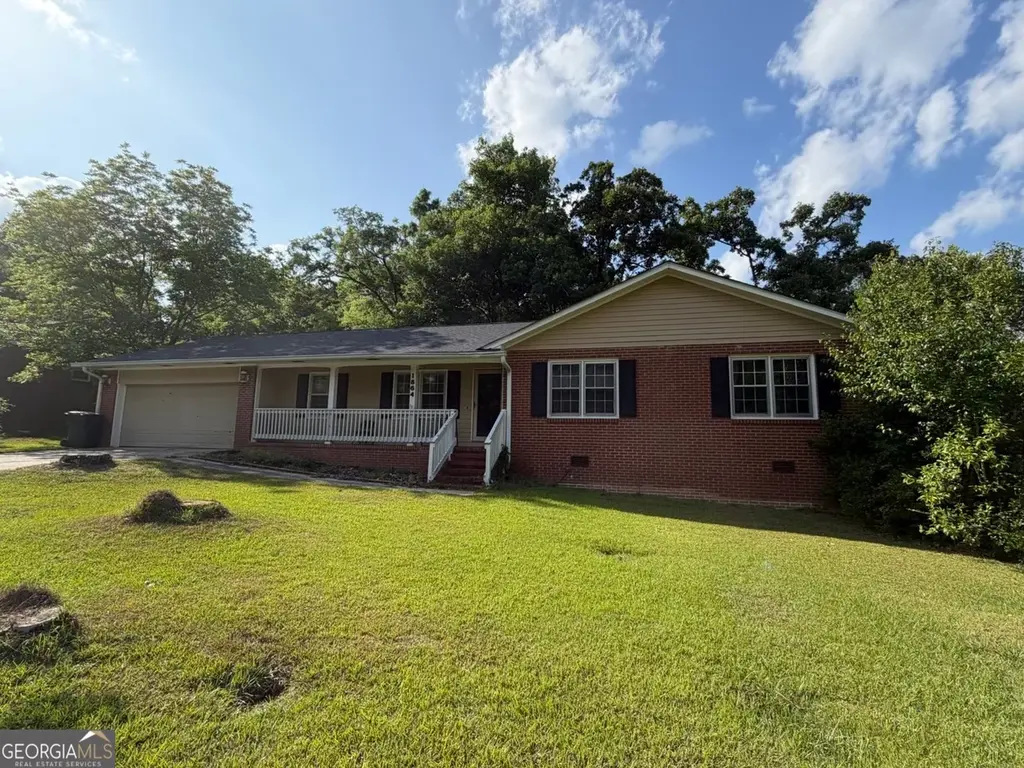
1864 Timberlane Rd · Milledgeville, GA
Flood risk 1/10 · Minimal
- FEMA flood zone
- X (unshaded)
- Chance of flooding over 30 yrs
- 0.0%
- Est. flood insurance / yr
- $507 – $1,088
Fire risk 3/10 · Minor
- Est. fire insurance / yr
- $963 – $1,789
Heat risk 7/10 · Major
- Hot days now (above 109°F)
- 7 days/yr
- Hot days in 30 yrs
- 17 days/yr
Wind risk 6/10 · Moderate
- Chance of severe wind over 30 yrs
- 63.0%
Air-quality risk 3/10 · Minor
- Unhealthy air days now
- 3 days/yr
- Unhealthy air days in 30 yrs
- 4 days/yr
Risk factors via First Street. Map © Google.
Why this score? — see what drove the D grade
The composite is a weighted blend of 9 inputs, each scored 0–100. Each bar is that input's sub-score; the figure is the points it added to the 100-point composite (weight × sub-score).
- ARV discount +14.9/15.0
- Cash flow +9.5/30.0
- Rent growth +3.5/5.0
- Livability +3.4/5.0
- DSCR +2.7/10.0
- Condition / age +2.5/5.0
- 1% rule +2.4/10.0
- Schools +1.4/10.0
- Appreciation +0.0/10.0
$179,900
🖨 Deal sheet (PDF) 📄 Offer letter ✓ Due diligence
Listing remarks
Here is your chance to get into one of Milledgeville's most desirable neighborhoods at a price that provides real value. Nestled in the established Carrington Woods community, this All-Brick, 3 bedroom, 2 bath home is priced right and is ready for an owner occupant or an investor who wants a great home with a little sweat equity. With over 1,500 +/- square feet of living space, the layout gives you room to breathe. A separate living room, family room, and dining room provide flexibility for the way real families actually live. The home needs a little TLC. Think fresh paint, new carpet, and a master bathroom refresh, which means the bones are solid and at this price, the opportunity is real.
Key facts
- Fenced backyard
- 0.29 acre lot
- Garage
Tags
Property features AI
Finance
- Financial info: Listing marketed as cash or conventional purchase; Special conditions: Agent owned, agent/seller relationship, sold as-is, currently a rental
- HOA & community: No homeowners association
Exterior
- Parking: Attached garage with space for 2 vehicles
- Utilities: Public water available; Public sewer (sewer connected); Electricity available
- Home design: Single-family house; One story; Resale property; Subdivision: Carrington Woods
- Construction: Brick construction; Composition roof; Built in 1979; Crawl space foundation
- Exterior features: Deck; Porch; Other exterior features; Back yard fencing (chain link, fenced); Level, private lot; Grassed and partially wooded vegetation
Interior
- Kitchen: Cooktop; Dishwasher; Refrigerator; Electric water heater
- Bedrooms: 3 bedrooms on the main level
- Flooring: Carpet; Laminate; Vinyl
- Bathrooms: 2 full bathrooms (both on the main level)
- Heating & cooling: Central heating; Central air conditioning; Fireplace in family room (1)
- Interior features: Split bedroom plan; Den; Family room; Laundry area; Separate dining room
- Laundry & utility: Laundry located in kitchen and laundry closet; Additional utility/other space
Neighborhood map
What this means for you Summary
Snapshot
- This is a 3-bed/2.0-bath single-family listed at $180k.
Deal economics
- At list price, monthly cash flow is $-124 ($-1k/yr) — negative.
- To cash-flow at today's rent, offer at most $158k (12.2% below list).
- To meet the 1% rule (rent ≥ 1% of price), the offer needs to be $132k (26.5% below list).
- Recommended offer: $132k (26.5% below list) — sets the bar for 1% rule.
- Cap rate 5.5% vs local median 2.9% in Milledgeville — top-decile yield for the area; either an underpriced asset or a hidden risk that comps aren't pricing in. Stress-test before assuming the spread holds.
Location & tenants
- Location reads 68/100 on livability (#134 in GA) — a middle-class / working-renter tenant base. Strengths: cost of living A+, health & safety A+, housing A-; Watch: amenities D+, crime F, commute F.
- Baldwin County (town): math 13% / reading 20% proficiency, ranked #152 of 174 in GA (top 87%) — low school quality limits family demand, transient renter base, plan for 1-2y turnover; 72% free/reduced lunch — lower-income household profile, screen leases tightly.
- Zoned schools: Lakeview Primary (835 students, 89% FRL); Oak Hill Ms (math 13% / reading 24%, grade F, #372 of 470 statewide, top 80%, 986 students, 89% FRL); Baldwin High School (math 10% / reading 21%, grade F, #290 of 424 statewide, top 69%, 1,311 students, 89% FRL) — zoned schools average 89% FRL vs 72% district-wide (17 pts higher); higher-poverty schools than district average — tighter screening recommended.
- Market conditions: Rents rising fast (+4.0%/yr); 375 active listings in the ZIP; 15 comparable units currently listed for rent nearby; rentals lingering (median 44d on market — plan ~5-8 weeks vacancy on turnover, expect pricing pressure); 80% of comp listings sitting > 30 days — soft ceiling on asking rent; 202 units permitted in Baldwin County in 2024 (12 in 5+ unit buildings).
Forward outlook
- Local home prices are declining (-3.0%/yr); year-one equity from $1k of loan paydown is wiped out by about $5k of value loss. Plan a longer hold.
- Baldwin County population projected to shrink 8% by 2050 — rents likely to lag national; underwrite the cash flow, not the appreciation.
Negotiation context
- It's been on market 50 days — a 3% lower offer ($175k) is reasonable based on typical stale-listing flexibility.
- Current owner paid $83k; list at $180k implies a 117% gain — meaningful room to come down on a strong offer.
Risks & watch-outs
- Climate carrying-cost: major wind risk, 63% chance of damaging wind over 30y; extreme-heat days projected 7→17/yr by 2055 (HVAC capex compounding) — expect insurance premiums to compound above CPI over the hold.
Questions for the listing agent
- What do current leases actually rent for vs. the listed asking? Can we see a recent rent roll and the last 12 months of T-12 income?
- It's been on market 50 days. Have you received any prior offers? Is the seller open to a 26% concession, seller financing, or rate buy-down credit?
- Built in 1979 — when were the roof, HVAC, electrical panel, plumbing, and water heater last replaced?
- Is there a deadline driving the sale (1031 exchange, divorce, estate, relocation)? That informs how much negotiation room exists.
- Schools are F-rated, which usually means shorter tenancies and higher turnover. Who's the typical renter profile here, and what's been the actual vacancy rate?
- Crime grade is F in this area — have there been break-ins, vandalism, or insurance claims at this property in the last 3 years? What carrier currently insures it and at what premium?
- The area grade is low — what's the realistic commute time and amenity access for the typical tenant pool here? Any planned neighborhood developments (good or bad) we should know about?
- What's the average days-on-market for RENTAL listings here right now (not sales)? A rising rental-DOM trend means longer vacancies and softer asking-rent achievability than the comps imply.
- What's the recent tenant-quality profile in this submarket — average credit score on applications, eviction rate, late-payment / NSF rate, and stable-employment percentage? A property-management company in the area should have these aggregated.
- How much new for-sale + rental construction is in the pipeline within 1–3 miles? Heavy new supply typically softens prices + rents 12–24 months out; constrained supply supports both.
Investment metrics
- 1% rule
- 0.74% ✗
- Cap rate
- 5.46%
- Cash-on-cash
- -2.96%
- DSCR
- 0.87
- GRM
- 11.3
CMA / ARV
- ARV (median comp)
- $215,292
- List price
- $179,900
- Delta
- -16.44%
- Verdict
- UNDERPRICED
- Comps
- 20 within 1.0 mi
Show comp detail 12 sales within ~0.75 mi
| Address | Dist | Beds/Ba | Sqft | Sold | Price | $/sf | Match |
|---|---|---|---|---|---|---|---|
| 1835 Audobon Rd NE | 0.07mi | 3/2.0 | 1,521 (-0%) | 8mo | $180,000 | $118 | 89 |
| 1751 Holly Hill Rd | 0.27mi | 3/2.0 | 1,564 (+3%) | 2mo | $225,000 | $144 | 82 |
| 1954 Twin Oaks Dr | 0.36mi | 3/2.0 | 1,448 (-5%) | 3mo | $150,000 | $104 | 72 |
| 1880 Timberlane Rd | 0.08mi | 3/2.0 | 1,378 (-10%) | 13mo | $217,000 | $157 | 69 |
| 1760 Holly Hill Rd | 0.24mi | 3/1.0 | 1,441 (-6%) | 11mo | $185,000 | $128 | 66 |
| 271 Lakeside Dr | 0.56mi | 3/2.0 | 1,560 (+2%) | 5mo | $167,500 | $107 | 66 |
| 1750 Elmwood Rd | 0.40mi | 3/2.0 | 1,434 (-6%) | 8mo | $160,000 | $112 | 65 |
| 261 Lakeside Dr | 0.55mi | 3/2.0 | 1,604 (+5%) | 3mo | $203,000 | $127 | 64 |
| 1784 Cedarwood Rd | 0.56mi | 3/2.5 | 1,667 (+9%) | 4mo | $185,000 | $111 | 53 |
| 2288 Leo Ct | 0.48mi | 3/1.5 | 1,310 (-14%) | 3mo | $98,000 | $75 | 50 |
| 2290 Prince Ct | 0.50mi | 3/2.0 | 1,300 (-15%) | 13mo | $226,000 | $174 | 41 |
| 1949 Karen Cir | 0.56mi | 4/4.0 (+1) | 1,716 (+12%) | 3mo | $250,000 | $146 | 38 |
Match score weights: distance 35% · size 25% · config 20% · recency 20%. Top-matched comps best support the ARV.
Projected returns pro-forma
-3.0% appreciation · 4.05% rent growth · sell at horizon
- IRR
- -20.2%
- Equity multiple
- 0.29×
- Total profit
- $-35,675
- Equity at exit
- $26,824
- IRR
- -11.2%
- Equity multiple
- 0.30×
- Total profit
- $-35,435
- Equity at exit
- $15,554
Cash invested: $50,372 (down + closing). Projections, not guarantees.
Landlord ↔ Tenant lean methodology
- Overall (STATE)
- 90 Strongly Landlord-Friendly
- State Georgia
- 90 Strongly Landlord-Friendly · R+3
- County
- — inherits STATE
- City
- — inherits STATE
ZIP-level market 31061
- Home prices YoY
- -29.9%
- Rents YoY
- 4.0%
- Active inventory
- 375
- Price-to-rent
- 11.3×
Monthly cashflow live
- Estimated rent
- $1,323 high interval (Pro) →
- Mortgage (P&I)
- −$943
- Tax from tax record
- −$151 /mo · $1,811/yr
- Insurance
- −$75
- HOA
- −$0
- Vacancy / Maint / Mgmt
- −$278
- Net cashflow
- $-124
Break-even live
Sensitivity live
| Price | -10% $-22 | -5% $-73 | +0% $-124 | +5% $-175 | +10% $-226 |
|---|---|---|---|---|---|
| Rent | -10% $-229 | -5% $-176 | +0% $-124 | +5% $-72 | +10% $-20 |
| Rate | -1.0pp $-34 | -0.5pp $-78 | base $-124 | +0.5pp $-171 | +1.0pp $-218 |
UW: 25.0% down · 7.5% · 30yr · 1.5% tax · 5.0% vac · 8.0% maint · 8.0% mgmt
Financing live
Cash to close
- Down payment
- $44,975
- Closing costs
- $5,397
- Reserves months
- —
- Total cash needed
- —
Loan-product check · same deal, 3 products live
Conventional
25% down · 7.5% · 30yr
- Down + closing
- —
- Monthly P&I
- —
- Monthly cashflow
- —
- DSCR
- —
- Eligible?
- —
Personal DTI + credit; lowest rate.
DSCR
20% down · 8.5% · 30yr
- Down + closing
- —
- Monthly P&I
- —
- Monthly cashflow
- —
- DSCR
- —
- Eligible?
- —
No personal income docs; deal must DSCR.
Hard money
10% down · 12.0% · 12mo
- Down + closing
- —
- Monthly P&I
- —
- Monthly cashflow
- —
- DSCR
- —
- Eligible?
- —
Short-term bridge; refi at stabilization.
Rent comps 15 comps
| Address | Beds | Baths | Sqft | Rent | $/sqft | DOM | Units | Dist |
|---|---|---|---|---|---|---|---|---|
| 1985 Briarcliff Rd Unit A2 Milledgeville, GA | 2.0 | 2.5 | 1380 | $1,249 | $0.91 | 44d | 1 | 0.33mi |
| 1753 Cedarwood Rd Milledgeville, GA | 3.0 | 2.0 | 1740 | $1,800 | $1.03 | 44d | 1 | 0.42mi |
| 1820 N Ridge Dr Unit A Milledgeville, GA | 2.0 | 2.0 | 1200 | $975 | $0.81 | 44d | 1 | 0.46mi |
| 1920 Karen Cir Milledgeville, GA | 2.0 | 2.0 | 1125 | $985 | $0.88 | 44d | 1 | 0.51mi |
| 2233 Leo Ct Milledgeville, GA | 3.0 | 1.5 | 1275 | $1,300 | $1.02 | 44d | 1 | 0.61mi |
| 110 Waverly Cir Milledgeville, GA | 2.0 | 2.5 | 1200 | $1,249 | $1.04 | 21d | 1 | 0.97mi |
| 436 Whistle Way Milledgeville, GA | 2.0 | 2.5 | 1250 | $1,249 | $1.00 | 44d | 1 | 1.02mi |
| 411 Whistle Way Milledgeville, GA | 2.0 | 2.5 | 1300 | $1,249 | $0.96 | 44d | 1 | 1.02mi |
| 391 Whistle Way Milledgeville, GA | 2.0 | 2.5 | 1200 | $1,249 | $1.04 | 44d | 1 | 1.04mi |
| 387 Whistle Way Milledgeville, GA | 2.0 | 2.5 | 1200 | $1,249 | $1.04 | 44d | 1 | 1.05mi |
| 367 Whistle Way Milledgeville, GA | 2.0 | 2.5 | 1200 | $1,249 | $1.04 | 44d | 1 | 1.07mi |
| 365 Whistle Way Milledgeville, GA | 2.0 | 2.5 | 1200 | $1,249 | $1.04 | 44d | 1 | 1.07mi |
| 250 Whistle Way Milledgeville, GA | 2.0 | 2.5 | 1200 | $1,100 | $0.92 | 21d | 1 | 1.12mi |
| 189 Cobblestone Park Dr Milledgeville, GA | 2.0 | 2.5 | 1200 | $1,295 | $1.08 | 21d | 1 | 1.42mi |
| 825 Matheson Rd Milledgeville, GA | 2.0 | 1.0 | 1300 | $1,100 | $0.85 | 44d | 1 | 1.43mi |
Listing history 18 events
-
2026-06-19days on market $179,900 Active 50 DOM
-
2026-06-18days on market $179,900 Active 49 DOM
-
2026-06-17days on market $179,900 Active 48 DOM
-
2026-06-16days on market $179,900 Active 47 DOM
-
2026-06-15days on market $179,900 Active 46 DOM
-
2026-06-14days on market $179,900 Active 44 DOM
-
2026-06-12days on market $179,900 Active 43 DOM
-
2026-06-09days on market $179,900 Active 40 DOM
-
2026-06-08days on market $179,900 Active 39 DOM
-
2026-06-07days on market $179,900 Active 38 DOM
-
2026-06-05days on market $179,900 Active 35 DOM
-
2026-06-03days on market $179,900 Active 34 DOM
-
2026-06-02days on market $179,900 Active 33 DOM
-
2026-06-01days on market $179,900 Active 32 DOM
-
2026-05-31days on market $179,900 Active 31 DOM
-
2026-05-30days on market $179,900 Active 30 DOM
-
2026-04-30$179,900 New 1052-char remark
-
2014-09-29soldstatus $83,000
ⓘ Source: listings_history table (triggers on properties + properties_extension) + one-shot
backfill from property_details.listing_events for pre-trigger history.
Tax reassessment forecast GA · Resets to sale price
- Current annual tax
- $1,811 · $151/mo
- Projected year-2 tax
- $1,811 · $151/mo
- Expected delta
- $0/yr ($0/mo · 0.0%)
ⓘ Screening estimate from a state-policy table — verify with the county assessor before closing.
Climate risk First Street
- Flood 1/10 Low FEMA zone X (unshaded) · 0% chance over 30 yrs
- Wildfire 3/10 Moderate
- Heat 7/10 Severe 7 d/yr ≥109°F today · 17 d/yr by 30 yrs out
- Wind 6/10 Major 63% chance of damaging wind over 30 yrs
- Air quality 3/10 Moderate 3 unhealthy d/yr today · 4 by 30 yrs out
Nearby sold comps map
Loading sold comps map…
Walkable amenities ~0.75 mi
Loading nearby amenities…
Taxation est. · year 1
- Rental income
- $15,875
- − Mortgage interest
- −$10,077
- − Property taxes
- −$1,811
- − Insurance
- −$900
- − Repairs & maintenance
- −$1,270
- − Management
- −$1,270
- − Depreciation
- −$5,233
- Taxable loss
- −$4,686
- Est. tax savings @ 24.0%
- +$1,125
- After-tax cash flow
- $-366/yr
For passive investors: Depreciation is non-cash, so a rental often shows a tax loss while cash-flowing — sheltering income. Rental losses are passive: they offset passive income freely, and up to $25,000/yr can offset ordinary (W-2) income if you actively participate and your MAGI is under $100k (phasing out to $0 by $150k); unused losses carry forward. On sale, claimed depreciation is recaptured at up to 25%, and gains may owe capital-gains tax (a 1031 exchange can defer both). Figures are a year-1 estimate at your 24.0% rate — not tax advice; consult a CPA.
Schools (NCES district)
- District
- Baldwin County
- NCES district ID
- 1300210
- Math proficiency
- 13% ▼ -8.00%
- Reading proficiency
- 20% ▼ -5.00%
- Median HH income
- $35,615
- Composite
- 13.61/100
- National rank
- #9508
- State rank
- #152 of 174 in GA
Livability — Milledgeville
- Score
- 68/100
- State rank
- #134
- US rank
- #9206
Category grades
Schools grade is shown separately in the Schools card above.
Census & demographics
- Census place
- Milledgeville, GA
- County
- Baldwin County · 41,764 people
- City population
- 41,764
- Metro
- Milledgeville, GA
- Population (ZIP)
- 41,764
- Household income
- $54,263
- Rent vs Own
- Severe rent burden
- 1630.0
Population outlook (Baldwin County) Hauer SSP2
- Today (2025)
- 45,602 people
- By 2030
- 45,481 · -0.3%
- By 2040
- 44,310 · -2.8%
- By 2050
- 42,129 · -7.6%
- By 2075
- 36,819 · -19.3%
- By 2100
- 29,320 · -35.7%
Race, ethnicity, and origin ACS 2023
- Neighborhood character
- Diverse neighborhood (Simpson 0.56)
- Race & ethnicity
- White 51% Black 43% Hispanic / Latino 3% Two or more races 3% Asian 2%
- Common ancestry
- Slovak 1% Serbian 1% Italian 1%
- Foreign-born
- 3% · Canada, South Korea
- Languages at home
- 96% English-only · Spanish 2% Korean 1%
Political lean MEDSL · Baldwin
- 2024 margin
- Toss-up / Even · D 48.6% · R 50.9%
- 2008→2024 swing
- -6.8pp toward R · 2008: 4.6pp · 2024: -2.2pp
- All cycles
- 2024: R+2.2 2020: D+1.3 2016: D+1.7 2012: D+5.5 2008: D+4.6
Not yet ingested
- Civics
- —
Market trends
- HPI YoY
- ▼ -103.16%
- Current HPI
- 241.3758
- Rent YoY
- ▲ 4.05%
- Metro
- Milledgeville, GA
- State GDP YoY
- ▲ 2.66%
- F500 in state
- 28
Industry mix (Fortune 500 HQ in GA)
| Industry | F500 HQs | Revenue |
|---|---|---|
| Paper / Packaging | 2 | $29B |
|
||
| Retail | 1 | $160B |
|
||
| Transportation / Logistics | 1 | $91B |
|
||
| Airlines | 1 | $62B |
|
||
| Consumer Goods | 1 | $47B |
|
||
| Utilities | 1 | $25B |
|
||
Price history
+116.7% since first listed2 events — show timeline
- 2026-04-30 Listed $179,900 GAMLS
- 2014-09-29 Sold (Public Records) $83,000 Public Records
Property tax history
+6.6%/yrLatest (2025): $1,811 · +45.7% YoY. Source: county tax records.
Cash-flow waterfall
monthlySold comps — $/sqft
last 12 mo · ≤1 miLoading sold comps…