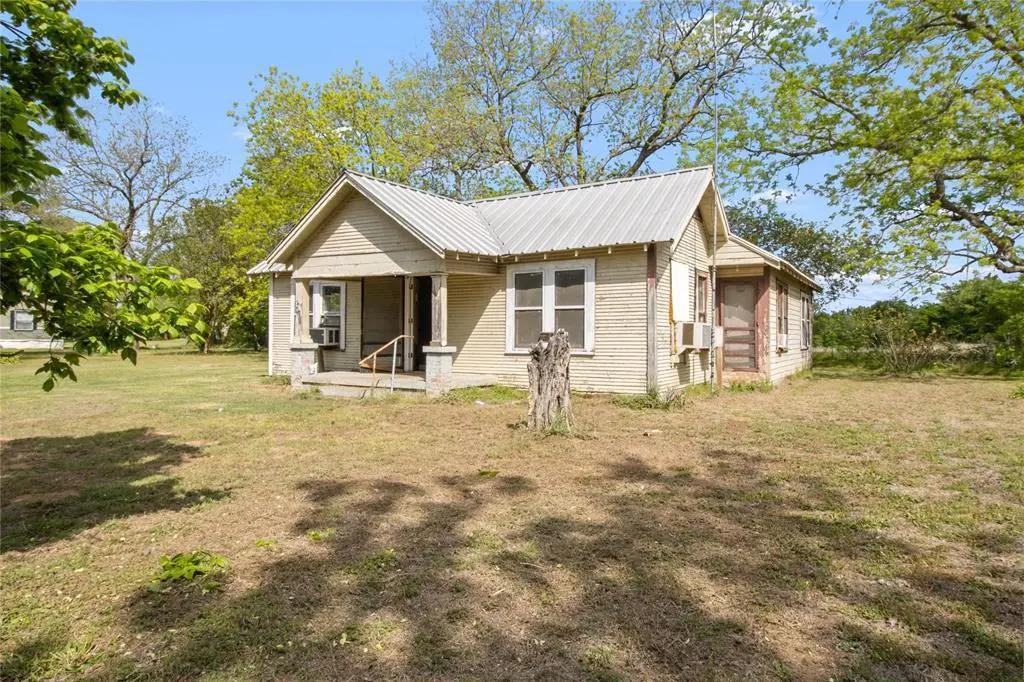
400 W Front St · Trinidad, TX
Flood risk No data
- FEMA flood zone
- —
- Chance of flooding over 30 yrs
- —
- Est. flood insurance / yr
- —
Fire risk No data
- Est. fire insurance / yr
- —
Heat risk No data
- Hot days now (above threshold)
- —
- Hot days in 30 yrs
- —
Wind risk No data
- Chance of severe wind over 30 yrs
- —
Air-quality risk No data
- Unhealthy air days now
- —
- Unhealthy air days in 30 yrs
- —
Risk factors via First Street. Map © Google.
Why this score? — see what drove the B grade
The composite is a weighted blend of 9 inputs, each scored 0–100. Each bar is that input's sub-score; the figure is the points it added to the 100-point composite (weight × sub-score).
- Cash flow +30.0/30.0
- 1% rule +10.0/10.0
- DSCR +10.0/10.0
- ARV discount +7.5/15.0
- Appreciation +5.5/10.0
- Schools +3.7/10.0
- Livability +2.9/5.0
- Rent growth +2.5/5.0
- Condition / age +2.2/5.0
$65,000
🖨 Deal sheet 📄 Offer letter ✓ Due diligence
Listing remarks MLS
Looking for your next investment property? This home offers a great opportunity for investors, or buyers looking to create their own space. The home does need some work, making it ideal for those wanting to add value or customize to their liking. Mini split system is already in place, providing efficient heating and cooling. Enjoy getting away from the hustle and bustle while still being within reach of nearby amenities, and take advantage of a nearby creek for fishing and relaxing. Nestled in quiet small town setting, this property offers both potential and a peaceful lifestyle. Don't miss this opportunity to bring your vision to life. Schedule your showing today!
Key facts
- 0.26 acre lot
- Parking
- Built 1987
Neighborhood map
What this means for you Summary
Snapshot
- This is a 2-bed/1.0-bath single-family listed at $65k. Condition is rated fair.
Deal economics
- At list price, monthly cash flow is $663 ($8k/yr) — positive.
- The deal already cash-flows at list — no discount required.
- Meets the 1% rule at list price ($1k rent vs $65k).
- Recommended offer: $63k (3.0% below list) — sets the bar for market timing.
- Cap rate 18.5% vs local median 2.5% in Trinidad — top-decile yield for the area; either an underpriced asset or a hidden risk that comps aren't pricing in. Stress-test before assuming the spread holds.
Location & tenants
- Location reads 57/100 on livability (#1,274 in TX) — a working-class tenant base; expect higher turnover. Strengths: cost of living A+, housing A+; Watch: schools F, crime F, amenities F.
- Trinidad ISD (rural): math 40% / reading 45% proficiency, ranked #684 of 1,141 in TX (top 60%) — families likely to look elsewhere, expect single-tenant / working-renter base with shorter leases.
- Market conditions: 162 active listings in the ZIP; 263 units permitted in Henderson County in 2024 (0 in 5+ unit buildings).
Forward outlook
- In year one you build about $1k of equity ($449 loan paydown + $672 appreciation (1.0% local appreciation)).
- At projected returns (1.0% appreciation + 3.0% rent growth), your $18k cash investment doubles in ~2 years — after that, you're playing with house money.
Negotiation context
- It's been on market 54 days — a 3% lower offer ($63k) is reasonable based on typical stale-listing flexibility.
- 2 sale attempts since 3y ago; this cycle's ask has dropped $55k (46%) from the opening price — seller is motivated, your offer sets the floor, not the list.
Questions for the listing agent
- It's been on market 54 days. Have you received any prior offers? Is the seller open to a 3% concession, seller financing, or rate buy-down credit?
- Have any recent inspections been done? Can we get a copy of the seller's disclosures and any deferred-maintenance estimates?
- Is there a deadline driving the sale (1031 exchange, divorce, estate, relocation)? That informs how much negotiation room exists.
- Schools are F-rated, which usually means shorter tenancies and higher turnover. Who's the typical renter profile here, and what's been the actual vacancy rate?
- Crime grade is F in this area — have there been break-ins, vandalism, or insurance claims at this property in the last 3 years? What carrier currently insures it and at what premium?
- What's the average days-on-market for RENTAL listings here right now (not sales)? A rising rental-DOM trend means longer vacancies and softer asking-rent achievability than the comps imply.
- What's the recent tenant-quality profile in this submarket — average credit score on applications, eviction rate, late-payment / NSF rate, and stable-employment percentage? A property-management company in the area should have these aggregated.
- How much new for-sale + rental construction is in the pipeline within 1–3 miles? Heavy new supply typically softens prices + rents 12–24 months out; constrained supply supports both.
Investment metrics
- 1% rule
- 2.17% ✓
- Cap rate
- 18.53%
- Cash-on-cash
- 43.70%
- DSCR
- 2.94
- GRM
- 3.8
CMA / ARV
- ARV (median comp)
- $135,594
- List price
- $65,000
- Delta
- -52.06%
- Verdict
- UNDERPRICED
- Comps
- 6 within 1.0 mi
Projected returns pro-forma
1.03% appreciation · 3.0% rent growth · sell at horizon
- IRR
- 46.4%
- Equity multiple
- 3.39×
- Total profit
- $43,556
- Equity at exit
- $22,307
- IRR
- 48.1%
- Equity multiple
- 6.75×
- Total profit
- $104,708
- Equity at exit
- $29,734
Cash invested: $18,200 (down + closing). Projections, not guarantees.
Landlord ↔ Tenant lean methodology
- Overall (STATE)
- 87 Strongly Landlord-Friendly
- State Texas
- 87 Strongly Landlord-Friendly · R+5
- County
- — inherits STATE
- City
- — inherits STATE
ZIP-level market 75163
- Home prices YoY
- 0.5%
- Active inventory
- 162
- Price-to-rent
- 3.8×
Monthly cashflow live
- Estimated rent
- $1,408 medium interval (Pro) →
- Mortgage (P&I)
- −$341
- Tax est. 1.5%
- −$81 /mo · $975/yr
- Insurance
- −$27
- HOA
- −$0
- Vacancy / Maint / Mgmt
- −$296
- Net cashflow
- $663
Break-even live
UW: 25.0% down · 7.5% · 30yr · 1.5% tax · 5.0% vac · 8.0% maint · 8.0% mgmt
Financing live
Cash to close
- Down payment
- $16,250
- Closing costs
- $1,950
- Reserves months
- —
- Total cash needed
- —
Loan-product check · same deal, 3 products live
Conventional
25% down · 7.5% · 30yr
- Down + closing
- —
- Monthly P&I
- —
- Monthly cashflow
- —
- DSCR
- —
- Eligible?
- —
Personal DTI + credit; lowest rate.
DSCR
20% down · 8.5% · 30yr
- Down + closing
- —
- Monthly P&I
- —
- Monthly cashflow
- —
- DSCR
- —
- Eligible?
- —
No personal income docs; deal must DSCR.
Hard money
10% down · 12.0% · 12mo
- Down + closing
- —
- Monthly P&I
- —
- Monthly cashflow
- —
- DSCR
- —
- Eligible?
- —
Short-term bridge; refi at stabilization.
Listing history 9 events
-
2026-06-03days on market $65,000 Active 54 DOM
-
2026-06-02days on market $65,000 Active 53 DOM
-
2026-06-01days on market $65,000 Active 52 DOM
-
2026-05-31days on market $65,000 Active 51 DOM
-
2026-05-14price $65,000 679-char remark
Show marketing remark (679 chars)
Looking for your next investment property? This home offers a great opportunity for investors, or buyers looking to create their own space. The home does need some work, making it ideal for those wanting to add value or customize to their liking. Mini split system is already in place, providing efficient heating and cooling. Enjoy getting away from the hustle and bustle while still being within reach of nearby amenities, and take advantage of a nearby creek for fishing and relaxing. Nestled in quiet small town setting, this property offers both potential and a peaceful lifestyle. Don't miss this opportunity to bring your vision to life. Schedule your showing today!
-
2026-05-01price $110,000 679-char remark
Show marketing remark (679 chars)
Looking for your next investment property? This home offers a great opportunity for investors, or buyers looking to create their own space. The home does need some work, making it ideal for those wanting to add value or customize to their liking. Mini split system is already in place, providing efficient heating and cooling. Enjoy getting away from the hustle and bustle while still being within reach of nearby amenities, and take advantage of a nearby creek for fishing and relaxing. Nestled in quiet small town setting, this property offers both potential and a peaceful lifestyle. Don't miss this opportunity to bring your vision to life. Schedule your showing today!
-
2026-04-08$120,000 Active 679-char remark
Show marketing remark (679 chars)
Looking for your next investment property? This home offers a great opportunity for investors, or buyers looking to create their own space. The home does need some work, making it ideal for those wanting to add value or customize to their liking. Mini split system is already in place, providing efficient heating and cooling. Enjoy getting away from the hustle and bustle while still being within reach of nearby amenities, and take advantage of a nearby creek for fishing and relaxing. Nestled in quiet small town setting, this property offers both potential and a peaceful lifestyle. Don't miss this opportunity to bring your vision to life. Schedule your showing today!
-
2023-05-08historical
-
2023-01-10$79,950 Active
ⓘ Source: listings_history table (triggers on properties + properties_extension) + one-shot
backfill from property_details.listing_events for pre-trigger history.
Nearby sold comps map
Loading sold comps map…
Walkable amenities ~0.75 mi
Loading nearby amenities…
Taxation est. · year 1
- Rental income
- $16,890
- − Mortgage interest
- −$3,641
- − Property taxes
- −$975
- − Insurance
- −$325
- − Repairs & maintenance
- −$1,351
- − Management
- −$1,351
- − Depreciation
- −$1,891
- Taxable income
- $7,356
- Est. tax owed @ 24.0%
- −$1,765
- After-tax cash flow
- $6,187/yr
For passive investors: Depreciation is non-cash, so a rental often shows a tax loss while cash-flowing — sheltering income. Rental losses are passive: they offset passive income freely, and up to $25,000/yr can offset ordinary (W-2) income if you actively participate and your MAGI is under $100k (phasing out to $0 by $150k); unused losses carry forward. On sale, claimed depreciation is recaptured at up to 25%, and gains may owe capital-gains tax (a 1031 exchange can defer both). Figures are a year-1 estimate at your 24.0% rate — not tax advice; consult a CPA.
Condition & rehab AI · 12 photos
This property requires moderate renovations to improve its condition and increase its value. The exterior siding, flooring, and interior walls are in poor condition and need significant work. Landscaping and yard work are also needed to enhance curb appeal. Renovations in the kitchen and bathrooms would further increase its value.
Repairs flagged
- Major Exterior siding — Significant wear and tear
- Major Flooring — Worn and in need of replacement
- Major Interior walls — Peeling paint and exposed drywall
- Major Bathrooms — Old fixtures and worn flooring
- Major Kitchen — Exposed framing and missing cabinets
- Major Landscaping — Overgrown vegetation and unkempt lawn
Value-add opportunities
- Both Painting and repainting — Enhances curb appeal and interior aesthetics
- Both Landscaping and yard work — Improves curb appeal and enhances property value
- Both Flooring replacement — Enhances interior aesthetics and comfort
- Both Kitchen renovation — Enhances functionality and aesthetics
- Both Bathroom renovation — Enhances functionality and aesthetics
Renovation cost estimate screening
| Repair item | Severity | Est. cost |
|---|---|---|
| Exterior siding · Significant wear and tear | Major | $15,000–50,000 |
| Flooring · Worn and in need of replacement | Major | $15,000–50,000 |
| Interior walls · Peeling paint and exposed drywall | Major | $15,000–50,000 |
| Bathrooms · Old fixtures and worn flooring | Major | $15,000–50,000 |
| Kitchen · Exposed framing and missing cabinets | Major | $15,000–50,000 |
| Landscaping · Overgrown vegetation and unkempt lawn | Major | $15,000–50,000 |
| Total estimated repair cost · 6 items | $90,000–300,000 |
Value-add ROI direction
- Both Painting and repainting — Enhances curb appeal and interior aesthetics ↑
- Both Landscaping and yard work — Improves curb appeal and enhances property value ↑
- Both Flooring replacement — Enhances interior aesthetics and comfort ↑
- Both Kitchen renovation — Enhances functionality and aesthetics ↑
- Both Bathroom renovation — Enhances functionality and aesthetics ↑
ⓘ Cost ranges are severity-bucket heuristics (US national rule-of-thumb). Get contractor quotes + a written scope before underwriting a rehab budget.
Schools (NCES district)
- District
- Trinidad ISD
- NCES district ID
- 4843170
- Math proficiency
- 40% ▬ 0.00%
- Reading proficiency
- 45% ▲ 5.00%
- Median HH income
- $33,339
- Composite
- 37.29/100
- National rank
- #8962
- State rank
- #684 of 1141 in TX
Livability — Trinidad
- Score
- 57/100
- State rank
- #1274
- US rank
- #22143
Category grades
Schools grade is shown separately in the Schools card above.
Census & demographics
- Census place
- Trinidad, TX
- City population
- 2,569
- Population (ZIP)
- 2,569
Population outlook (Henderson County) Hauer SSP2
- Today (2025)
- 80,471 people
- By 2030
- 80,608 · +0.2%
- By 2040
- 80,087 · -0.5%
- By 2050
- 78,208 · -2.8%
- By 2075
- 72,423 · -10.0%
- By 2100
- 61,012 · -24.2%
Race, ethnicity, and origin ACS 2023
- Neighborhood character
- Predominantly White (77%)
- Race & ethnicity
- White 77% Two or more races 11% Hispanic / Latino 9% Black 6%
- Hispanic origin (detail)
- Mexican 8%
- Common ancestry
- Serbian 3% Lithuanian 1% European 1%
- Foreign-born
- 7% · Canada, Jamaica
- Languages at home
- 84% English-only · Arabic 10% Spanish 6%
Political lean MEDSL · Henderson
- 2024 margin
- Solid R (+63.5) · D 18.0% · R 81.4%
- 2008→2024 swing
- -18.8pp toward R · 2008: -44.6pp · 2024: -63.5pp
- All cycles
- 2024: R+63.5 2020: R+60.2 2016: R+60.0 2012: R+54.8 2008: R+44.6
Not yet ingested
- Civics
- —
Market trends
- HPI YoY
- ▲ 1.03%
- Current HPI
- 211.6125
- Rent YoY
- —
- Metro
- —
- State GDP YoY
- ▲ 3.95%
- F500 in state
- 110
Industry mix (Fortune 500 HQ in TX)
| Industry | F500 HQs | Revenue |
|---|---|---|
| Energy | 16 | $1,198B |
|
||
| Technology | 5 | $198B |
|
||
| Engineering / Construction | 4 | $72B |
|
||
| Energy Services | 3 | $60B |
|
||
| Utilities | 3 | $41B |
|
||
| Healthcare | 2 | $330B |
|
||
Price history
-18.7% since first listed5 events — show timeline
- 2026-05-14 Price Changed $65,000 NTREIS
- 2026-05-01 Price Changed $110,000 NTREIS
- 2026-04-08 Listed $120,000 NTREIS
- 2023-05-08 Listing Removed — NTREIS
- 2023-01-10 Listed $79,950 NTREIS
Cash-flow waterfall
monthlySold comps — $/sqft
last 12 mo · ≤1 miLoading sold comps…