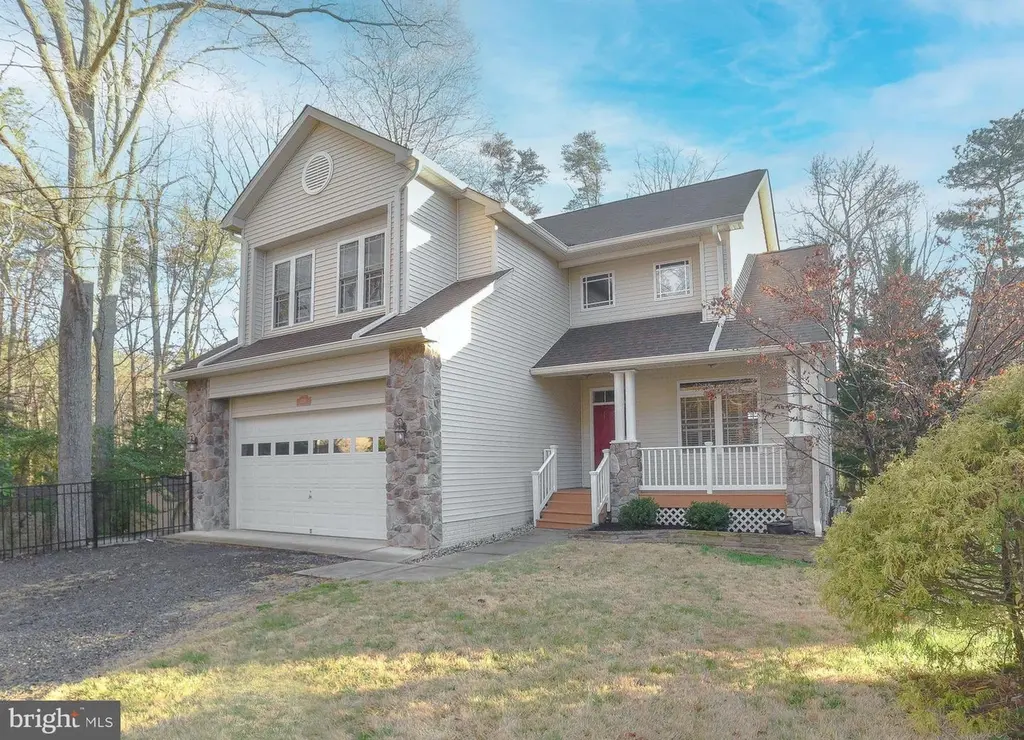
13536 Osprey Ln · Solomons, MD
Flood risk No data
- FEMA flood zone
- —
- Chance of flooding over 30 yrs
- —
- Est. flood insurance / yr
- —
Fire risk No data
- Est. fire insurance / yr
- —
Heat risk No data
- Hot days now (above threshold)
- —
- Hot days in 30 yrs
- —
Wind risk No data
- Chance of severe wind over 30 yrs
- —
Air-quality risk No data
- Unhealthy air days now
- —
- Unhealthy air days in 30 yrs
- —
Risk factors via First Street. Map © Google.
Why this score? — see what drove the B- grade
The composite is a weighted blend of 9 inputs, each scored 0–100. Each bar is that input's sub-score; the figure is the points it added to the 100-point composite (weight × sub-score).
- Cash flow +30.0/30.0
- 1% rule +10.0/10.0
- DSCR +10.0/10.0
- Appreciation +5.1/10.0
- Schools +3.3/10.0
- Livability +3.3/5.0
- Rent growth +2.5/5.0
- Condition / age +2.5/5.0
- ARV discount +1.8/15.0
$775,000
🖨 Deal sheet 📄 Offer letter ✓ Due diligence
Listing remarks
Osprey Cove is located on beautiful and protected St. John Creek. This lovely 2 story home on a finished basement has private access to pier and boatlift right from your back yard. MLW is 3'+ and 3,000lb boat lift conveys. Enjoy leisurely boat trips to Solomons Island restaurants and shops that are mere minutes away or zip around on your jetski(s). Home is 5BR with 3 Full bathrooms and has a semi-open layout on the main level with kitchen, living room w/ gas fireplace, and dining area. Granite counters and island with 2nd sink, gas range and all stainless steel appliances make the kitchen the perfect place to hang out, entertain and be the heart of your home. Additional rooms include a form
Key facts
- Boatlift
- Finished basement
- Waterfront access
Tags
Property features AI
Finance
- HOA & community: HOA dues $100 annually
Exterior
- Parking: Has garage
- Home design: Single family home; Built in 2002
- Exterior features: Waterfront lot; Has view
Interior
- Bedrooms: 5 bedrooms
- Bathrooms: 3 bathrooms
- Interior features: Waterview
Neighborhood map
What this means for you Summary
Snapshot
- This is a 5-bed/3.0-bath single-family listed at $775k.
Deal economics
- At list price, monthly cash flow is $5k ($65k/yr) — positive.
- The deal already cash-flows at list — no discount required.
- Meets the 1% rule at list price ($14k rent vs $775k).
- Cap rate 14.7% vs local median 2.3% in Solomons — top-decile yield for the area; either an underpriced asset or a hidden risk that comps aren't pricing in. Stress-test before assuming the spread holds.
Location & tenants
- Location reads 66/100 on livability (#230 in MD) — a middle-class / working-renter tenant base. Strengths: crime A+, employment A+, health & safety A+; Watch: schools D, amenities F, commute F.
- Calvert County Public Schools (rural): math 23% / reading 44% proficiency, ranked #5 of 24 in MD (top 21%) — families likely to look elsewhere, expect single-tenant / working-renter base with shorter leases; only 19% free/reduced lunch — higher-income household profile.
- Market conditions: 25 active listings in the ZIP; 1 comparable units currently listed for rent nearby; 101 units permitted in Calvert County in 2024 (0 in 5+ unit buildings).
Forward outlook
- In year one you build about $7k of equity ($5k loan paydown + $1k appreciation (0.2% local appreciation)).
- At projected returns (0.2% appreciation + 3.0% rent growth), your $217k cash investment doubles in ~3 years — after that, you're playing with house money.
- By year 6, paydown + projected appreciation supports a ~$45k cash-out refi (75% LTV) — recoverable capital for the next deal without selling this one.
Negotiation context
- Only 2 days on market — expect competitive offers; lowballing is unlikely to land.
Questions for the listing agent
- What does the HOA fee cover, when was the last increase, and are there any pending special assessments or reserve-fund shortfalls?
- Is there a deadline driving the sale (1031 exchange, divorce, estate, relocation)? That informs how much negotiation room exists.
- Schools are D-rated, which usually means shorter tenancies and higher turnover. Who's the typical renter profile here, and what's been the actual vacancy rate?
- What's the average days-on-market for RENTAL listings here right now (not sales)? A rising rental-DOM trend means longer vacancies and softer asking-rent achievability than the comps imply.
- What's the recent tenant-quality profile in this submarket — average credit score on applications, eviction rate, late-payment / NSF rate, and stable-employment percentage? A property-management company in the area should have these aggregated.
- How much new for-sale + rental construction is in the pipeline within 1–3 miles? Heavy new supply typically softens prices + rents 12–24 months out; constrained supply supports both.
Investment metrics
- 1% rule
- 1.76% ✓
- Cap rate
- 14.69%
- Cash-on-cash
- 29.97%
- DSCR
- 2.33
- GRM
- 4.7
CMA / ARV
- ARV (on-the-fly)
- $687,582
- Comps found
- 5
Show comp detail 5 sales within ~0.75 mi
| Address | Dist | Beds/Ba | Sqft | Sold | Price | $/sf | Match |
|---|---|---|---|---|---|---|---|
| 400 Shipyard | 0.38mi | 5/4.0 | 3,699 (+2%) | 5mo | $700,000 | $189 | 71 |
| 30 Bean Rd | 0.42mi | 5/4.0 | 3,928 (+8%) | 20mo | $1,504,000 | $383 | 46 |
| 186 Bamboushay Ln | 0.50mi | 4/3.5 (-1) | 3,150 (-13%) | 13mo | $590,000 | $187 | 37 |
| 13478 Lore Pines Ln | 0.41mi | 4/3.5 (-1) | 4,163 (+14%) | 21mo | $925,000 | $222 | 32 |
| 13406 Lore Pines Ln | 0.46mi | 4/3.5 (-1) | 4,182 (+15%) | 24mo | $550,000 | $132 | 27 |
Match score weights: distance 35% · size 25% · config 20% · recency 20%. Top-matched comps best support the ARV.
Projected returns pro-forma
0.16% appreciation · 3.0% rent growth · sell at horizon
- IRR
- 30.8%
- Equity multiple
- 2.51×
- Total profit
- $328,544
- Equity at exit
- $231,178
- IRR
- 34.2%
- Equity multiple
- 4.87×
- Total profit
- $839,724
- Equity at exit
- $282,837
Cash invested: $217,000 (down + closing). Projections, not guarantees.
Landlord ↔ Tenant lean methodology
- Overall (STATE)
- 27 Tenant-Leaning
- State Maryland
- 27 Tenant-Leaning · D+14
- County
- — inherits STATE
- City
- — inherits STATE
ZIP-level market 20688
- Home prices YoY
- 0.1%
- Active inventory
- 25
- Price-to-rent
- 4.7×
Monthly cashflow live
- Estimated rent
- $13,651 medium interval (Pro) →
- Mortgage (P&I)
- −$4,064
- Tax est. 1.5%
- −$969 /mo · $11,625/yr
- Insurance
- −$323
- HOA
- −$8
- Vacancy / Maint / Mgmt
- −$2,867
- Net cashflow
- $5,420
Break-even live
UW: 25.0% down · 7.5% · 30yr · 1.5% tax · 5.0% vac · 8.0% maint · 8.0% mgmt
Financing live
Cash to close
- Down payment
- $193,750
- Closing costs
- $23,250
- Reserves months
- —
- Total cash needed
- —
Loan-product check · same deal, 3 products live
Conventional
25% down · 7.5% · 30yr
- Down + closing
- —
- Monthly P&I
- —
- Monthly cashflow
- —
- DSCR
- —
- Eligible?
- —
Personal DTI + credit; lowest rate.
DSCR
20% down · 8.5% · 30yr
- Down + closing
- —
- Monthly P&I
- —
- Monthly cashflow
- —
- DSCR
- —
- Eligible?
- —
No personal income docs; deal must DSCR.
Hard money
10% down · 12.0% · 12mo
- Down + closing
- —
- Monthly P&I
- —
- Monthly cashflow
- —
- DSCR
- —
- Eligible?
- —
Short-term bridge; refi at stabilization.
Rent comps 1 comps
| Address | Beds | Baths | Sqft | Rent | $/sqft | DOM | Units | Dist |
|---|---|---|---|---|---|---|---|---|
| 14386 Calvert St Unit 1363916P Solomons, MD | 6.0 | 3.5 | 2992 | $13,651 | $4.56 | 22d | 1 | 1.25mi |
HOA detail
- Monthly dues
- $8 · $96/yr
- Likely covers
- gas
Listing history 13 events
-
2026-06-18days on market $775,000 Active 2 DOM
-
2026-06-17statusdays on market $775,000 Active 1 DOM
-
2026-06-16days on market $775,000 Coming Soon 18 DOM
-
2026-06-15days on market $775,000 Coming Soon 17 DOM
-
2026-06-13days on market $775,000 Coming Soon 15 DOM
-
2026-06-09days on market $775,000 Coming Soon 11 DOM
-
2026-06-08days on market $775,000 Coming Soon 10 DOM
-
2026-06-07days on market $775,000 Coming Soon 9 DOM
-
2026-06-04days on market $775,000 Coming Soon 6 DOM
-
2026-06-03days on market $775,000 Coming Soon 5 DOM
-
2026-06-02days on market $775,000 Coming Soon 4 DOM
-
2026-06-01days on market $775,000 Coming Soon 3 DOM
-
2026-05-31days on market $775,000 Coming Soon 2 DOM
ⓘ Source: listings_history table (triggers on properties + properties_extension) + one-shot
backfill from property_details.listing_events for pre-trigger history.
Nearby sold comps map
Loading sold comps map…
Walkable amenities ~0.75 mi
Loading nearby amenities…
Taxation est. · year 1
- Rental income
- $163,812
- − Mortgage interest
- −$43,412
- − Property taxes
- −$11,625
- − Insurance
- −$3,875
- − Repairs & maintenance
- −$13,105
- − Management
- −$13,105
- − HOA
- −$96
- − Depreciation
- −$22,545
- Taxable income
- $56,049
- Est. tax owed @ 24.0%
- −$13,452
- After-tax cash flow
- $51,594/yr
For passive investors: Depreciation is non-cash, so a rental often shows a tax loss while cash-flowing — sheltering income. Rental losses are passive: they offset passive income freely, and up to $25,000/yr can offset ordinary (W-2) income if you actively participate and your MAGI is under $100k (phasing out to $0 by $150k); unused losses carry forward. On sale, claimed depreciation is recaptured at up to 25%, and gains may owe capital-gains tax (a 1031 exchange can defer both). Figures are a year-1 estimate at your 24.0% rate — not tax advice; consult a CPA.
Schools (NCES district)
- District
- Calvert County Public Schools
- NCES district ID
- 2400150
- Math proficiency
- 23% ▼ -29.00%
- Reading proficiency
- 44% ▼ -15.00%
- Median HH income
- $94,392
- Composite
- 33.27/100
- National rank
- #5511
- State rank
- #5 of 24 in MD
Livability — Solomons
- Score
- 66/100
- State rank
- #230
- US rank
- #11440
Category grades
Schools grade is shown separately in the Schools card above.
Census & demographics
- Census place
- Solomons, MD
- City population
- 2,180
- Population (ZIP)
- 1,113
Population outlook (Calvert County) Hauer SSP2
- Today (2025)
- 94,825 people
- By 2030
- 96,197 · +1.4%
- By 2040
- 96,954 · +2.2%
- By 2050
- 94,628 · -0.2%
- By 2075
- 91,576 · -3.4%
- By 2100
- 83,431 · -12.0%
Race, ethnicity, and origin ACS 2023
- Neighborhood character
- Predominantly White (97%)
- Race & ethnicity
- White 97% Two or more races 2% Hispanic / Latino 2%
- Common ancestry
- Serbian 5% Russian 3% Slovak 2%
- Foreign-born
- 2% · Canada
Political lean MEDSL · Calvert
- 2024 margin
- R (+11.0) · D 43.5% · R 54.5% · Other 2.0%
- 2008→2024 swing
- -4.6pp toward R · 2008: -6.3pp · 2024: -11.0pp
- All cycles
- 2024: R+11.0 2020: R+5.6 2016: R+18.4 2012: R+8.2 2008: R+6.3
Not yet ingested
- Civics
- —
Market trends
- HPI YoY
- ▲ 0.16%
- Current HPI
- 232.1799
- Rent YoY
- —
- Metro
- —
- State GDP YoY
- ▲ 2.97%
- F500 in state
- 12
Industry mix (Fortune 500 HQ in MD)
| Industry | F500 HQs | Revenue |
|---|---|---|
| Aerospace / Defense | 1 | $71B |
|
||
| Utilities | 1 | $25B |
|
||
| Hotels | 1 | $24B |
|
||
| Consumer Goods | 1 | $7B |
|
||
| Real Estate | 1 | $6B |
|
||
| Chemicals | 1 | $2B |
|
||
Cash-flow waterfall
monthlySold comps — $/sqft
last 12 mo · ≤1 miLoading sold comps…