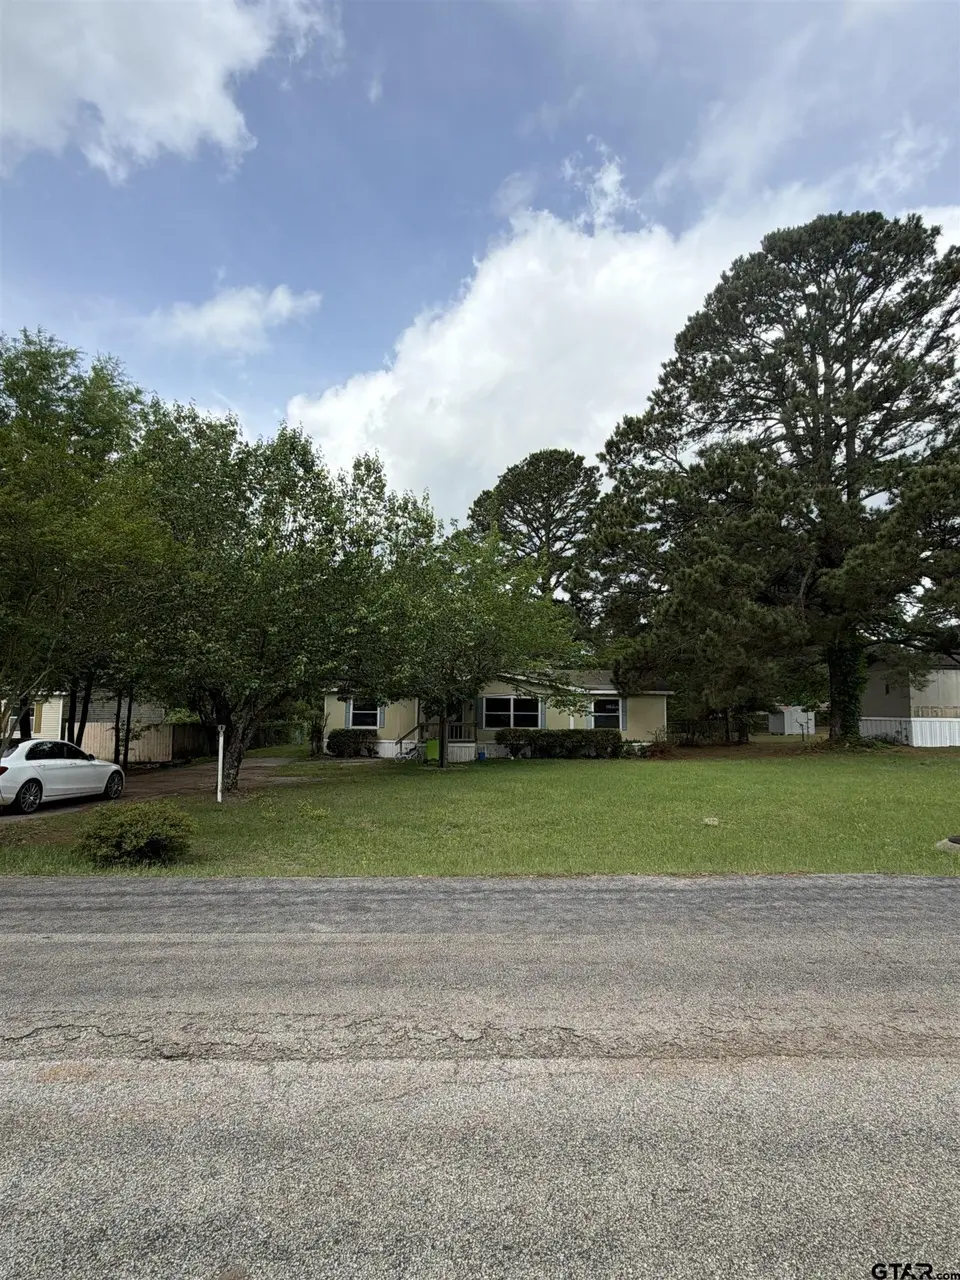
10723 Littlefield Dr · Tyler, TX
Flood risk 1/10 · Minimal
- FEMA flood zone
- X (unshaded)
- Chance of flooding over 30 yrs
- 0.0%
- Est. flood insurance / yr
- $507 – $1,088
Fire risk 5/10 · Moderate
- Est. fire insurance / yr
- $1,222 – $2,270
Heat risk 7/10 · Major
- Hot days now (above 109°F)
- 7 days/yr
- Hot days in 30 yrs
- 26 days/yr
Wind risk 6/10 · Moderate
- Chance of severe wind over 30 yrs
- 56.0%
Air-quality risk 2/10 · Minimal
- Unhealthy air days now
- 0 days/yr
- Unhealthy air days in 30 yrs
- 1 days/yr
Risk factors via First Street. Map © Google.
Why this score? — see what drove the C- grade
The composite is a weighted blend of 9 inputs, each scored 0–100. Each bar is that input's sub-score; the figure is the points it added to the 100-point composite (weight × sub-score).
- Cash flow +17.6/30.0
- ARV discount +7.5/15.0
- Appreciation +7.5/10.0
- DSCR +5.5/10.0
- 1% rule +4.5/10.0
- Livability +3.8/5.0
- Schools +2.9/10.0
- Rent growth +2.5/5.0
- Condition / age +2.5/5.0
$135,000
🖨 Deal sheet 📄 Offer letter ✓ Due diligence
Listing remarks MLS
Welcome to 10723 Littlefield In Tyler TX. 3 Bed, 2 Bath Double Wide Home in Tyler, TX Move-in ready and full of potential, this charming 3-bedroom, 2 bath double wide home offers the perfect blank canvas to make it your own. Situated on a generous half-acre lot, there’s plenty of space to enjoy outdoor living, entertain family and friends, or create your ideal backyard retreat. Whether you’re looking to start a family or simply want room to relax and host gatherings, this property delivers both comfort and opportunity. Priced to sell, it won’t last long. Call or text today for more information or to schedule your private showing. SELLING AS IS.
Key facts
- Half-acre lot
- Backyard retreat
- Outdoor living
Tags
Neighborhood map
What this means for you Summary
Snapshot
- This is a 3-bed/2.0-bath manufactured listed at $135k.
Deal economics
- At list price, monthly cash flow is $107 ($1k/yr) — positive.
- The deal already cash-flows at list — no discount required.
- To meet the 1% rule (rent ≥ 1% of price), the offer needs to be $128k (5.3% below list).
- Recommended offer: $127k (6.0% below list) — sets the bar for market timing.
- Cap rate 7.2% vs local median 3.6% in Tyler — top-decile yield for the area; either an underpriced asset or a hidden risk that comps aren't pricing in. Stress-test before assuming the spread holds.
Location & tenants
- Location reads 75/100 on livability (#147 in TX, #4,181 nationally) — a middle-class / working-renter tenant base. Strengths: cost of living A+, housing A+, health & safety A+; Watch: employment C-, schools D+, crime D+.
- Winona ISD (rural): math 32% / reading 35% proficiency, ranked #539 of 826 in TX (top 65%) — families likely to look elsewhere, expect single-tenant / working-renter base with shorter leases.
- Market conditions: 67 active listings in the ZIP; 3 comparable units currently listed for rent nearby; rentals leasing fast (median 14d on market — plan ~1-2 weeks tenant-placement turnaround); 595 units permitted in Smith County in 2024 (45 in 5+ unit buildings).
Forward outlook
- In year one you build about $8k of equity ($933 loan paydown + $7k appreciation (5.0% local appreciation)).
- Smith County population projected at +24% by 2050 — long-run rental-demand tailwind backs the buy-and-hold thesis.
- At projected returns (5.0% appreciation + 3.0% rent growth), your $38k cash investment doubles in ~4 years — after that, you're playing with house money.
- By year 5, paydown + projected appreciation supports a ~$33k cash-out refi (75% LTV) — recoverable capital for the next deal without selling this one.
Negotiation context
- It's been on market 64 days — a 6% lower offer ($127k) is reasonable based on typical stale-listing flexibility.
Risks & watch-outs
- Climate carrying-cost: major wind risk, 56% chance of damaging wind over 30y; moderate wildfire risk; extreme-heat days projected 7→26/yr by 2055 (HVAC capex compounding) — expect insurance premiums to compound above CPI over the hold.
Questions for the listing agent
- It's been on market 64 days. Have you received any prior offers? Is the seller open to a 6% concession, seller financing, or rate buy-down credit?
- Why hasn't it sold? Are there any deal-killer items the seller is aware of (foundation, flood, title, zoning, code violations)?
- Is there a deadline driving the sale (1031 exchange, divorce, estate, relocation)? That informs how much negotiation room exists.
- Schools are D-rated, which usually means shorter tenancies and higher turnover. Who's the typical renter profile here, and what's been the actual vacancy rate?
- Crime grade is D in this area — have there been break-ins, vandalism, or insurance claims at this property in the last 3 years? What carrier currently insures it and at what premium?
- What's the average days-on-market for RENTAL listings here right now (not sales)? A rising rental-DOM trend means longer vacancies and softer asking-rent achievability than the comps imply.
- What's the recent tenant-quality profile in this submarket — average credit score on applications, eviction rate, late-payment / NSF rate, and stable-employment percentage? A property-management company in the area should have these aggregated.
- How much new for-sale + rental construction is in the pipeline within 1–3 miles? Heavy new supply typically softens prices + rents 12–24 months out; constrained supply supports both.
Investment metrics
- 1% rule
- 0.95% ✗
- Cap rate
- 7.25%
- Cash-on-cash
- 3.40%
- DSCR
- 1.15
- GRM
- 8.8
CMA / ARV
No comps found within radius.
Projected returns pro-forma
4.96% appreciation · 3.0% rent growth · sell at horizon
- IRR
- 15.7%
- Equity multiple
- 2.00×
- Total profit
- $37,669
- Equity at exit
- $76,211
- IRR
- 16.2%
- Equity multiple
- 3.86×
- Total profit
- $108,129
- Equity at exit
- $131,289
Cash invested: $37,800 (down + closing). Projections, not guarantees.
Landlord ↔ Tenant lean methodology
- Overall (STATE)
- 87 Strongly Landlord-Friendly
- State Texas
- 87 Strongly Landlord-Friendly · R+5
- County
- — inherits STATE
- City
- — inherits STATE
ZIP-level market 75708
- Home prices YoY
- 2.4%
- Active inventory
- 67
- Price-to-rent
- 8.8×
Monthly cashflow live
- Estimated rent
- $1,278 medium interval (Pro) →
- Mortgage (P&I)
- −$708
- Tax from tax record
- −$138 /mo · $1,661/yr
- Insurance
- −$56
- HOA
- −$0
- Vacancy / Maint / Mgmt
- −$268
- Net cashflow
- $107
Break-even live
UW: 25.0% down · 7.5% · 30yr · 1.5% tax · 5.0% vac · 8.0% maint · 8.0% mgmt
Financing live
Cash to close
- Down payment
- $33,750
- Closing costs
- $4,050
- Reserves months
- —
- Total cash needed
- —
Loan-product check · same deal, 3 products live
Conventional
25% down · 7.5% · 30yr
- Down + closing
- —
- Monthly P&I
- —
- Monthly cashflow
- —
- DSCR
- —
- Eligible?
- —
Personal DTI + credit; lowest rate.
DSCR
20% down · 8.5% · 30yr
- Down + closing
- —
- Monthly P&I
- —
- Monthly cashflow
- —
- DSCR
- —
- Eligible?
- —
No personal income docs; deal must DSCR.
Hard money
10% down · 12.0% · 12mo
- Down + closing
- —
- Monthly P&I
- —
- Monthly cashflow
- —
- DSCR
- —
- Eligible?
- —
Short-term bridge; refi at stabilization.
Rent comps 3 comps
| Address | Beds | Baths | Sqft | Rent | $/sqft | DOM | Units | Dist |
|---|---|---|---|---|---|---|---|---|
| 10480 Sunny Meadows Blvd Tyler, TX | 3.0 | 2.0 | 1184 | $1,228 | $1.04 | 13d | 2 | 0.57mi |
| 10230 Peterson Rd Tyler, TX | 3.0 | 2.0 | 1232 | $1,350 | $1.10 | 13d | 1 | 1.11mi |
| 11300 US Highway 271 Tyler, TX | 3.0–4.0 | 2.0 | 1360 | $1,299 | $0.96 | 43d | 1 | 1.12mi |
Listing history 24 events
-
2026-06-19days on market $135,000 Active 64 DOM
-
2026-06-18days on market $135,000 Active 63 DOM
-
2026-06-17days on market $135,000 Active 62 DOM
-
2026-06-16days on market $135,000 Active 61 DOM
-
2026-06-15days on market $135,000 Active 60 DOM
-
2026-06-14days on market $135,000 Active 58 DOM
-
2026-06-13days on market $135,000 Active 57 DOM
-
2026-06-10days on market $135,000 Active 55 DOM
-
2026-06-09days on market $135,000 Active 54 DOM
-
2026-06-08days on market $135,000 Active 53 DOM
-
2026-06-07days on market $135,000 Active 52 DOM
-
2026-06-02days on market $135,000 Active 47 DOM
-
2026-06-01days on market $135,000 Active 46 DOM
-
2026-05-31days on market $135,000 Active 45 DOM
-
2026-05-30days on market $135,000 Active 44 DOM
-
2026-04-29price $145,000 670-char remark
Show marketing remark (670 chars)
Welcome to 10723 Littlefield In Tyler TX. 3 Bed, 2 Bath Double Wide Home in Tyler, TX Move-in ready and full of potential, this charming 3-bedroom, 2 bath double wide home offers the perfect blank canvas to make it your own. Situated on a generous half-acre lot, there’s plenty of space to enjoy outdoor living, entertain family and friends, or create your ideal backyard retreat. Whether you’re looking to start a family or simply want room to relax and host gatherings, this property delivers both comfort and opportunity. Priced to sell, it won’t last long. Call or text today for more information or to schedule your private showing. SELLING AS IS.
-
2026-04-16$149,900 Active 670-char remark
Show marketing remark (670 chars)
Welcome to 10723 Littlefield In Tyler TX. 3 Bed, 2 Bath Double Wide Home in Tyler, TX Move-in ready and full of potential, this charming 3-bedroom, 2 bath double wide home offers the perfect blank canvas to make it your own. Situated on a generous half-acre lot, there’s plenty of space to enjoy outdoor living, entertain family and friends, or create your ideal backyard retreat. Whether you’re looking to start a family or simply want room to relax and host gatherings, this property delivers both comfort and opportunity. Priced to sell, it won’t last long. Call or text today for more information or to schedule your private showing. SELLING AS IS.
-
2026-02-11soldstatus
-
2020-05-20soldstatus
-
2019-05-14soldstatus
-
2012-09-18soldstatus
-
2012-09-18soldstatus
-
2012-02-03soldstatus
-
1997-07-01soldstatus
ⓘ Source: listings_history table (triggers on properties + properties_extension) + one-shot
backfill from property_details.listing_events for pre-trigger history.
Tax reassessment forecast TX · Resets to sale price
- Current annual tax
- $1,661 · $138/mo
- Projected year-2 tax
- $2,470 · $206/mo
- Expected delta
- +$810/yr (+$67/mo · 48.7%)
ⓘ Screening estimate from a state-policy table — verify with the county assessor before closing.
Climate risk First Street
- Flood 1/10 Low FEMA zone X (unshaded) · 0% chance over 30 yrs
- Wildfire 5/10 Major
- Heat 7/10 Severe 7 d/yr ≥109°F today · 26 d/yr by 30 yrs out
- Wind 6/10 Major 56% chance of damaging wind over 30 yrs
- Air quality 2/10 Low 0 unhealthy d/yr today · 1 by 30 yrs out
Nearby sold comps map
Loading sold comps map…
Walkable amenities ~0.75 mi
Loading nearby amenities…
Taxation est. · year 1
- Rental income
- $15,339
- − Mortgage interest
- −$7,562
- − Property taxes
- −$1,661
- − Insurance
- −$675
- − Repairs & maintenance
- −$1,227
- − Management
- −$1,227
- − Depreciation
- −$3,927
- Taxable loss
- −$941
- Est. tax savings @ 24.0%
- +$226
- After-tax cash flow
- $1,512/yr
For passive investors: Depreciation is non-cash, so a rental often shows a tax loss while cash-flowing — sheltering income. Rental losses are passive: they offset passive income freely, and up to $25,000/yr can offset ordinary (W-2) income if you actively participate and your MAGI is under $100k (phasing out to $0 by $150k); unused losses carry forward. On sale, claimed depreciation is recaptured at up to 25%, and gains may owe capital-gains tax (a 1031 exchange can defer both). Figures are a year-1 estimate at your 24.0% rate — not tax advice; consult a CPA.
Schools (NCES district)
- District
- Winona ISD
- NCES district ID
- 4846230
- Math proficiency
- 32% ▲ 2.00%
- Reading proficiency
- 35% ▲ 1.00%
- Median HH income
- $48,761
- Composite
- 28.98/100
- National rank
- #6624
- State rank
- #539 of 826 in TX
Livability — Tyler
- Score
- 75/100
- State rank
- #147
- US rank
- #4181
Category grades
Schools grade is shown separately in the Schools card above.
Census & demographics
- City population
- 127,842
- Population (ZIP)
- 10,001
Population outlook (Smith County) Hauer SSP2
- Today (2025)
- 248,890 people
- By 2030
- 261,665 · +5.1%
- By 2040
- 286,114 · +15.0%
- By 2050
- 308,006 · +23.8%
- By 2075
- 354,171 · +42.3%
- By 2100
- 372,828 · +49.8%
Race, ethnicity, and origin ACS 2023
- Neighborhood character
- Diverse neighborhood (Simpson 0.58)
- Race & ethnicity
- Hispanic / Latino 51% White 39% Two or more races 9% Black 9% Asian 1%
- Hispanic origin (detail)
- Mexican 49%
- Common ancestry
- Danish 1%
- Foreign-born
- 15% · Canada, Vietnam
- Languages at home
- 62% English-only · Spanish 37% Vietnamese 1%
Political lean MEDSL · Smith
- 2024 margin
- Solid R (+45.1) · D 27.0% · R 72.1%
- 2008→2024 swing
- -5.6pp toward R · 2008: -39.5pp · 2024: -45.1pp
- All cycles
- 2024: R+45.1 2020: R+39.4 2016: R+43.9 2012: R+46.9 2008: R+39.5
Not yet ingested
- Civics
- —
Market trends
- HPI YoY
- ▲ 4.96%
- Current HPI
- 216.4494
- Rent YoY
- —
- Metro
- —
- State GDP YoY
- ▲ 3.95%
- F500 in state
- 110
Industry mix (Fortune 500 HQ in TX)
| Industry | F500 HQs | Revenue |
|---|---|---|
| Energy | 16 | $1,198B |
|
||
| Technology | 5 | $198B |
|
||
| Engineering / Construction | 4 | $72B |
|
||
| Energy Services | 3 | $60B |
|
||
| Utilities | 3 | $41B |
|
||
| Healthcare | 2 | $330B |
|
||
Price history
-3.3% since first listed9 events — show timeline
- 2026-04-29 Price Changed $145,000 GTAR
- 2026-04-16 Listed $149,900 GTAR
- 2026-02-11 Sold (Public Records) — Public Records
- 2020-05-20 Sold (Public Records) — Public Records
- 2019-05-14 Sold (Public Records) — Public Records
- 2012-09-18 Sold (Public Records) — Public Records
- 2012-09-18 Sold (Public Records) — Public Records
- 2012-02-03 Sold (Public Records) — Public Records
- 1997-07-01 Sold (Public Records) — Public Records
Property tax history
+7.2%/yrLatest (2024): $1,661 · -4.1% YoY. Source: county tax records.
Cash-flow waterfall
monthlySold comps — $/sqft
last 12 mo · ≤1 miLoading sold comps…