906 S Mississippi St · Amarillo, TX
Flood risk 1/10 · Minimal
- FEMA flood zone
- X (unshaded)
- Chance of flooding over 30 yrs
- 0.0%
- Est. flood insurance / yr
- $507 – $1,088
Fire risk 4/10 · Minor
- Est. fire insurance / yr
- $1,222 – $2,270
Heat risk 4/10 · Minor
- Hot days now (above 97°F)
- 7 days/yr
- Hot days in 30 yrs
- 18 days/yr
Wind risk 2/10 · Minimal
- Chance of severe wind over 30 yrs
- —
Air-quality risk 2/10 · Minimal
- Unhealthy air days now
- 1 days/yr
- Unhealthy air days in 30 yrs
- 1 days/yr
Risk factors via First Street. Map © Google.
Why this score? — see what drove the C- grade
The composite is a weighted blend of 9 inputs, each scored 0–100. Each bar is that input's sub-score; the figure is the points it added to the 100-point composite (weight × sub-score).
- Cash flow +16.8/30.0
- ARV discount +15.0/15.0
- DSCR +5.2/10.0
- 1% rule +4.1/10.0
- Rent growth +3.7/5.0
- Schools +3.6/10.0
- Livability +3.3/5.0
- Condition / age +2.5/5.0
- Appreciation +0.0/10.0
$124,950
🖨 Deal sheet 📄 Offer letter ✓ Due diligence
Listing remarks MLS
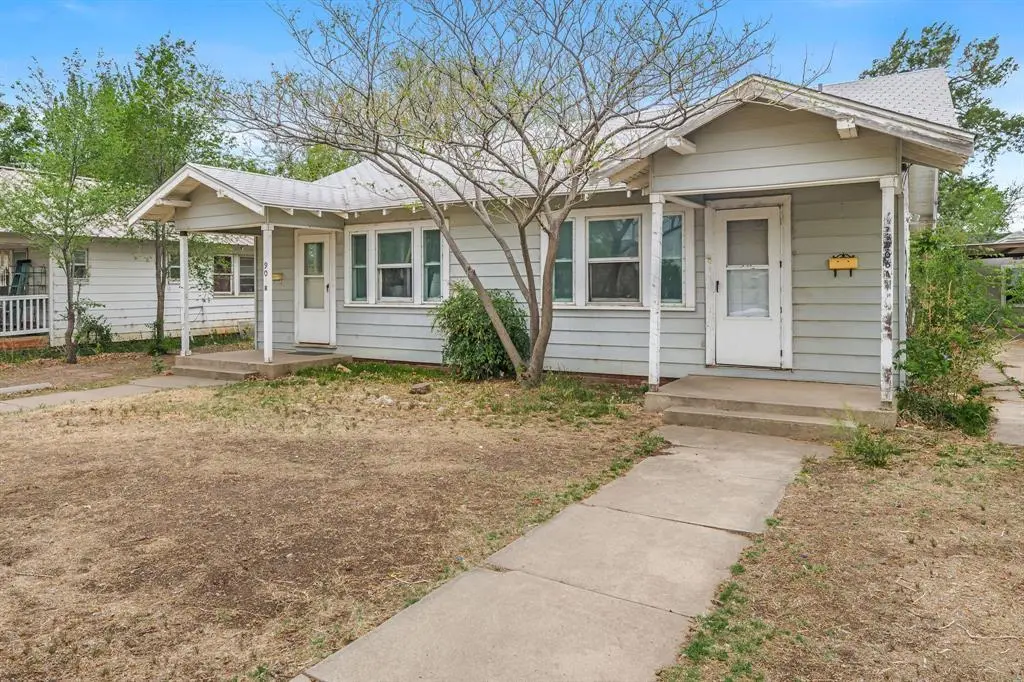
Excellent investment opportunity in Amarillo! This full duplex at 906 S. Mississippi features two 1-bedroom, 1-bathroom units, offering strong rental potential and flexibility for investors or owner-occupants. Each unit provides a functional layout with comfortable living space, a dedicated bedroom, full bath, and kitchen area. The property is ideal for generating consistent income, with the option to live in one unit while renting the other or lease both for maximum return. Centrally located, this duplex offers convenient access to major roads, making commuting throughout Amarillo simple and efficient. Situated near shopping, dining, and everyday amenities, tenants will appreciate the easy access to local conveniences. The property is also just minutes from downtown Amarillo, providing proximity to employment centers, entertainment, and services. Duplex properties in this area are in demand and offer long-term upside potential.
Key facts
- Kitchen area
- Dedicated bedroom
- Full bath
Tags
Neighborhood map
What this means for you Summary
Snapshot
- This is a 2-bed/2.0-bath other listed at $125k.
Deal economics
- At list price, monthly cash flow is $81 ($971/yr) — positive.
- The deal already cash-flows at list — no discount required.
- To meet the 1% rule (rent ≥ 1% of price), the offer needs to be $113k (9.2% below list).
- Recommended offer: $113k (9.2% below list) — sets the bar for 1% rule.
Location & tenants
- Location reads 66/100 on livability (#624 in TX) — a middle-class / working-renter tenant base. Strengths: cost of living A+, housing A+; Watch: amenities C-, schools D, crime F.
- Amarillo ISD (urban): math 44% / reading 41% proficiency, ranked #336 of 826 in TX (top 41%) — families likely to look elsewhere, expect single-tenant / working-renter base with shorter leases.
- Market conditions: Rents rising fast (+4.7%/yr); 132 active listings in the ZIP; 22 comparable units currently listed for rent nearby; rentals at typical pace (median 21d on market — plan ~3-4 weeks tenant-placement turnaround); 1,214 units permitted in Potter County in 2024 (650 in 5+ unit buildings).
Forward outlook
- Local home prices are declining (-3.0%/yr); year-one equity from $864 of loan paydown is wiped out by about $4k of value loss. Plan a longer hold.
Negotiation context
- It's been on market 64 days — a 6% lower offer ($117k) is reasonable based on typical stale-listing flexibility.
Risks & watch-outs
- Watch-outs: built in 1925 — expect roof / HVAC / electrical / plumbing capex.
Questions for the listing agent
- It's been on market 64 days. Have you received any prior offers? Is the seller open to a 9% concession, seller financing, or rate buy-down credit?
- Built in 1925 — when were the roof, HVAC, electrical panel, plumbing, and water heater last replaced?
- Why hasn't it sold? Are there any deal-killer items the seller is aware of (foundation, flood, title, zoning, code violations)?
- Is there a deadline driving the sale (1031 exchange, divorce, estate, relocation)? That informs how much negotiation room exists.
- Schools are D-rated, which usually means shorter tenancies and higher turnover. Who's the typical renter profile here, and what's been the actual vacancy rate?
- Crime grade is F in this area — have there been break-ins, vandalism, or insurance claims at this property in the last 3 years? What carrier currently insures it and at what premium?
- What's the average days-on-market for RENTAL listings here right now (not sales)? A rising rental-DOM trend means longer vacancies and softer asking-rent achievability than the comps imply.
- What's the recent tenant-quality profile in this submarket — average credit score on applications, eviction rate, late-payment / NSF rate, and stable-employment percentage? A property-management company in the area should have these aggregated.
- How much new for-sale + rental construction is in the pipeline within 1–3 miles? Heavy new supply typically softens prices + rents 12–24 months out; constrained supply supports both.
Investment metrics
- 1% rule
- 0.91% ✗
- Cap rate
- 7.07%
- Cash-on-cash
- 2.78%
- DSCR
- 1.12
- GRM
- 9.2
CMA / ARV
- ARV (median comp)
- $163,197
- List price
- $124,950
- Delta
- -23.44%
- Verdict
- UNDERPRICED
- Comps
- 2 within 1.0 mi
Projected returns pro-forma
-3.0% appreciation · 4.69% rent growth · sell at horizon
- IRR
- -10.1%
- Equity multiple
- 0.62×
- Total profit
- $-13,144
- Equity at exit
- $18,630
- IRR
- 1.3%
- Equity multiple
- 1.10×
- Total profit
- $3,473
- Equity at exit
- $10,803
Cash invested: $34,986 (down + closing). Projections, not guarantees.
Landlord ↔ Tenant lean methodology
- Overall (STATE)
- 87 Strongly Landlord-Friendly
- State Texas
- 87 Strongly Landlord-Friendly · R+5
- County
- — inherits STATE
- City
- — inherits STATE
ZIP-level market 79106
- Rents YoY
- 4.7%
- Active inventory
- 132
- Price-to-rent
- 9.2×
Monthly cashflow live
- Estimated rent
- $1,134 high interval (Pro) →
- Mortgage (P&I)
- −$655
- Tax from tax record
- −$108 /mo · $1,295/yr
- Insurance
- −$52
- HOA
- −$0
- Vacancy / Maint / Mgmt
- −$238
- Net cashflow
- $81
Break-even live
UW: 25.0% down · 7.5% · 30yr · 1.5% tax · 5.0% vac · 8.0% maint · 8.0% mgmt
Financing live
Cash to close
- Down payment
- $31,238
- Closing costs
- $3,748
- Reserves months
- —
- Total cash needed
- —
Loan-product check · same deal, 3 products live
Conventional
25% down · 7.5% · 30yr
- Down + closing
- —
- Monthly P&I
- —
- Monthly cashflow
- —
- DSCR
- —
- Eligible?
- —
Personal DTI + credit; lowest rate.
DSCR
20% down · 8.5% · 30yr
- Down + closing
- —
- Monthly P&I
- —
- Monthly cashflow
- —
- DSCR
- —
- Eligible?
- —
No personal income docs; deal must DSCR.
Hard money
10% down · 12.0% · 12mo
- Down + closing
- —
- Monthly P&I
- —
- Monthly cashflow
- —
- DSCR
- —
- Eligible?
- —
Short-term bridge; refi at stabilization.
Rent comps 22 comps
| Address | Beds | Baths | Sqft | Rent | $/sqft | DOM | Units | Dist |
|---|---|---|---|---|---|---|---|---|
| 1008 S Mississippi St Amarillo, TX | 3.0 | 2.0 | 1061 | $1,275 | $1.20 | 21d | 1 | 0.12mi |
| 701 Sunset Ter Amarillo, TX | 3.0 | 1.0 | 1444 | $1,350 | $0.93 | 21d | 1 | 0.20mi |
| 701 Sunset Ter Amarillo, TX | 3.0 | 1.0 | 1444 | $1,350 | $0.93 | 43d | 1 | 0.20mi |
| 802 S Kentucky St Amarillo, TX | 2.0 | 1.0 | 970 | $899 | $0.93 | 43d | 1 | 0.36mi |
| 3118 SW 15th Ave Amarillo, TX | 2.0–3.0 | 1.0–2.0 | 1015 | $640 | $0.63 | 13d | 17 | 0.43mi |
| 705 S Florida St Amarillo, TX | 2.0 | 1.0 | 1014 | $850 | $0.84 | 21d | 1 | 0.46mi |
| 913 S Rusk St Amarillo, TX | 3.0 | 2.0 | 1450 | $1,450 | $1.00 | 13d | 1 | 0.63mi |
| 4215 SW 11th Ave Amarillo, TX | 1.0 | 1.0 | 1224 | $995 | $0.81 | 21d | 1 | 0.64mi |
| 108 S Prospect St Amarillo, TX | 1.0 | 1.0 | 1670 | $750 | $0.45 | 43d | 1 | 0.75mi |
| 1809 Chama St Amarillo, TX | 3.0 | 1.0 | 1396 | $1,600 | $1.15 | 43d | 1 | 0.86mi |
| 1326 Hillcrest St Amarillo, TX | 3.0 | 1.0 | 958 | $1,295 | $1.35 | 21d | 1 | 0.92mi |
| 108 N Florida St Amarillo, TX | 2.0 | 1.0 | 960 | $800 | $0.83 | 21d | 1 | 0.93mi |
| 206 N Prospect St Amarillo, TX | 2.0 | 1.0 | 1479 | $950 | $0.64 | 21d | 1 | 0.95mi |
| 4222 SW 2nd Ave Amarillo, TX | 1.0 | 1.0 | 1114 | $799 | $0.72 | 21d | 1 | 0.99mi |
| 4231 SW 2nd Ave Amarillo, TX | 2.0 | 1.0 | 891 | $875 | $0.98 | 21d | 1 | 0.99mi |
| 4224 SW 2nd Ave Amarillo, TX | 2.0 | 1.0 | 891 | $775 | $0.87 | 21d | 1 | 0.99mi |
| 4226 SW 2nd Ave Amarillo, TX | 1.0 | 1.0 | 1193 | $799 | $0.67 | 21d | 1 | 1.00mi |
| 900 S Avondale St Amarillo, TX | 2.0 | 1.5 | 1000 | $875 | $0.88 | 13d | 1 | 1.11mi |
| 1501 Clover Dr Amarillo, TX | 1.0 | 1.0 | 1358 | $980 | $0.72 | 43d | 1 | 1.15mi |
| 5117 SW 16th Ave Amarillo, TX | 3.0 | 2.0 | 1513 | $1,745 | $1.15 | 21d | 1 | 1.35mi |
| 2030 Crockett St Amarillo, TX | 3.0 | 1.5 | 1307 | $1,750 | $1.34 | 13d | 1 | 1.41mi |
| 2104 S Travis St Amarillo, TX | 3.0 | 1.0 | 1236 | $1,700 | $1.38 | 21d | 1 | 1.48mi |
Listing history 18 events
-
2026-06-18days on market $124,950 Active 64 DOM
-
2026-06-17days on market $124,950 Active 63 DOM
-
2026-06-16days on market $124,950 Active 62 DOM
-
2026-06-15days on market $124,950 Active 61 DOM
-
2026-06-14days on market $124,950 Active 59 DOM
-
2026-06-13days on market $124,950 Active 58 DOM
-
2026-06-10days on market $124,950 Active 56 DOM
-
2026-06-09days on market $124,950 Active 55 DOM
-
2026-06-08days on market $124,950 Active 54 DOM
-
2026-06-07days on market $124,950 Active 53 DOM
-
2026-06-03days on market $124,950 Active 49 DOM
-
2026-06-02days on market $124,950 Active 48 DOM
-
2026-06-01days on market $124,950 Active 47 DOM
-
2026-05-31days on market $124,950 Active 46 DOM
-
2026-05-30days on market $124,950 Active 45 DOM
-
2026-04-15$124,950 Active 942-char remark
Show marketing remark (942 chars)
Excellent investment opportunity in Amarillo! This full duplex at 906 S. Mississippi features two 1-bedroom, 1-bathroom units, offering strong rental potential and flexibility for investors or owner-occupants. Each unit provides a functional layout with comfortable living space, a dedicated bedroom, full bath, and kitchen area. The property is ideal for generating consistent income, with the option to live in one unit while renting the other or lease both for maximum return. Centrally located, this duplex offers convenient access to major roads, making commuting throughout Amarillo simple and efficient. Situated near shopping, dining, and everyday amenities, tenants will appreciate the easy access to local conveniences. The property is also just minutes from downtown Amarillo, providing proximity to employment centers, entertainment, and services. Duplex properties in this area are in demand and offer long-term upside potential.
-
2026-01-27soldstatus $341,766
-
2021-07-23soldstatus
ⓘ Source: listings_history table (triggers on properties + properties_extension) + one-shot
backfill from property_details.listing_events for pre-trigger history.
Tax reassessment forecast TX · Resets to sale price
- Current annual tax
- $1,295 · $108/mo
- Projected year-2 tax
- $2,287 · $191/mo
- Expected delta
- +$992/yr (+$83/mo · 76.6%)
ⓘ Screening estimate from a state-policy table — verify with the county assessor before closing.
Climate risk First Street
- Flood 1/10 Low FEMA zone X (unshaded) · 0% chance over 30 yrs
- Wildfire 4/10 Moderate
- Heat 4/10 Moderate 7 d/yr ≥97°F today · 18 d/yr by 30 yrs out
- Wind 2/10 Low
- Air quality 2/10 Low 1 unhealthy d/yr today · 1 by 30 yrs out
Nearby sold comps map
Loading sold comps map…
Walkable amenities ~0.75 mi
Loading nearby amenities…
Taxation est. · year 1
- Rental income
- $13,612
- − Mortgage interest
- −$6,999
- − Property taxes
- −$1,295
- − Insurance
- −$625
- − Repairs & maintenance
- −$1,089
- − Management
- −$1,089
- − Depreciation
- −$3,635
- Taxable loss
- −$1,119
- Est. tax savings @ 24.0%
- +$269
- After-tax cash flow
- $1,240/yr
For passive investors: Depreciation is non-cash, so a rental often shows a tax loss while cash-flowing — sheltering income. Rental losses are passive: they offset passive income freely, and up to $25,000/yr can offset ordinary (W-2) income if you actively participate and your MAGI is under $100k (phasing out to $0 by $150k); unused losses carry forward. On sale, claimed depreciation is recaptured at up to 25%, and gains may owe capital-gains tax (a 1031 exchange can defer both). Figures are a year-1 estimate at your 24.0% rate — not tax advice; consult a CPA.
Schools (NCES district)
- District
- Amarillo ISD
- NCES district ID
- 4808130
- Math proficiency
- 44% ▼ -9.00%
- Reading proficiency
- 41% ▼ -3.00%
- Median HH income
- $43,478
- Composite
- 35.96/100
- National rank
- #4798
- State rank
- #336 of 826 in TX
Livability — Amarillo
- Score
- 66/100
- State rank
- #624
- US rank
- #11876
Category grades
Schools grade is shown separately in the Schools card above.
Census & demographics
- Census place
- Amarillo, TX
- County
- Potter County · 72,216 people
- City population
- 185,802
- Metro
- Amarillo, TX
- Population (ZIP)
- 26,161
- Household income
- $59,493
- Rent vs Own
- Severe rent burden
- 994.0
Population outlook (Potter County) Hauer SSP2
- Today (2025)
- 121,296 people
- By 2030
- 120,883 · -0.3%
- By 2040
- 119,668 · -1.3%
- By 2050
- 117,788 · -2.9%
- By 2075
- 110,250 · -9.1%
- By 2100
- 92,923 · -23.4%
Race, ethnicity, and origin ACS 2023
- Neighborhood character
- Diverse neighborhood (Simpson 0.58)
- Race & ethnicity
- White 56% Hispanic / Latino 33% Two or more races 16% Black 5% Asian 4%
- Hispanic origin (detail)
- Mexican 29%
- Common ancestry
- Italian 3% Slovak 2% Iranian 2%
- Foreign-born
- 9% · Canada, Philippines, Vietnam
- Languages at home
- 80% English-only · Spanish 16% Other Asian/Pacific 2% Vietnamese 1%
Political lean MEDSL · Potter
- 2024 margin
- Solid R (+44.4) · D 27.3% · R 71.7% · Other 1.1%
- 2008→2024 swing
- -5.0pp toward R · 2008: -39.4pp · 2024: -44.4pp
- All cycles
- 2024: R+44.4 2020: R+38.7 2016: R+41.9 2012: R+44.6 2008: R+39.4
Not yet ingested
- Civics
- —
Market trends
- HPI YoY
- ▼ -179.04%
- Current HPI
- 178.2153
- Rent YoY
- ▲ 4.69%
- Metro
- Amarillo, TX
- State GDP YoY
- ▲ 3.95%
- F500 in state
- 110
Industry mix (Fortune 500 HQ in TX)
| Industry | F500 HQs | Revenue |
|---|---|---|
| Energy | 16 | $1,198B |
|
||
| Technology | 5 | $198B |
|
||
| Engineering / Construction | 4 | $72B |
|
||
| Energy Services | 3 | $60B |
|
||
| Utilities | 3 | $41B |
|
||
| Healthcare | 2 | $330B |
|
||
Price history
-63.4% since first listed3 events — show timeline
- 2026-04-15 Listed $124,950 NTREIS
- 2026-01-27 Sold (Public Records) $341,766 Public Records
- 2021-07-23 Sold (Public Records) — Public Records
Property tax history
+1.3%/yrLatest (2025): $1,295 · +7.0% YoY. Source: county tax records.
Cash-flow waterfall
monthlySold comps — $/sqft
last 12 mo · ≤1 miLoading sold comps…