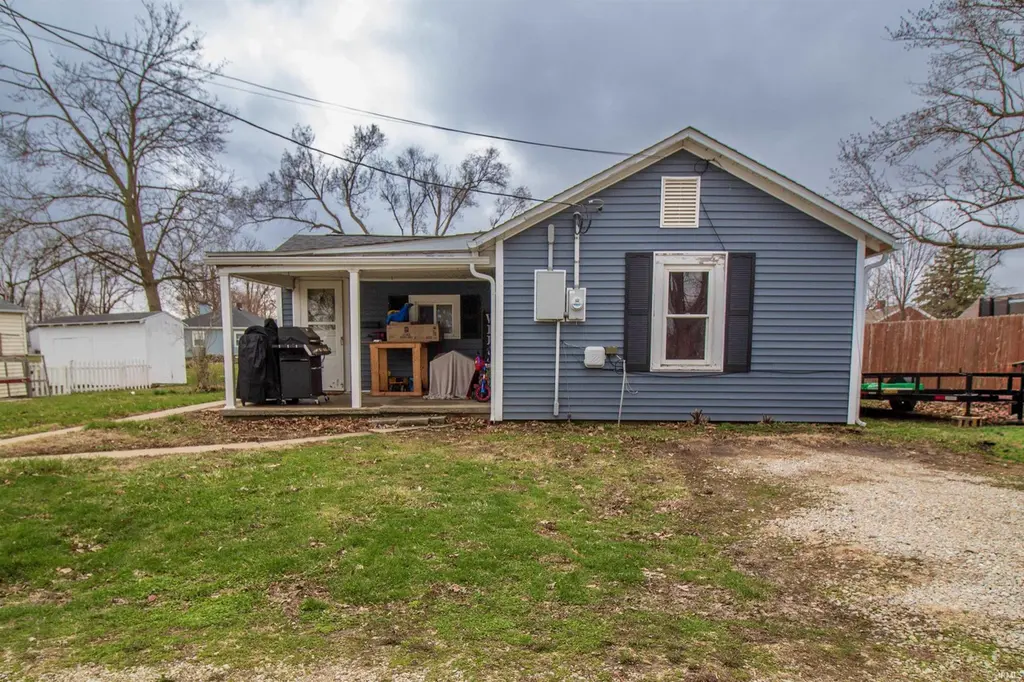
401 George St · Winchester, IN
Flood risk 6/10 · Moderate
- FEMA flood zone
- X (unshaded)
- Chance of flooding over 30 yrs
- 0.73%
- Est. flood insurance / yr
- $507 – $1,088
Fire risk 1/10 · Minimal
- Est. fire insurance / yr
- $717 – $1,331
Heat risk 3/10 · Minor
- Hot days now (above 100°F)
- 7 days/yr
- Hot days in 30 yrs
- 18 days/yr
Wind risk 2/10 · Minimal
- Chance of severe wind over 30 yrs
- 0.0%
Air-quality risk 3/10 · Minor
- Unhealthy air days now
- 2 days/yr
- Unhealthy air days in 30 yrs
- 4 days/yr
Risk factors via First Street. Map © Google.
Why this score? — see what drove the C- grade
The composite is a weighted blend of 9 inputs, each scored 0–100. Each bar is that input's sub-score; the figure is the points it added to the 100-point composite (weight × sub-score).
- ARV discount +13.0/15.0
- Cash flow +12.4/30.0
- Appreciation +10.0/10.0
- DSCR +3.7/10.0
- 1% rule +3.6/10.0
- Livability +3.4/5.0
- Schools +2.9/10.0
- Rent growth +2.5/5.0
- Condition / age +2.5/5.0
$69,900
🖨 Deal sheet 📄 Offer letter ✓ Due diligence
Listing remarks MLS
Cozy 2BR/1BA home with covered porch featuring 681 sq ft of easy, low-maintenance living. Check it out!
Key facts
- 4,792 sq ft lot
- Built 1939
- Listed 79 days
Neighborhood map
What this means for you Summary
Snapshot
- This is a 2-bed/1.0-bath single-family listed at $70k.
Deal economics
- At list price, monthly cash flow is $-11 ($-132/yr) — negative.
- To cash-flow at today's rent, offer at most $68k (2.8% below list).
- To meet the 1% rule (rent ≥ 1% of price), the offer needs to be $60k (14.2% below list).
- Recommended offer: $60k (14.2% below list) — sets the bar for 1% rule.
Location & tenants
- Location reads 67/100 on livability (#240 in IN) — a middle-class / working-renter tenant base. Strengths: cost of living A+, housing A+, crime B; Watch: health & safety D, schools D-, amenities F.
- Randolph Central School Corporation (town): math 32% / reading 37% proficiency, ranked #201 of 301 in IN (top 67%) — families likely to look elsewhere, expect single-tenant / working-renter base with shorter leases.
- Market conditions: 52 active listings in the ZIP; 1 comparable units currently listed for rent nearby; 19 units permitted in Randolph County in 2024 (0 in 5+ unit buildings).
Forward outlook
- In year one you build about $7k of equity ($483 loan paydown + $7k appreciation (10.0% local appreciation)).
- Randolph County population projected at -26% by 2050 — secular population decline; favor cash flow + early exit over multi-decade hold.
- At projected returns (10.0% appreciation + 3.0% rent growth), your $20k cash investment doubles in ~3 years — after that, you're playing with house money.
- By year 5, paydown + projected appreciation supports a ~$35k cash-out refi (75% LTV) — recoverable capital for the next deal without selling this one.
Negotiation context
- It's been on market 79 days — a 6% lower offer ($66k) is reasonable based on typical stale-listing flexibility.
- 3 sale attempts since 4y ago with the ask held roughly flat each time — persistent listings suggest the price (not the market) is what's stuck; bring a comps-based counter.
Risks & watch-outs
- Watch-outs: built in 1939 — expect roof / HVAC / electrical / plumbing capex.
- Climate carrying-cost: major flood risk — expect insurance premiums to compound above CPI over the hold.
Questions for the listing agent
- What do current leases actually rent for vs. the listed asking? Can we see a recent rent roll and the last 12 months of T-12 income?
- It's been on market 79 days. Have you received any prior offers? Is the seller open to a 14% concession, seller financing, or rate buy-down credit?
- Built in 1939 — when were the roof, HVAC, electrical panel, plumbing, and water heater last replaced?
- Why hasn't it sold? Are there any deal-killer items the seller is aware of (foundation, flood, title, zoning, code violations)?
- Is there a deadline driving the sale (1031 exchange, divorce, estate, relocation)? That informs how much negotiation room exists.
- Schools are D-rated, which usually means shorter tenancies and higher turnover. Who's the typical renter profile here, and what's been the actual vacancy rate?
- What's the average days-on-market for RENTAL listings here right now (not sales)? A rising rental-DOM trend means longer vacancies and softer asking-rent achievability than the comps imply.
- What's the recent tenant-quality profile in this submarket — average credit score on applications, eviction rate, late-payment / NSF rate, and stable-employment percentage? A property-management company in the area should have these aggregated.
- How much new for-sale + rental construction is in the pipeline within 1–3 miles? Heavy new supply typically softens prices + rents 12–24 months out; constrained supply supports both.
Investment metrics
- 1% rule
- 0.86% ✗
- Cap rate
- 6.10%
- Cash-on-cash
- -0.67%
- DSCR
- 0.97
- GRM
- 9.7
CMA / ARV
- ARV (median comp)
- $79,593
- List price
- $69,900
- Delta
- -12.18%
- Verdict
- UNDERPRICED
- Comps
- 20 within 1.0 mi
Show comp detail 2 sales within ~0.75 mi
| Address | Dist | Beds/Ba | Sqft | Sold | Price | $/sf | Match |
|---|---|---|---|---|---|---|---|
| 540 N Main St | 0.72mi | 2/1.0 | 720 (+6%) | 4mo | $79,000 | $110 | 53 |
| 118 W Third St | 0.63mi | 2/1.0 | 748 (+10%) | 10mo | $89,000 | $119 | 46 |
Match score weights: distance 35% · size 25% · config 20% · recency 20%. Top-matched comps best support the ARV.
Projected returns pro-forma
10.0% appreciation · 3.0% rent growth · sell at horizon
- IRR
- 23.8%
- Equity multiple
- 2.91×
- Total profit
- $37,380
- Equity at exit
- $62,971
- IRR
- 21.1%
- Equity multiple
- 6.65×
- Total profit
- $110,649
- Equity at exit
- $135,800
Cash invested: $19,572 (down + closing). Projections, not guarantees.
Landlord ↔ Tenant lean methodology
- Overall (STATE)
- 90 Strongly Landlord-Friendly
- State Indiana
- 90 Strongly Landlord-Friendly · R+11
- County
- — inherits STATE
- City
- — inherits STATE
ZIP-level market 47394
- Home prices YoY
- 6.8%
- Active inventory
- 52
- Price-to-rent
- 9.7×
Monthly cashflow live
- Estimated rent
- $600 medium interval (Pro) →
- Mortgage (P&I)
- −$367
- Tax from tax record
- −$89 /mo · $1,072/yr
- Insurance
- −$29
- HOA
- −$0
- Vacancy / Maint / Mgmt
- −$126
- Net cashflow
- $-11
Break-even live
UW: 25.0% down · 7.5% · 30yr · 1.5% tax · 5.0% vac · 8.0% maint · 8.0% mgmt
Financing live
Cash to close
- Down payment
- $17,475
- Closing costs
- $2,097
- Reserves months
- —
- Total cash needed
- —
Loan-product check · same deal, 3 products live
Conventional
25% down · 7.5% · 30yr
- Down + closing
- —
- Monthly P&I
- —
- Monthly cashflow
- —
- DSCR
- —
- Eligible?
- —
Personal DTI + credit; lowest rate.
DSCR
20% down · 8.5% · 30yr
- Down + closing
- —
- Monthly P&I
- —
- Monthly cashflow
- —
- DSCR
- —
- Eligible?
- —
No personal income docs; deal must DSCR.
Hard money
10% down · 12.0% · 12mo
- Down + closing
- —
- Monthly P&I
- —
- Monthly cashflow
- —
- DSCR
- —
- Eligible?
- —
Short-term bridge; refi at stabilization.
Rent comps 1 comps
| Address | Beds | Baths | Sqft | Rent | $/sqft | DOM | Units | Dist |
|---|---|---|---|---|---|---|---|---|
| 1526 S Old Highway 27 Winchester, IN | 2.0 | 1.0 | 600 | $600 | $1.00 | 43d | 1 | 1.15mi |
Listing history 14 events
-
2026-06-12statusdays on market $69,900 Pending 79 DOM
-
2026-06-09days on market $69,900 Active 77 DOM
-
2026-06-08days on market $69,900 Active 76 DOM
-
2026-06-07days on market $69,900 Active 75 DOM
-
2026-06-04days on market $69,900 Active 71 DOM
-
2026-06-02days on market $69,900 Active 70 DOM
-
2026-06-01days on market $69,900 Active 69 DOM
-
2026-05-31days on market $69,900 Active 68 DOM
-
2026-05-31days on market $69,900 Active 67 DOM
-
2026-03-25status Active 103-char remark
Show marketing remark (103 chars)
Cozy 2BR/1BA home with covered porch featuring 681 sq ft of easy, low-maintenance living. Check it out!
-
2026-03-12status Pending 103-char remark
Show marketing remark (103 chars)
Cozy 2BR/1BA home with covered porch featuring 681 sq ft of easy, low-maintenance living. Check it out!
-
2026-03-11$69,900 Active 103-char remark
Show marketing remark (103 chars)
Cozy 2BR/1BA home with covered porch featuring 681 sq ft of easy, low-maintenance living. Check it out!
-
2022-11-11status Pending
-
2022-11-01$44,900 Active
ⓘ Source: listings_history table (triggers on properties + properties_extension) + one-shot
backfill from property_details.listing_events for pre-trigger history.
Tax reassessment forecast IN · Partial reset (capped growth)
- Current annual tax
- $1,072 · $89/mo
- Projected year-2 tax
- $1,072 · $89/mo
- Expected delta
- $0/yr ($0/mo · 0.0%)
ⓘ Screening estimate from a state-policy table — verify with the county assessor before closing.
Climate risk First Street
- Flood 6/10 Major FEMA zone X (unshaded) · 73% chance over 30 yrs
- Wildfire 1/10 Low
- Heat 3/10 Moderate 7 d/yr ≥100°F today · 18 d/yr by 30 yrs out
- Wind 2/10 Low 0% chance of damaging wind over 30 yrs
- Air quality 3/10 Moderate 2 unhealthy d/yr today · 4 by 30 yrs out
Nearby sold comps map
Loading sold comps map…
Walkable amenities ~0.75 mi
Loading nearby amenities…
Taxation est. · year 1
- Rental income
- $7,200
- − Mortgage interest
- −$3,915
- − Property taxes
- −$1,072
- − Insurance
- −$350
- − Repairs & maintenance
- −$576
- − Management
- −$576
- − Depreciation
- −$2,033
- Taxable loss
- −$1,322
- Est. tax savings @ 24.0%
- +$317
- After-tax cash flow
- $186/yr
For passive investors: Depreciation is non-cash, so a rental often shows a tax loss while cash-flowing — sheltering income. Rental losses are passive: they offset passive income freely, and up to $25,000/yr can offset ordinary (W-2) income if you actively participate and your MAGI is under $100k (phasing out to $0 by $150k); unused losses carry forward. On sale, claimed depreciation is recaptured at up to 25%, and gains may owe capital-gains tax (a 1031 exchange can defer both). Figures are a year-1 estimate at your 24.0% rate — not tax advice; consult a CPA.
Schools (NCES district)
- District
- Randolph Central School Corporation
- NCES district ID
- 1801770
- Math proficiency
- 32% ▼ -7.00%
- Reading proficiency
- 37% ▼ -4.00%
- Median HH income
- $41,627
- Composite
- 29.12/100
- National rank
- #6589
- State rank
- #201 of 301 in IN
Livability — Winchester
- Score
- 67/100
- State rank
- #240
- US rank
- #10313
Category grades
Schools grade is shown separately in the Schools card above.
Census & demographics
- Census place
- Winchester, IN
- City population
- 8,137
- Population (ZIP)
- 8,137
Population outlook (Randolph County) Hauer SSP2
- Today (2025)
- 22,998 people
- By 2030
- 21,815 · -5.1%
- By 2040
- 19,360 · -15.8%
- By 2050
- 17,010 · -26.0%
- By 2075
- 12,491 · -45.7%
- By 2100
- 8,986 · -60.9%
Race, ethnicity, and origin ACS 2023
- Neighborhood character
- Predominantly White (96%)
- Race & ethnicity
- White 96% Two or more races 2% Hispanic / Latino 1%
- Common ancestry
- Lithuanian 2% Italian 2% Slovak 2%
- Foreign-born
- 1%
- Languages at home
- 99% English-only · Spanish 1% Other Asian/Pacific 1%
Political lean MEDSL · Randolph
- 2024 margin
- Solid R (+53.7) · D 22.3% · R 75.9% · Other 1.8%
- 2008→2024 swing
- -44.9pp toward R · 2008: -8.8pp · 2024: -53.7pp
- All cycles
- 2024: R+53.7 2020: R+52.4 2016: R+48.5 2012: R+24.1 2008: R+8.8
Not yet ingested
- Civics
- —
Market trends
- HPI YoY
- ▲ 14.76%
- Current HPI
- 233.216
- Rent YoY
- —
- Metro
- —
- State GDP YoY
- ▲ 2.90%
- F500 in state
- 18
Industry mix (Fortune 500 HQ in IN)
| Industry | F500 HQs | Revenue |
|---|---|---|
| Industrial Machinery | 2 | $37B |
|
||
| Healthcare | 1 | $177B |
|
||
| Pharmaceuticals | 1 | $45B |
|
||
| Metals / Steel | 1 | $18B |
|
||
| Agriculture | 1 | $17B |
|
||
| Packaging | 1 | $12B |
|
||
Price history
+55.7% since first listed5 events — show timeline
- 2026-03-25 Relisted — IRMLS
- 2026-03-12 Pending — IRMLS
- 2026-03-11 Listed $69,900 IRMLS
- 2022-11-11 Pending — IRMLS
- 2022-11-01 Listed $44,900 IRMLS
Property tax history
+6.0%/yrLatest (2024): $1,072 · -1.9% YoY. Source: county tax records.
Cash-flow waterfall
monthlySold comps — $/sqft
last 12 mo · ≤1 miLoading sold comps…