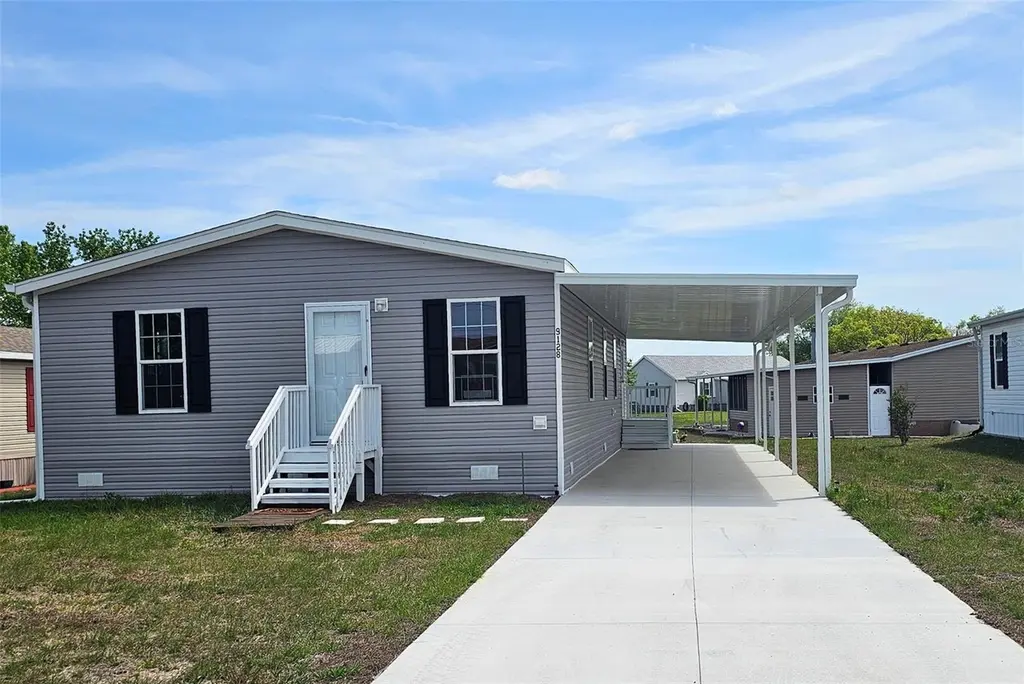
9128 Scepter Ave · Brookridge, FL
Flood risk 1/10 · Minimal
- FEMA flood zone
- X (unshaded)
- Chance of flooding over 30 yrs
- 0.0%
- Est. flood insurance / yr
- $507 – $1,088
Fire risk 3/10 · Minor
- Est. fire insurance / yr
- $947 – $1,759
Heat risk 10/10 · Severe
- Hot days now (above 109°F)
- 8 days/yr
- Hot days in 30 yrs
- 28 days/yr
Wind risk 9/10 · Severe
- Chance of severe wind over 30 yrs
- 99.0%
Air-quality risk 2/10 · Minimal
- Unhealthy air days now
- 1 days/yr
- Unhealthy air days in 30 yrs
- 1 days/yr
Risk factors via First Street. Map © Google.
Why this score? — see what drove the D+ grade
The composite is a weighted blend of 9 inputs, each scored 0–100. Each bar is that input's sub-score; the figure is the points it added to the 100-point composite (weight × sub-score).
- Cash flow +17.1/30.0
- ARV discount +7.5/15.0
- DSCR +5.3/10.0
- 1% rule +5.0/10.0
- Schools +4.2/10.0
- Livability +3.5/5.0
- Rent growth +2.5/5.0
- Condition / age +2.5/5.0
- Appreciation +0.0/10.0
$184,770
🖨 Deal sheet 📄 Offer letter ✓ Due diligence
Listing remarks
One or more photo(s) has been virtually staged. Brand New 3BR in Gated 55+ Brookridge | Owned Land + Low $55 HOA. ”What's special is this brand new 2025 home was never lived in and is built for how people actually want to retire. The home sits inside Brookridge, one of Hernando County's gated 55+ communities. And unlike so many manufactured home communities, you own the land beneath your feet. No lot rent. No landlord. Just Inside, the open-concept layout feels immediately right. The custom kitchen anchors the home with a spacious island built for conversation, and gleaming stainless steel refrigerator. Natural light pours through. The living and dining spaces flow together effortless
Key facts
- Gated community
- Custom kitchen
- Spacious island
Tags
Property features AI
Finance
- Financial info: Total annual fees $660; Condo/association fees paid monthly
- HOA & community: Monthly association fee of $55; Community features include clubhouse, golf, pool and tennis courts; Association amenities listed: clubhouse, fitness center, pickleball courts, pool, sauna, shuffleboard, tennis courts; Senior community; Pets allowed (with limits)
Exterior
- Parking: Carport with 2 spaces
- Utilities: Public sewer; Water available; Sewer available; Cable available; No water source specified
- Home design: Manufactured home (double wide); Single-story; Faces west; Completed condition; Entry on one level
- Construction: Vinyl siding; Shingle roof; Pillar/Post/Pier foundation; Built as a double wide manufactured home
- Exterior features: Level lot; Paved road access
Interior
- Kitchen: Dishwasher; Microwave; Range; Refrigerator
- Bedrooms: 3 bedrooms
- Flooring: Vinyl flooring
- Bathrooms: 2 full bathrooms
- Heating & cooling: Central heating (electric); Central air conditioning
- Interior features: Other interior features; 9 total rooms
- Laundry & utility: Laundry inside
Neighborhood map
What this means for you Summary
Snapshot
- This is a 3-bed/2.0-bath land listed at $185k.
Deal economics
- At list price, monthly cash flow is $128 ($2k/yr) — positive.
- The deal already cash-flows at list — no discount required.
- Meets the 1% rule at list price ($2k rent vs $185k).
- Recommended offer: $179k (3.0% below list) — sets the bar for market timing.
Location & tenants
- Location reads 70/100 on livability (#421 in FL) — a middle-class / working-renter tenant base. Strengths: cost of living A+, housing A+, crime B+; Watch: employment C-, health & safety C-, amenities F.
- Hernando (suburban): math 50% / reading 50% proficiency, ranked #38 of 73 in FL (top 52%) — acceptable for families but not a draw, mixed tenant base, ~2y average lease.
- Zoned schools: Pine Grove Elementary School (math 60% / reading 45%, grade C-, #976 of 2,144 statewide, top 46%, 991 students, 60% FRL); Central High School (math 34% / reading 44%, grade F, #312 of 667 statewide, top 48%, 1,426 students, 53% FRL) — zoned schools at 56% FRL track the district average.
- Market conditions: 691 active listings in the ZIP; 10 comparable units currently listed for rent nearby; rentals at typical pace (median 22d on market — plan ~3-4 weeks tenant-placement turnaround); 2,505 units permitted in Hernando County in 2024 (318 in 5+ unit buildings).
- This rent runs 38% of the median local income ($59k/yr) — at the standard rent-burdened threshold; future hikes will face affordability resistance.
Forward outlook
- Local home prices are declining (-3.0%/yr); year-one equity from $1k of loan paydown is wiped out by about $6k of value loss. Plan a longer hold.
- Hernando County population projected at +11% by 2050 — modest demand growth; plan on rents tracking national, not racing it.
Negotiation context
- It's been on market 52 days — a 3% lower offer ($179k) is reasonable based on typical stale-listing flexibility.
- 2 sale attempts with the ask held roughly flat each time — persistent listings suggest the price (not the market) is what's stuck; bring a comps-based counter.
- Current owner paid $7k; list at $185k implies a 2540% gain — meaningful room to come down on a strong offer.
Risks & watch-outs
- Climate carrying-cost: severe wind risk, 99% chance of damaging wind over 30y; extreme-heat days projected 8→28/yr by 2055 (HVAC capex compounding) — expect insurance premiums to compound above CPI over the hold.
Questions for the listing agent
- It's been on market 52 days. Have you received any prior offers? Is the seller open to a 3% concession, seller financing, or rate buy-down credit?
- What does the HOA fee cover, when was the last increase, and are there any pending special assessments or reserve-fund shortfalls?
- Is there a deadline driving the sale (1031 exchange, divorce, estate, relocation)? That informs how much negotiation room exists.
- Schools are F-rated, which usually means shorter tenancies and higher turnover. Who's the typical renter profile here, and what's been the actual vacancy rate?
- The area grade is low — what's the realistic commute time and amenity access for the typical tenant pool here? Any planned neighborhood developments (good or bad) we should know about?
- What's the average days-on-market for RENTAL listings here right now (not sales)? A rising rental-DOM trend means longer vacancies and softer asking-rent achievability than the comps imply.
- What's the recent tenant-quality profile in this submarket — average credit score on applications, eviction rate, late-payment / NSF rate, and stable-employment percentage? A property-management company in the area should have these aggregated.
- How much new for-sale + rental construction is in the pipeline within 1–3 miles? Heavy new supply typically softens prices + rents 12–24 months out; constrained supply supports both.
Investment metrics
- 1% rule
- 1.00% ✓
- Cap rate
- 7.13%
- Cash-on-cash
- 2.98%
- DSCR
- 1.13
- GRM
- 8.3
CMA / ARV
No comps found within radius.
Projected returns pro-forma
-3.0% appreciation · 3.0% rent growth · sell at horizon
- IRR
- -11.6%
- Equity multiple
- 0.58×
- Total profit
- $-21,699
- Equity at exit
- $27,550
- IRR
- -2.3%
- Equity multiple
- 0.84×
- Total profit
- $-8,111
- Equity at exit
- $15,976
Cash invested: $51,736 (down + closing). Projections, not guarantees.
Landlord ↔ Tenant lean methodology
- Overall (STATE)
- 87 Strongly Landlord-Friendly
- State Florida
- 87 Strongly Landlord-Friendly · R+3
- County
- — inherits STATE
- City
- — inherits STATE
ZIP-level market 34613
- Home prices YoY
- -17.2%
- Active inventory
- 691
- Price-to-rent
- 8.3×
Monthly cashflow live
- Estimated rent
- $1,849 high interval (Pro) →
- Mortgage (P&I)
- −$969
- Tax est. 1.5%
- −$231 /mo · $2,772/yr
- Insurance
- −$77
- HOA
- −$55
- Vacancy / Maint / Mgmt
- −$388
- Net cashflow
- $128
Break-even live
UW: 25.0% down · 7.5% · 30yr · 1.5% tax · 5.0% vac · 8.0% maint · 8.0% mgmt
Financing live
Cash to close
- Down payment
- $46,192
- Closing costs
- $5,543
- Reserves months
- —
- Total cash needed
- —
Loan-product check · same deal, 3 products live
Conventional
25% down · 7.5% · 30yr
- Down + closing
- —
- Monthly P&I
- —
- Monthly cashflow
- —
- DSCR
- —
- Eligible?
- —
Personal DTI + credit; lowest rate.
DSCR
20% down · 8.5% · 30yr
- Down + closing
- —
- Monthly P&I
- —
- Monthly cashflow
- —
- DSCR
- —
- Eligible?
- —
No personal income docs; deal must DSCR.
Hard money
10% down · 12.0% · 12mo
- Down + closing
- —
- Monthly P&I
- —
- Monthly cashflow
- —
- DSCR
- —
- Eligible?
- —
Short-term bridge; refi at stabilization.
Rent comps 10 comps
| Address | Beds | Baths | Sqft | Rent | $/sqft | DOM | Units | Dist |
|---|---|---|---|---|---|---|---|---|
| 8761 Fetterbush Ct Brooksville, FL | 3.0 | 2.0 | 1730 | $1,850 | $1.07 | 24d | 1 | 0.22mi |
| 9289 Scepter Ave Brooksville, FL | 3.0 | 2.0 | 1512 | $1,400 | $0.93 | 5d | 1 | 0.25mi |
| 8871 Southern Charm Cir Brooksville, FL | 3.0 | 2.0 | 1482 | $2,050 | $1.38 | 24d | 1 | 0.33mi |
| 8917 Southern Charm Cir Brooksville, FL | 3.0 | 2.0 | 1437 | $1,695 | $1.18 | 3d | 1 | 0.36mi |
| 14131 Lemon Yellow Tree Ln Brooksville, FL | 3.0 | 2.0 | 1840 | $1,979 | $1.08 | 5d | 1 | 0.58mi |
| 9356 Southern Charm Cir Brooksville, FL | 3.0 | 2.0 | 1621 | $1,800 | $1.11 | 24d | 1 | 0.67mi |
| 8407 Weatherford Ave Brooksville, FL | 2.0 | 2.0 | 1104 | $1,500 | $1.36 | 18d | 1 | 0.80mi |
| 9919 Scepter Ave Brooksville, FL | 3.0 | 2.0 | 1188 | $1,250 | $1.05 | 5d | 1 | 0.88mi |
| 13020 Sun Rd Brooksville, FL | 2.0 | 2.0 | 1424 | $1,700 | $1.19 | 24d | 1 | 1.00mi |
| 14342 Starcross St Brooksville, FL | 2.0 | 1.0 | 900 | $1,025 | $1.14 | 22d | 1 | 1.33mi |
HOA detail
- Monthly dues
- $55 · $660/yr
- Likely covers
- security
Listing history 50 events
-
2026-06-07statusdays on market $184,770 Pending 52 DOM
-
2026-06-04days on market $184,770 Active 51 DOM
-
2026-06-03days on market $184,770 Active 50 DOM
-
2026-06-02days on market $184,770 Active 49 DOM
-
2026-06-01days on market $184,770 Active 48 DOM
-
2026-05-31days on market $184,770 Active 47 DOM
-
2026-05-13price $185,880
-
2026-05-06price $188,330
-
2026-05-01price $188,770
-
2026-04-25price $189,877
-
2026-04-14$191,900 Active
-
2026-03-26historical
-
2026-03-25price $193,981
-
2026-03-24price $193,982
-
2026-03-23price $193,983
-
2026-03-20price $193,984
-
2026-03-20price $194,984
-
2026-03-19price $194,985
-
2026-03-18price $194,986
-
2026-03-17price $194,987
-
2026-03-16price $194,988
-
2026-03-13price $194,989
-
2026-03-12price $194,990
-
2026-03-11price $194,991
-
2026-03-10price $194,992
-
2026-03-09price $194,993
-
2026-03-06price $194,994
-
2026-03-05price $194,995
-
2026-03-05price $199,995
-
2026-03-04price $199,996
-
2026-03-03price $199,997
-
2026-03-02price $199,998
-
2026-02-27price $199,999
-
2026-02-26price $207,999
-
2026-02-25price $212,999
-
2026-02-25price $217,384
-
2026-02-24price $217,385
-
2026-02-23price $222,385
-
2026-02-23price $227,385
-
2026-02-22price $227,386
-
2026-02-20price $227,486
-
2026-02-19price $227,487
-
2026-02-18price $227,488
-
2026-02-17price $227,489
-
2026-02-16price $227,490
-
2026-02-14price $227,491
-
2026-02-13price $227,591
-
2026-02-12price $227,592
-
2026-02-11price $227,593
-
2026-02-10price $227,594
ⓘ Source: listings_history table (triggers on properties + properties_extension) + one-shot
backfill from property_details.listing_events for pre-trigger history.
Climate risk First Street
- Flood 1/10 Low FEMA zone X (unshaded) · 0% chance over 30 yrs
- Wildfire 3/10 Moderate
- Heat 10/10 Extreme 8 d/yr ≥109°F today · 28 d/yr by 30 yrs out
- Wind 9/10 Extreme 99% chance of damaging wind over 30 yrs
- Air quality 2/10 Low 1 unhealthy d/yr today · 1 by 30 yrs out
Nearby sold comps map
Loading sold comps map…
Walkable amenities ~0.75 mi
Loading nearby amenities…
Taxation est. · year 1
- Rental income
- $22,182
- − Mortgage interest
- −$10,350
- − Property taxes
- −$2,772
- − Insurance
- −$924
- − Repairs & maintenance
- −$1,775
- − Management
- −$1,775
- − HOA
- −$660
- − Depreciation
- −$5,375
- Taxable loss
- −$1,447
- Est. tax savings @ 24.0%
- +$347
- After-tax cash flow
- $1,889/yr
For passive investors: Depreciation is non-cash, so a rental often shows a tax loss while cash-flowing — sheltering income. Rental losses are passive: they offset passive income freely, and up to $25,000/yr can offset ordinary (W-2) income if you actively participate and your MAGI is under $100k (phasing out to $0 by $150k); unused losses carry forward. On sale, claimed depreciation is recaptured at up to 25%, and gains may owe capital-gains tax (a 1031 exchange can defer both). Figures are a year-1 estimate at your 24.0% rate — not tax advice; consult a CPA.
Schools (NCES district)
- District
- Hernando
- NCES district ID
- 1200810
- Math proficiency
- 50% ▼ -8.00%
- Reading proficiency
- 50% ▼ -4.00%
- Median HH income
- $41,985
- Composite
- 42.03/100
- National rank
- #3329
- State rank
- #38 of 73 in FL
Livability — Brookridge
- Score
- 70/100
- State rank
- #421
- US rank
- #7529
Category grades
Schools grade is shown separately in the Schools card above.
Census & demographics
- Census place
- Brookridge, FL
- County
- Hernando County · 169,677 people
- Metro
- Tampa-St. Petersburg-Clearwater, FL
- Population (ZIP)
- 19,337
- Household income
- $58,596
- Rent vs Own
- Severe rent burden
- 307.0
Population outlook (Hernando County) Hauer SSP2
- Today (2025)
- 189,218 people
- By 2030
- 194,367 · +2.7%
- By 2040
- 203,398 · +7.5%
- By 2050
- 209,589 · +10.8%
- By 2075
- 218,452 · +15.4%
- By 2100
- 205,923 · +8.8%
Race, ethnicity, and origin ACS 2023
- Neighborhood character
- Predominantly White (88%)
- Race & ethnicity
- White 88% Hispanic / Latino 6% Two or more races 4% Black 2% Asian 1%
- Hispanic origin (detail)
- Mexican 1% Puerto Rican 2% Cuban 1%
- Common ancestry
- Romanian 4% Lithuanian 3% Slovak 2%
- Foreign-born
- 8% · Canada, Vietnam
- Languages at home
- 92% English-only · Spanish 3% French/Haitian/Cajun 1% Russian/Polish/Slavic 1%
Political lean MEDSL · Hernando
- 2024 margin
- Solid R (+37.0) · D 31.1% · R 68.2%
- 2008→2024 swing
- -33.5pp toward R · 2008: -3.6pp · 2024: -37.0pp
- All cycles
- 2024: R+37.0 2020: R+30.2 2016: R+29.0 2012: R+8.5 2008: R+3.6
Not yet ingested
- Civics
- —
Market trends
- HPI YoY
- ▼ -57.51%
- Current HPI
- 276.2229
- Rent YoY
- —
- Metro
- Tampa-St. Petersburg-Clearwater, FL
- State GDP YoY
- ▲ 3.28%
- F500 in state
- 36
Industry mix (Fortune 500 HQ in FL)
| Industry | F500 HQs | Revenue |
|---|---|---|
| Industrial Technology | 2 | $29B |
|
||
| Insurance | 2 | $17B |
|
||
| Retail | 1 | $60B |
|
||
| Technology Distribution | 1 | $58B |
|
||
| Homebuilding | 1 | $35B |
|
||
| Technology Manufacturing | 1 | $35B |
|
||
Price history
+2555.4% since first listed65 events — show timeline
- 2026-05-13 Price Changed $185,880 Stellar MLS as Distributed by MLS Grid
- 2026-05-06 Price Changed $188,330 Stellar MLS as Distributed by MLS Grid
- 2026-05-01 Price Changed $188,770 Stellar MLS as Distributed by MLS Grid
- 2026-04-25 Price Changed $189,877 Stellar MLS as Distributed by MLS Grid
- 2026-04-14 Listed $191,900 Stellar MLS as Distributed by MLS Grid
- 2026-03-26 Listing Removed — Stellar MLS as Distributed by MLS Grid
- 2026-03-25 Price Changed $193,981 Stellar MLS as Distributed by MLS Grid
- 2026-03-24 Price Changed $193,982 Stellar MLS as Distributed by MLS Grid
- 2026-03-23 Price Changed $193,983 Stellar MLS as Distributed by MLS Grid
- 2026-03-20 Price Changed $193,984 Stellar MLS as Distributed by MLS Grid
- 2026-03-20 Price Changed $194,984 Stellar MLS as Distributed by MLS Grid
- 2026-03-19 Price Changed $194,985 Stellar MLS as Distributed by MLS Grid
- 2026-03-18 Price Changed $194,986 Stellar MLS as Distributed by MLS Grid
- 2026-03-17 Price Changed $194,987 Stellar MLS as Distributed by MLS Grid
- 2026-03-16 Price Changed $194,988 Stellar MLS as Distributed by MLS Grid
- 2026-03-13 Price Changed $194,989 Stellar MLS as Distributed by MLS Grid
- 2026-03-12 Price Changed $194,990 Stellar MLS as Distributed by MLS Grid
- 2026-03-11 Price Changed $194,991 Stellar MLS as Distributed by MLS Grid
- 2026-03-10 Price Changed $194,992 Stellar MLS as Distributed by MLS Grid
- 2026-03-09 Price Changed $194,993 Stellar MLS as Distributed by MLS Grid
- 2026-03-06 Price Changed $194,994 Stellar MLS as Distributed by MLS Grid
- 2026-03-05 Price Changed $194,995 Stellar MLS as Distributed by MLS Grid
- 2026-03-05 Price Changed $199,995 Stellar MLS as Distributed by MLS Grid
- 2026-03-04 Price Changed $199,996 Stellar MLS as Distributed by MLS Grid
- 2026-03-03 Price Changed $199,997 Stellar MLS as Distributed by MLS Grid
- 2026-03-02 Price Changed $199,998 Stellar MLS as Distributed by MLS Grid
- 2026-02-27 Price Changed $199,999 Stellar MLS as Distributed by MLS Grid
- 2026-02-26 Price Changed $207,999 Stellar MLS as Distributed by MLS Grid
- 2026-02-25 Price Changed $212,999 Stellar MLS as Distributed by MLS Grid
- 2026-02-25 Price Changed $217,384 Stellar MLS as Distributed by MLS Grid
- 2026-02-24 Price Changed $217,385 Stellar MLS as Distributed by MLS Grid
- 2026-02-23 Price Changed $222,385 Stellar MLS as Distributed by MLS Grid
- 2026-02-23 Price Changed $227,385 Stellar MLS as Distributed by MLS Grid
- 2026-02-22 Price Changed $227,386 Stellar MLS as Distributed by MLS Grid
- 2026-02-20 Price Changed $227,486 Stellar MLS as Distributed by MLS Grid
- 2026-02-19 Price Changed $227,487 Stellar MLS as Distributed by MLS Grid
- 2026-02-18 Price Changed $227,488 Stellar MLS as Distributed by MLS Grid
- 2026-02-17 Price Changed $227,489 Stellar MLS as Distributed by MLS Grid
- 2026-02-16 Price Changed $227,490 Stellar MLS as Distributed by MLS Grid
- 2026-02-14 Price Changed $227,491 Stellar MLS as Distributed by MLS Grid
- 2026-02-13 Price Changed $227,591 Stellar MLS as Distributed by MLS Grid
- 2026-02-12 Price Changed $227,592 Stellar MLS as Distributed by MLS Grid
- 2026-02-11 Price Changed $227,593 Stellar MLS as Distributed by MLS Grid
- 2026-02-10 Price Changed $227,594 Stellar MLS as Distributed by MLS Grid
- 2026-02-09 Price Changed $227,595 Stellar MLS as Distributed by MLS Grid
- 2026-02-07 Price Changed $227,596 Stellar MLS as Distributed by MLS Grid
- 2026-02-06 Price Changed $227,696 Stellar MLS as Distributed by MLS Grid
- 2026-02-05 Price Changed $227,697 Stellar MLS as Distributed by MLS Grid
- 2026-02-04 Price Changed $227,698 Stellar MLS as Distributed by MLS Grid
- 2026-02-04 Price Changed $227,697 Stellar MLS as Distributed by MLS Grid
- 2026-02-03 Price Changed $227,698 Stellar MLS as Distributed by MLS Grid
- 2026-01-30 Price Changed $227,699 Stellar MLS as Distributed by MLS Grid
- 2026-01-25 Price Changed $227,799 Stellar MLS as Distributed by MLS Grid
- 2026-01-09 Price Changed $227,899 Stellar MLS as Distributed by MLS Grid
- 2026-01-04 Price Changed $227,999 Stellar MLS as Distributed by MLS Grid
- 2025-12-13 Price Changed $230,999 Stellar MLS as Distributed by MLS Grid
- 2025-12-12 Price Changed $259,499 Stellar MLS as Distributed by MLS Grid
- 2025-12-06 Price Changed $259,599 Stellar MLS as Distributed by MLS Grid
- 2025-11-28 Price Changed $259,699 Stellar MLS as Distributed by MLS Grid
- 2025-11-21 Price Changed $259,799 Stellar MLS as Distributed by MLS Grid
- 2025-11-14 Price Changed $259,699 Stellar MLS as Distributed by MLS Grid
- 2025-11-06 Price Changed $259,799 Stellar MLS as Distributed by MLS Grid
- 2025-10-31 Price Changed $259,899 Stellar MLS as Distributed by MLS Grid
- 2025-10-11 Listed $259,999 Stellar MLS as Distributed by MLS Grid
- 1990-06-01 Sold (Public Records) $7,000 Public Records
Property tax history
+7.3%/yrLatest (2025): $355 · +76.2% YoY. Source: county tax records.
Cash-flow waterfall
monthlySold comps — $/sqft
last 12 mo · ≤1 miLoading sold comps…