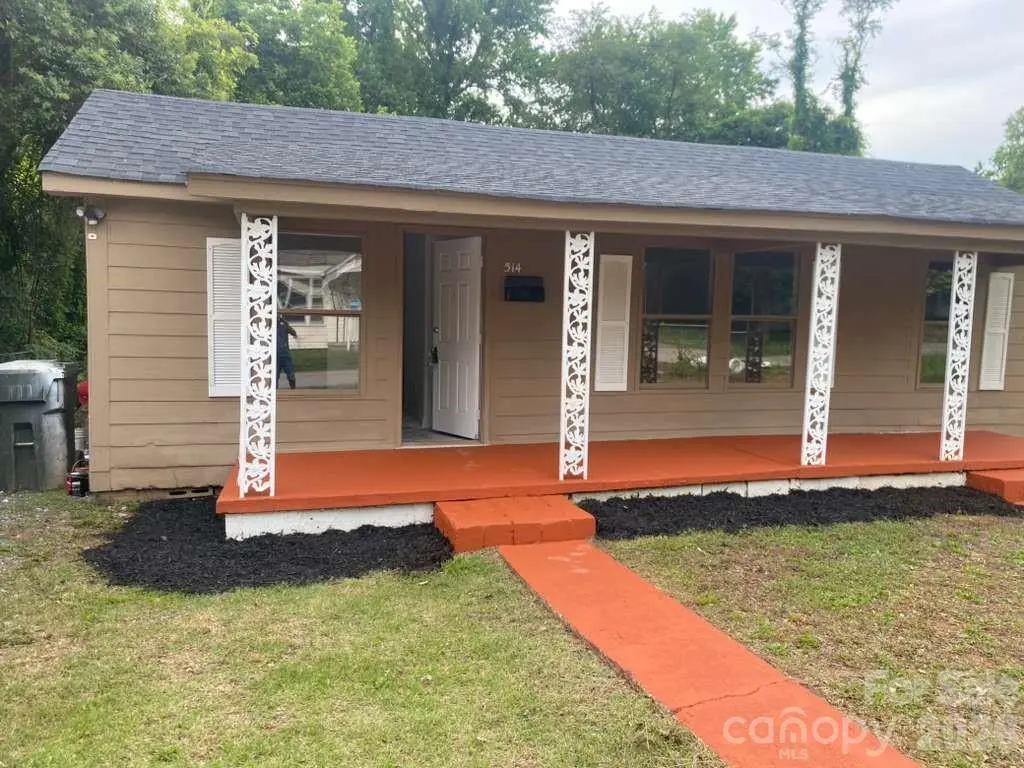
514 Bynum Ave · Rock Hill, SC
Flood risk 1/10 · Minimal
- FEMA flood zone
- X (unshaded)
- Chance of flooding over 30 yrs
- 0.0%
- Est. flood insurance / yr
- $507 – $1,088
Fire risk 3/10 · Minor
- Est. fire insurance / yr
- $783 – $1,453
Heat risk 6/10 · Moderate
- Hot days now (above 105°F)
- 7 days/yr
- Hot days in 30 yrs
- 16 days/yr
Wind risk 6/10 · Moderate
- Chance of severe wind over 30 yrs
- 27.0%
Air-quality risk 3/10 · Minor
- Unhealthy air days now
- 2 days/yr
- Unhealthy air days in 30 yrs
- 3 days/yr
Risk factors via First Street. Map © Google.
Why this score? — see what drove the D+ grade
The composite is a weighted blend of 9 inputs, each scored 0–100. Each bar is that input's sub-score; the figure is the points it added to the 100-point composite (weight × sub-score).
- ARV discount +15.0/15.0
- Cash flow +14.9/30.0
- DSCR +4.6/10.0
- Schools +3.5/10.0
- Livability +3.5/5.0
- 1% rule +3.0/10.0
- Condition / age +2.5/5.0
- Rent growth +2.4/5.0
- Appreciation +0.0/10.0
$194,000
🖨 Deal sheet 📄 Offer letter ✓ Due diligence
Listing remarks MLS
Investor Special – Priced to Sell in Rock Hill! This is your chance to grab a property in Rock Hill at an unbeatable price! Priced to sell fast, this home offers tremendous potential for those looking to renovate and flip or renovate and add to their rental portfolio. Whether you're seeking a long-term rental or a turnaround project, this is an opportunity you won’t want to miss. Act now—this deal won’t last long!
Key facts
- 6,098 sq ft lot
- Built 1930
- Listed 16 days
Property features AI
Finance
- HOA & community: No HOA; not subject to dues
Exterior
- Parking: Driveway
- Utilities: City water; Public sewer
- Home design: Single-family residence (residential); One story; Crawl space foundation
- Construction: Site-built construction; Vinyl exterior
- Exterior features: Dirt and paved road access; Publicly maintained road
Interior
- Kitchen: Electric range, Gas oven, Gas range, Refrigerator
- Bedrooms: 2 bedrooms on the main level
- Flooring: Carpet; Vinyl
- Bathrooms: 1 full bathroom on the main level
- Heating & cooling: Natural gas heating; Window unit(s) for cooling
- Interior features: 5 total rooms; Electric range, Gas oven, Gas range, Refrigerator
- Laundry & utility: Laundry on the main level
Neighborhood map
What this means for you Summary
Snapshot
- This is a 2-bed/1.0-bath single-family listed at $194k.
Deal economics
- At list price, monthly cash flow is $58 ($696/yr) — positive.
- The deal already cash-flows at list — no discount required.
- To meet the 1% rule (rent ≥ 1% of price), the offer needs to be $156k (19.7% below list).
- Recommended offer: $156k (19.7% below list) — sets the bar for 1% rule.
- Cap rate 6.7% vs local median 3.4% in Rock Hill — top-decile yield for the area; either an underpriced asset or a hidden risk that comps aren't pricing in. Stress-test before assuming the spread holds.
Location & tenants
- Location reads 70/100 on livability (#62 in SC) — a middle-class / working-renter tenant base. Strengths: cost of living A+, housing A+, health & safety A+; Watch: employment D+, crime D-, amenities D-.
- York 03 (urban): math 36% / reading 47% proficiency, ranked #32 of 80 in SC (top 40%) — families likely to look elsewhere, expect single-tenant / working-renter base with shorter leases.
- Zoned schools: Richmond Drive Elementary (math 37% / reading 42%, grade F, #295 of 597 statewide, top 50%, 478 students, 100% FRL); Northwestern High (math 35% / reading 84%, grade C+, #110 of 196 statewide, top 58%, 1,774 students, 52% FRL) — zoned schools average 76% FRL vs 49% district-wide (26 pts higher); higher-poverty schools than district average — tighter screening recommended.
- Market conditions: Rents soft (-0.2%/yr); 370 active listings in the ZIP; 30 comparable units currently listed for rent nearby; rentals at typical pace (median 22d on market — plan ~3-4 weeks tenant-placement turnaround); solid renter incomes; 2,550 units permitted in York County in 2024 (350 in 5+ unit buildings).
Forward outlook
- Local home prices are declining (-3.0%/yr); year-one equity from $1k of loan paydown is wiped out by about $6k of value loss. Plan a longer hold.
- York County population projected at +44% by 2050 — long-run rental-demand tailwind backs the buy-and-hold thesis.
Negotiation context
- It's been on market 16 days — a 2% lower offer ($191k) is reasonable based on typical stale-listing flexibility.
- 4 sale attempts since 2y ago with the ask held roughly flat each time — persistent listings suggest the price (not the market) is what's stuck; bring a comps-based counter.
- Current owner paid $75k; list at $194k implies a 159% gain — meaningful room to come down on a strong offer.
Risks & watch-outs
- Watch-outs: built in 1930 — expect roof / HVAC / electrical / plumbing capex.
- Climate carrying-cost: major wind risk, 27% chance of damaging wind over 30y; extreme-heat days projected 7→16/yr by 2055 (HVAC capex compounding) — expect insurance premiums to compound above CPI over the hold.
Questions for the listing agent
- Built in 1930 — when were the roof, HVAC, electrical panel, plumbing, and water heater last replaced?
- Is there a deadline driving the sale (1031 exchange, divorce, estate, relocation)? That informs how much negotiation room exists.
- Schools are D-rated, which usually means shorter tenancies and higher turnover. Who's the typical renter profile here, and what's been the actual vacancy rate?
- Crime grade is D in this area — have there been break-ins, vandalism, or insurance claims at this property in the last 3 years? What carrier currently insures it and at what premium?
- The area grade is low — what's the realistic commute time and amenity access for the typical tenant pool here? Any planned neighborhood developments (good or bad) we should know about?
- What's the average days-on-market for RENTAL listings here right now (not sales)? A rising rental-DOM trend means longer vacancies and softer asking-rent achievability than the comps imply.
- What's the recent tenant-quality profile in this submarket — average credit score on applications, eviction rate, late-payment / NSF rate, and stable-employment percentage? A property-management company in the area should have these aggregated.
- How much new for-sale + rental construction is in the pipeline within 1–3 miles? Heavy new supply typically softens prices + rents 12–24 months out; constrained supply supports both.
Investment metrics
- 1% rule
- 0.80% ✗
- Cap rate
- 6.65%
- Cash-on-cash
- 1.28%
- DSCR
- 1.06
- GRM
- 10.4
CMA / ARV
- ARV (on-the-fly)
- $268,888
- Comps found
- 12
Show comp detail 12 sales within ~0.75 mi
| Address | Dist | Beds/Ba | Sqft | Sold | Price | $/sf | Match |
|---|---|---|---|---|---|---|---|
| 1219 Calhoun St | 0.19mi | 3/2.0 (+1) | 1,164 (+0%) | 4mo | $257,500 | $221 | 78 |
| 723 Finley Rd | 0.41mi | 2/1.0 | 1,243 (+7%) | 1mo | $225,000 | $181 | 68 |
| 733 York Ave S | 0.31mi | 2/1.0 | 1,060 (-8%) | 4mo | $200,000 | $189 | 68 |
| 218 Morgan St | 0.54mi | 2/2.0 | 1,184 (+2%) | 2mo | $250,000 | $211 | 66 |
| 816 Horseman Dr | 0.39mi | 3/2.0 (+1) | 1,100 (-5%) | 1mo | $254,900 | $232 | 64 |
| 851 Gist Rd | 0.44mi | 3/2.0 (+1) | 1,187 (+2%) | 6mo | $280,000 | $236 | 62 |
| 1441 Spring View Ct | 0.52mi | 3/2.0 (+1) | 1,152 (-1%) | 7mo | $283,000 | $246 | 60 |
| 1024 Westover Cir | 0.30mi | 3/1.0 (+1) | 1,000 (-14%) | 2mo | $235,000 | $235 | 57 |
| 836 Gist Rd | 0.40mi | 3/2.0 (+1) | 1,020 (-12%) | 3mo | $249,900 | $245 | 50 |
| 235 Florence St | 0.62mi | 2/2.0 | 1,024 (-12%) | 3mo | $165,000 | $161 | 45 |
| 226 N Columbia Ave | 0.52mi | 3/2.0 (+1) | 1,328 (+15%) | 3mo | $285,000 | $215 | 40 |
| 15 Wright St | 0.73mi | 3/2.0 (+1) | 1,000 (-14%) | 6mo | $238,000 | $238 | 29 |
Match score weights: distance 35% · size 25% · config 20% · recency 20%. Top-matched comps best support the ARV.
Projected returns pro-forma
-3.0% appreciation · 0.0% rent growth · sell at horizon
- IRR
- -17.3%
- Equity multiple
- 0.40×
- Total profit
- $-32,384
- Equity at exit
- $28,926
- IRR
- -15.3%
- Equity multiple
- 0.24×
- Total profit
- $-41,402
- Equity at exit
- $16,774
Cash invested: $54,320 (down + closing). Projections, not guarantees.
Landlord ↔ Tenant lean methodology
- Overall (STATE)
- 90 Strongly Landlord-Friendly
- State South Carolina
- 90 Strongly Landlord-Friendly · R+6
- County
- — inherits STATE
- City
- — inherits STATE
ZIP-level market 29732
- Rents YoY
- -0.2%
- Active inventory
- 370
- Price-to-rent
- 10.4×
Monthly cashflow live
- Estimated rent
- $1,557 high interval (Pro) →
- Mortgage (P&I)
- −$1,017
- Tax from tax record
- −$74 /mo · $888/yr
- Insurance
- −$81
- HOA
- −$0
- Vacancy / Maint / Mgmt
- −$327
- Net cashflow
- $58
Break-even live
UW: 25.0% down · 7.5% · 30yr · 1.5% tax · 5.0% vac · 8.0% maint · 8.0% mgmt
Financing live
Cash to close
- Down payment
- $48,500
- Closing costs
- $5,820
- Reserves months
- —
- Total cash needed
- —
Loan-product check · same deal, 3 products live
Conventional
25% down · 7.5% · 30yr
- Down + closing
- —
- Monthly P&I
- —
- Monthly cashflow
- —
- DSCR
- —
- Eligible?
- —
Personal DTI + credit; lowest rate.
DSCR
20% down · 8.5% · 30yr
- Down + closing
- —
- Monthly P&I
- —
- Monthly cashflow
- —
- DSCR
- —
- Eligible?
- —
No personal income docs; deal must DSCR.
Hard money
10% down · 12.0% · 12mo
- Down + closing
- —
- Monthly P&I
- —
- Monthly cashflow
- —
- DSCR
- —
- Eligible?
- —
Short-term bridge; refi at stabilization.
Rent comps 30 comps
| Address | Beds | Baths | Sqft | Rent | $/sqft | DOM | Units | Dist |
|---|---|---|---|---|---|---|---|---|
| 216 McFadden St Rock Hill, SC | 2.0 | 2.0 | 984 | $1,450 | $1.47 | 15d | 1 | 0.33mi |
| 1128 Westover Cir Rock Hill, SC | 3.0 | 1.0 | 1119 | $1,495 | $1.34 | 24d | 1 | 0.37mi |
| 810 S York Ave Rock Hill, SC | 1.0–3.0 | 1.0 | 787 | $1,249 | $1.59 | 2d | 10 | 0.42mi |
| 1247 Spring View Ct Rock Hill, SC | 3.0 | 2.0 | 1248 | $1,210 | $0.97 | 20d | 1 | 0.55mi |
| 1292 Liberty Bell Ct Rock Hill, SC | 2.0 | 2.5 | 1280 | $2,200 | $1.72 | 24d | 1 | 0.56mi |
| 1264 Liberty Bell Ct Rock Hill, SC | 3.0 | 2.5 | 1120 | $1,795 | $1.60 | 18d | 1 | 0.57mi |
| 333 Friendship Dr Rock Hill, SC | 3.0 | 2.0 | 1158 | $1,460 | $1.26 | 22d | 1 | 0.60mi |
| 1084 Constitution Park Blvd Rock Hill, SC | 2.0 | 2.5 | 1338 | $1,750 | $1.31 | 22d | 1 | 0.62mi |
| 1037 Constitution Park Blvd Rock Hill, SC | 2.0 | 2.5 | 1118 | $1,570 | $1.40 | 4d | 1 | 0.63mi |
| 1112 Camden Ave Unit 108 Rock Hill, SC | 2.0 | 1.5 | 1000 | $1,350 | $1.35 | 24d | 1 | 0.81mi |
| 1112 Camden Ave Unit 104 Rock Hill, SC | 2.0 | 1.5 | 1000 | $1,350 | $1.35 | 18d | 1 | 0.81mi |
| 371 Technology Center Way Rock Hill, SC | 1.0–2.0 | 1.0–2.0 | 832 | $2,155 | $2.59 | 3d | 37 | 0.82mi |
| 378 Technology Center Way Rock Hill, SC | 1.0 | 1.0 | 622 | $1,720 | $2.77 | 3d | 7 | 0.86mi |
| 244 Rhea St Rock Hill, SC | 2.0 | 1.0 | 1200 | $1,225 | $1.02 | 20d | 1 | 0.89mi |
| 211 Garden Way Rock Hill, SC | 2.0 | 1.0–1.5 | 631 | $1,275 | $2.02 | 24d | 1 | 0.89mi |
| 1711 Wallick Ln Rock Hill, SC | 1.0–3.0 | 1.0–2.0 | 940 | $1,500 | $1.60 | 2d | 1 | 1.01mi |
| 175 W Black St Unit 304 Rock Hill, SC | 2.0 | 2.0 | 1248 | $1,685 | $1.35 | 24d | 1 | 1.02mi |
| 175 W Black St Rock Hill, SC | 1.0–2.0 | 1.0–2.0 | 1021 | $1,685 | $1.65 | 20d | 11 | 1.02mi |
| 175 W Black St Unit 211 Rock Hill, SC | 1.0 | 1.0 | 824 | $1,440 | $1.75 | 24d | 1 | 1.02mi |
| 207 Friedheim Rd Rock Hill, SC | 3.0 | 1.0 | 1000 | $1,549 | $1.55 | 3d | 1 | 1.11mi |
| 154 Shurley St #101 Rock Hill, SC | 2.0 | 1.0 | 800 | $1,000 | $1.25 | 22d | 1 | 1.14mi |
| 180 Glenwood Dr Unit 1612 Rock Hill, SC | 2.0 | 2.0 | 1275 | $1,450 | $1.14 | 24d | 1 | 1.18mi |
| 108 E Main St Rock Hill, SC | 1.0–2.0 | 1.0–2.0 | 779 | $1,893 | $2.43 | 2d | 7 | 1.22mi |
| 618 Union Ave Rock Hill, SC | 2.0 | 2.0 | 1050 | $1,475 | $1.40 | 16d | 1 | 1.22mi |
| 117 E White St Rock Hill, SC | 2.0 | 1.0–2.0 | 797 | $2,065 | $2.59 | 4d | 33 | 1.29mi |
| 608 Crawford Rd Rock Hill, SC | 3.0 | 2.0 | 1400 | $2,150 | $1.54 | 22d | 1 | 1.29mi |
| 304 Oak Dr Rock Hill, SC | 2.0 | 1.0 | 1349 | $1,650 | $1.22 | 24d | 1 | 1.32mi |
| 285 Herlong Ave Unit F Rock Hill, SC | 2.0 | 1.5 | 992 | $1,325 | $1.34 | 24d | 1 | 1.39mi |
| 764 McDow Dr Rock Hill, SC | 3.0 | 2.0 | 1063 | $1,975 | $1.86 | 24d | 1 | 1.43mi |
| 1004 Kensington Sq Rock Hill, SC | 2.0 | 1.5 | 990 | $1,345 | $1.36 | 22d | 4 | 1.45mi |
Listing history 10 events
-
2026-06-18days on market $194,000 Active 16 DOM
-
2026-06-17pricedays on market $194,000 Active 15 DOM
-
2026-06-16days on market $195,000 Active 14 DOM
-
2026-06-15days on market $195,000 Active 13 DOM
-
2026-06-13days on market $195,000 Active 11 DOM
-
2026-06-09days on market $195,000 Active 7 DOM
-
2026-06-08days on market $195,000 Active 6 DOM
-
2026-06-07days on market $195,000 Active 5 DOM
-
2026-06-04days on market $195,000 Active 2 DOM
-
2026-06-03$195,000 Active 1 DOM
ⓘ Source: listings_history table (triggers on properties + properties_extension) + one-shot
backfill from property_details.listing_events for pre-trigger history.
Tax reassessment forecast SC · Resets to sale price
- Current annual tax
- $888 · $74/mo
- Projected year-2 tax
- $1,106 · $92/mo
- Expected delta
- +$218/yr (+$18/mo · 24.6%)
ⓘ Screening estimate from a state-policy table — verify with the county assessor before closing.
Climate risk First Street
- Flood 1/10 Low FEMA zone X (unshaded) · 0% chance over 30 yrs
- Wildfire 3/10 Moderate
- Heat 6/10 Major 7 d/yr ≥105°F today · 16 d/yr by 30 yrs out
- Wind 6/10 Major 27% chance of damaging wind over 30 yrs
- Air quality 3/10 Moderate 2 unhealthy d/yr today · 3 by 30 yrs out
Nearby sold comps map
Loading sold comps map…
Walkable amenities ~0.75 mi
Loading nearby amenities…
Taxation est. · year 1
- Rental income
- $18,686
- − Mortgage interest
- −$10,867
- − Property taxes
- −$888
- − Insurance
- −$970
- − Repairs & maintenance
- −$1,495
- − Management
- −$1,495
- − Depreciation
- −$5,644
- Taxable loss
- −$2,672
- Est. tax savings @ 24.0%
- +$641
- After-tax cash flow
- $1,338/yr
For passive investors: Depreciation is non-cash, so a rental often shows a tax loss while cash-flowing — sheltering income. Rental losses are passive: they offset passive income freely, and up to $25,000/yr can offset ordinary (W-2) income if you actively participate and your MAGI is under $100k (phasing out to $0 by $150k); unused losses carry forward. On sale, claimed depreciation is recaptured at up to 25%, and gains may owe capital-gains tax (a 1031 exchange can defer both). Figures are a year-1 estimate at your 24.0% rate — not tax advice; consult a CPA.
Schools (NCES district)
- District
- York 03
- NCES district ID
- 4503870
- Math proficiency
- 36% ▼ -8.00%
- Reading proficiency
- 47% ▲ 3.00%
- Median HH income
- $47,570
- Composite
- 35.46/100
- National rank
- #4928
- State rank
- #32 of 80 in SC
Livability — Rock Hill
- Score
- 70/100
- State rank
- #62
- US rank
- #7573
Category grades
Schools grade is shown separately in the Schools card above.
Census & demographics
- Census place
- Rock Hill, SC
- County
- York County · 281,758 people
- City population
- 115,874
- Metro
- Charlotte-Concord-Gastonia, NC-SC
- Population (ZIP)
- 57,675
- Household income
- $84,937
- Rent vs Own
- Severe rent burden
- 1774.0
Population outlook (York County) Hauer SSP2
- Today (2025)
- 307,757 people
- By 2030
- 335,979 · +9.2%
- By 2040
- 391,378 · +27.2%
- By 2050
- 443,234 · +44.0%
- By 2075
- 557,102 · +81.0%
- By 2100
- 625,837 · +103.4%
Race, ethnicity, and origin ACS 2023
- Neighborhood character
- Predominantly White (66%)
- Race & ethnicity
- White 66% Black 21% Hispanic / Latino 7% Two or more races 6% Asian 2%
- Hispanic origin (detail)
- Mexican 3%
- Common ancestry
- Serbian 4% Slovak 3% Romanian 2%
- Foreign-born
- 5% · Canada
- Languages at home
- 92% English-only · Spanish 5% Other Indo-European 1%
Political lean MEDSL · York
- 2024 margin
- R (+19.1) · D 39.7% · R 58.8% · Other 1.5%
- 2008→2024 swing
- -1.4pp toward R · 2008: -17.7pp · 2024: -19.1pp
- All cycles
- 2024: R+19.1 2020: R+16.5 2016: R+22.1 2012: R+20.5 2008: R+17.7
Not yet ingested
- Civics
- —
Market trends
- HPI YoY
- ▼ -257.27%
- Current HPI
- 239.0701
- Rent YoY
- ▼ -0.25%
- Metro
- Charlotte-Concord-Gastonia, NC-SC
- State GDP YoY
- ▲ 4.51%
- F500 in state
- 2
Industry mix (Fortune 500 HQ in SC)
| Industry | F500 HQs | Revenue |
|---|---|---|
| Packaging | 1 | $7B |
|
||
Price history
+129.7% since first listed8 events — show timeline
- 2026-06-03 Listed $195,000 CANOPYMLS as Distributed by MLS Grid
- 2026-03-03 Listed $198,000 SPMLS
- 2025-01-08 Sold (Public Records) $75,000 Public Records
- 2025-01-08 Sold (MLS) $75,000 CANOPYMLS as Distributed by MLS Grid
- 2024-12-30 Contingent — CANOPYMLS as Distributed by MLS Grid
- 2024-12-23 Relisted — CANOPYMLS as Distributed by MLS Grid
- 2024-11-19 Contingent — CANOPYMLS as Distributed by MLS Grid
- 2024-11-15 Listed $84,900 CANOPYMLS as Distributed by MLS Grid
Property tax history
+4.8%/yrLatest (2025): $888 · +67.5% YoY. Source: county tax records.
Cash-flow waterfall
monthlySold comps — $/sqft
last 12 mo · ≤1 miLoading sold comps…