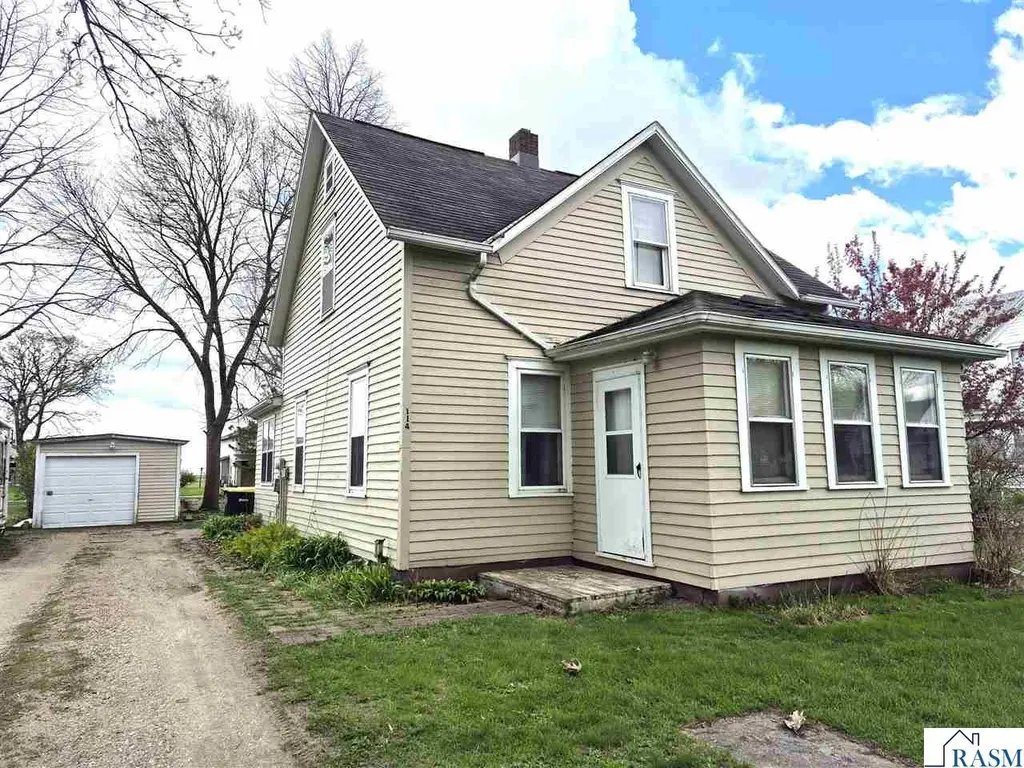
114 SW 1st Ave · Fairfax, MN
Flood risk 1/10 · Minimal
- FEMA flood zone
- X (unshaded)
- Chance of flooding over 30 yrs
- 0.0%
- Est. flood insurance / yr
- $473 – $860
Fire risk 1/10 · Minimal
- Est. fire insurance / yr
- $888 – $1,650
Heat risk 2/10 · Minimal
- Hot days now (above 99°F)
- 7 days/yr
- Hot days in 30 yrs
- 15 days/yr
Wind risk 2/10 · Minimal
- Chance of severe wind over 30 yrs
- —
Air-quality risk 1/10 · Minimal
- Unhealthy air days now
- 0 days/yr
- Unhealthy air days in 30 yrs
- 0 days/yr
Risk factors via First Street. Map © Google.
Why this score? — see what drove the B+ grade
The composite is a weighted blend of 9 inputs, each scored 0–100. Each bar is that input's sub-score; the figure is the points it added to the 100-point composite (weight × sub-score).
- Cash flow +30.0/30.0
- 1% rule +10.0/10.0
- DSCR +10.0/10.0
- Appreciation +10.0/10.0
- ARV discount +7.5/15.0
- Schools +3.8/10.0
- Livability +3.7/5.0
- Rent growth +2.5/5.0
- Condition / age +2.5/5.0
$52,500
🖨 Deal sheet (PDF) 📄 Offer letter ✓ Due diligence
Listing remarks
Make it your own! This southside home rests on super sized 75x 202 lot. with flower beds and large garden . 3bedroom/ 2bath home.
Key facts
- Super sized lot
- Large garden
- 0.34 acre lot
Tags
Property features AI
Finance
- Other: Property type: Residential
Exterior
- Parking: Gravel parking; 1-car garage
- Utilities: Public water; Public sewer
- Home design: Single-family residential property
- Construction: Vinyl siding; Wood siding; 960 above-grade finished area
- Exterior features: Asphalt roof; Publicly maintained road access
Interior
- Kitchen: Electric water heater
- Flooring: Hardwood flooring
- Bathrooms: Two three-quarter bathrooms
- Heating & cooling: Electric heating; Oil heating; Forced air
- Interior features: Eat-in kitchen; Unfinished partial basement
Neighborhood map
What this means for you Summary
Snapshot
- This is a 3-bed/2.0-bath single-family listed at $52k.
Deal economics
- At list price, monthly cash flow is $301 ($4k/yr) — positive.
- The deal already cash-flows at list — no discount required.
- Meets the 1% rule at list price ($811 rent vs $52k).
Location & tenants
- Location reads 73/100 on livability (#261 in MN) — a middle-class / working-renter tenant base. Strengths: crime A+, cost of living A+, housing A+; Watch: health & safety D+, amenities F, commute F.
- G.F.W. (rural): math 40% / reading 48% proficiency, ranked #186 of 301 in MN (top 62%) — families likely to look elsewhere, expect single-tenant / working-renter base with shorter leases.
- Market conditions: 13 active listings in the ZIP; 1 comparable units currently listed for rent nearby; 17 units permitted in Renville County in 2024 (0 in 5+ unit buildings).
Forward outlook
- In year one you build about $6k of equity ($363 loan paydown + $5k appreciation (10.0% local appreciation)).
- Renville County population projected at -28% by 2050 — secular population decline; favor cash flow + early exit over multi-decade hold.
- At projected returns (10.0% appreciation + 3.0% rent growth), your $15k cash investment doubles in ~2 years — after that, you're playing with house money.
- By year 6, paydown + projected appreciation supports a ~$33k cash-out refi (75% LTV) — recoverable capital for the next deal without selling this one.
Negotiation context
- Only 8 days on market — expect competitive offers; lowballing is unlikely to land.
Risks & watch-outs
- Watch-outs: built in 1905 — expect roof / HVAC / electrical / plumbing capex.
Questions for the listing agent
- Built in 1905 — when were the roof, HVAC, electrical panel, plumbing, and water heater last replaced?
- Is there a deadline driving the sale (1031 exchange, divorce, estate, relocation)? That informs how much negotiation room exists.
- What's the average days-on-market for RENTAL listings here right now (not sales)? A rising rental-DOM trend means longer vacancies and softer asking-rent achievability than the comps imply.
- What's the recent tenant-quality profile in this submarket — average credit score on applications, eviction rate, late-payment / NSF rate, and stable-employment percentage? A property-management company in the area should have these aggregated.
- How much new for-sale + rental construction is in the pipeline within 1–3 miles? Heavy new supply typically softens prices + rents 12–24 months out; constrained supply supports both.
Investment metrics
- 1% rule
- 1.54% ✓
- Cap rate
- 13.18%
- Cash-on-cash
- 24.60%
- DSCR
- 2.09
- GRM
- 5.4
CMA / ARV
- ARV (on-the-fly)
- $105,792
- Comps found
- 2
Show comp detail 2 sales within ~0.75 mi
| Address | Dist | Beds/Ba | Sqft | Sold | Price | $/sf | Match |
|---|---|---|---|---|---|---|---|
| 114 SW 1st Ave | 0.00mi | 3/2.0 | 960 (+3%) | 0mo | $47,000 | $49 | 94 |
| 206 1st Ave Ave NE | 0.44mi | 4/1.0 (+1) | 993 (+7%) | 22mo | $113,400 | $114 | 41 |
Match score weights: distance 35% · size 25% · config 20% · recency 20%. Top-matched comps best support the ARV.
Projected returns pro-forma
10.0% appreciation · 3.0% rent growth · sell at horizon
- IRR
- 42.8%
- Equity multiple
- 4.25×
- Total profit
- $47,783
- Equity at exit
- $47,296
- IRR
- 37.0%
- Equity multiple
- 9.55×
- Total profit
- $125,615
- Equity at exit
- $101,996
Cash invested: $14,700 (down + closing). Projections, not guarantees.
Landlord ↔ Tenant lean methodology
- Overall (STATE)
- 46 Balanced
- State Minnesota
- 46 Balanced · D+2
- County
- — inherits STATE
- City
- — inherits STATE
ZIP-level market 55332
- Home prices YoY
- 5.2%
- Active inventory
- 13
- Price-to-rent
- 5.4×
Monthly cashflow live
- Estimated rent
- $811 medium interval (Pro) →
- Mortgage (P&I)
- −$275
- Tax from tax record
- −$42 /mo · $506/yr
- Insurance
- −$22
- HOA
- −$0
- Vacancy / Maint / Mgmt
- −$170
- Net cashflow
- $301
Break-even live
Sensitivity live
| Price | -10% $331 | -5% $316 | +0% $301 | +5% $286 | +10% $272 |
|---|---|---|---|---|---|
| Rent | -10% $237 | -5% $269 | +0% $301 | +5% $333 | +10% $365 |
| Rate | -1.0pp $328 | -0.5pp $315 | base $301 | +0.5pp $288 | +1.0pp $274 |
UW: 25.0% down · 7.5% · 30yr · 1.5% tax · 5.0% vac · 8.0% maint · 8.0% mgmt
Financing live
Cash to close
- Down payment
- $13,125
- Closing costs
- $1,575
- Reserves months
- —
- Total cash needed
- —
Loan-product check · same deal, 3 products live
Conventional
25% down · 7.5% · 30yr
- Down + closing
- —
- Monthly P&I
- —
- Monthly cashflow
- —
- DSCR
- —
- Eligible?
- —
Personal DTI + credit; lowest rate.
DSCR
20% down · 8.5% · 30yr
- Down + closing
- —
- Monthly P&I
- —
- Monthly cashflow
- —
- DSCR
- —
- Eligible?
- —
No personal income docs; deal must DSCR.
Hard money
10% down · 12.0% · 12mo
- Down + closing
- —
- Monthly P&I
- —
- Monthly cashflow
- —
- DSCR
- —
- Eligible?
- —
Short-term bridge; refi at stabilization.
Rent comps 1 comps
| Address | Beds | Baths | Sqft | Rent | $/sqft | DOM | Units | Dist |
|---|---|---|---|---|---|---|---|---|
| 11 Park St N Fairfax, MN | 2.0 | 1.0 | 700 | $811 | $1.16 | 44d | 1 | 0.25mi |
Listing history 2 events
-
2026-05-13status Pending
-
2026-05-05$52,500 Active
ⓘ Source: listings_history table (triggers on properties + properties_extension) + one-shot
backfill from property_details.listing_events for pre-trigger history.
Tax reassessment forecast MN · Partial reset (capped growth)
- Current annual tax
- $506 · $42/mo
- Projected year-2 tax
- $547 · $46/mo
- Expected delta
- +$41/yr (+$3/mo · 8.1%)
ⓘ Screening estimate from a state-policy table — verify with the county assessor before closing.
Climate risk First Street
- Flood 1/10 Low FEMA zone X (unshaded) · 0% chance over 30 yrs
- Wildfire 1/10 Low
- Heat 2/10 Low 7 d/yr ≥99°F today · 15 d/yr by 30 yrs out
- Wind 2/10 Low
- Air quality 1/10 Low 0 unhealthy d/yr today · 0 by 30 yrs out
Nearby sold comps map
Loading sold comps map…
Walkable amenities ~0.75 mi
Loading nearby amenities…
Taxation est. · year 1
- Rental income
- $9,732
- − Mortgage interest
- −$2,941
- − Property taxes
- −$506
- − Insurance
- −$262
- − Repairs & maintenance
- −$779
- − Management
- −$779
- − Depreciation
- −$1,527
- Taxable income
- $2,938
- Est. tax owed @ 24.0%
- −$705
- After-tax cash flow
- $2,911/yr
For passive investors: Depreciation is non-cash, so a rental often shows a tax loss while cash-flowing — sheltering income. Rental losses are passive: they offset passive income freely, and up to $25,000/yr can offset ordinary (W-2) income if you actively participate and your MAGI is under $100k (phasing out to $0 by $150k); unused losses carry forward. On sale, claimed depreciation is recaptured at up to 25%, and gains may owe capital-gains tax (a 1031 exchange can defer both). Figures are a year-1 estimate at your 24.0% rate — not tax advice; consult a CPA.
Schools (NCES district)
- District
- G.F.W.
- NCES district ID
- 2712580
- Math proficiency
- 40% ▼ -12.00%
- Reading proficiency
- 48% ▼ -13.00%
- Median HH income
- $50,233
- Composite
- 37.81/100
- National rank
- #4335
- State rank
- #186 of 301 in MN
Livability — Fairfax
- Score
- 73/100
- State rank
- #261
- US rank
- #5692
Category grades
Schools grade is shown separately in the Schools card above.
Census & demographics
- Census place
- Fairfax, MN
- Population (ZIP)
- 1,714
Population outlook (Renville County) Hauer SSP2
- Today (2025)
- 13,251 people
- By 2030
- 12,443 · -6.1%
- By 2040
- 10,946 · -17.4%
- By 2050
- 9,598 · -27.6%
- By 2075
- 7,411 · -44.1%
- By 2100
- 5,768 · -56.5%
Race, ethnicity, and origin ACS 2023
- Neighborhood character
- Predominantly White (78%)
- Race & ethnicity
- White 78% Hispanic / Latino 17% Two or more races 12% Asian 1%
- Hispanic origin (detail)
- Mexican 15% Cuban 2%
- Common ancestry
- Portuguese 12% Italian 4% Scottish 1%
- Foreign-born
- 10% · Canada, Jamaica
- Languages at home
- 86% English-only · Spanish 12% German/W. Germanic 1% Other Asian/Pacific 1%
Political lean MEDSL · Renville
- 2024 margin
- Solid R (+41.4) · D 28.4% · R 69.8% · Other 1.9%
- 2008→2024 swing
- -40.8pp toward R · 2008: -0.6pp · 2024: -41.4pp
- All cycles
- 2024: R+41.4 2020: R+36.5 2016: R+36.7 2012: R+9.8 2008: R+0.6
Not yet ingested
- Civics
- —
Market trends
- HPI YoY
- ▲ 12.54%
- Current HPI
- 252.2828
- Rent YoY
- —
- Metro
- —
- State GDP YoY
- ▲ 2.41%
- F500 in state
- 34
Industry mix (Fortune 500 HQ in MN)
| Industry | F500 HQs | Revenue |
|---|---|---|
| Healthcare | 2 | $407B |
|
||
| Retail | 2 | $150B |
|
||
| Consumer Goods | 2 | $32B |
|
||
| Industrial Machinery | 2 | $6B |
|
||
| Agriculture | 1 | $40B |
|
||
| Healthcare / Medical Devices | 1 | $32B |
|
||
Price history
2 events — show timeline
- 2026-05-13 Pending — RASM
- 2026-05-05 Listed $52,500 RASM
Property tax history
+3.8%/yrLatest (2026): $506 · +7.2% YoY. Source: county tax records.
Cash-flow waterfall
monthlySold comps — $/sqft
last 12 mo · ≤1 miLoading sold comps…