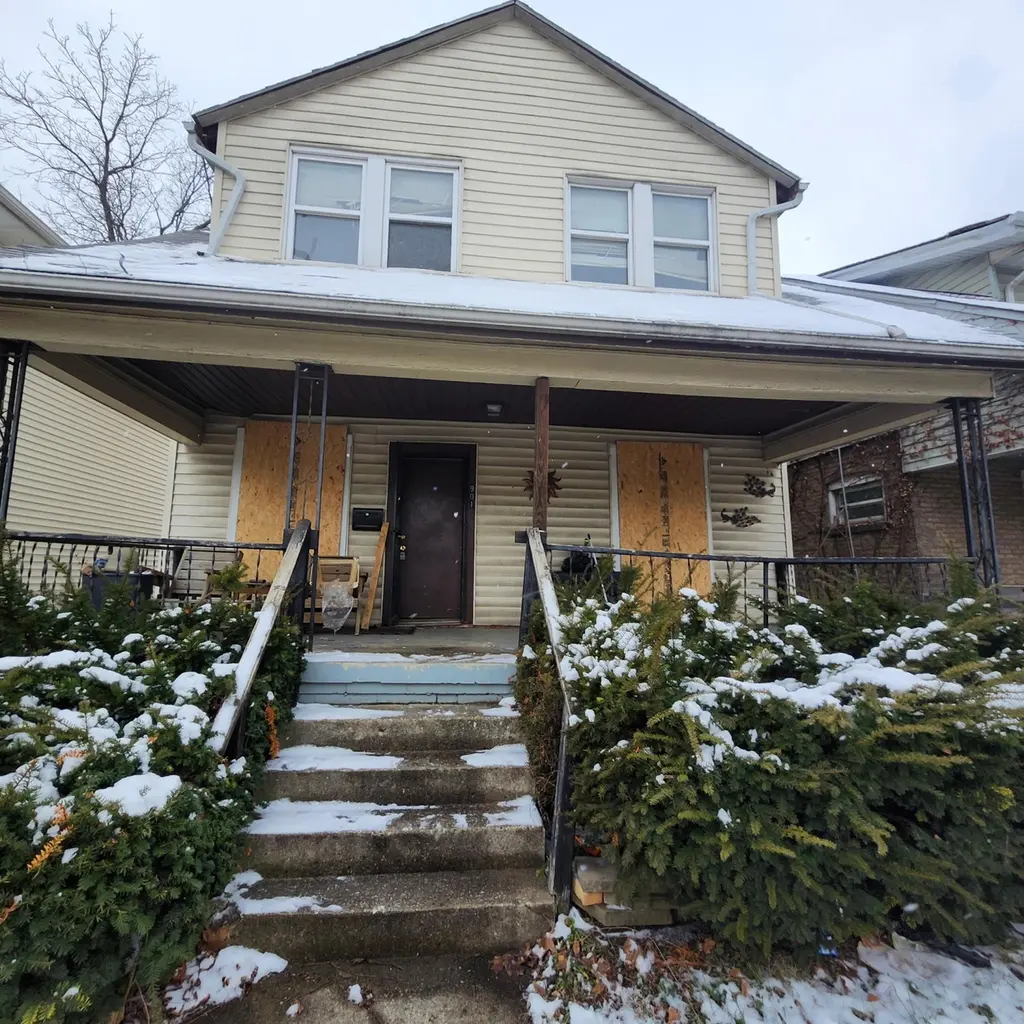
901 Lockbourne Rd · Columbus, OH
Flood risk 1/10 · Minimal
- FEMA flood zone
- X (unshaded)
- Chance of flooding over 30 yrs
- 0.0%
- Est. flood insurance / yr
- $473 – $860
Fire risk 1/10 · Minimal
- Est. fire insurance / yr
- $713 – $1,323
Heat risk 4/10 · Minor
- Hot days now (above 100°F)
- 7 days/yr
- Hot days in 30 yrs
- 17 days/yr
Wind risk 2/10 · Minimal
- Chance of severe wind over 30 yrs
- 1.0%
Air-quality risk 3/10 · Minor
- Unhealthy air days now
- 2 days/yr
- Unhealthy air days in 30 yrs
- 3 days/yr
Risk factors via First Street. Map © Google.
Why this score? — see what drove the B- grade
The composite is a weighted blend of 9 inputs, each scored 0–100. Each bar is that input's sub-score; the figure is the points it added to the 100-point composite (weight × sub-score).
- Cash flow +30.0/30.0
- DSCR +10.0/10.0
- 1% rule +9.8/10.0
- ARV discount +7.5/15.0
- Livability +4.0/5.0
- Rent growth +3.4/5.0
- Condition / age +2.5/5.0
- Schools +1.7/10.0
- Appreciation +0.0/10.0
$123,000
🖨 Deal sheet 📄 Offer letter ✓ Due diligence
Listing remarks MLS
Great Investment opportunity. 2 story home with 3 beds 1 Full bath and a full basement. Lots of room for improvement and creativity! Perfect opportunity for Individuals looking for a fixer upper, flip, brrr, or landlords wanting to add to their portfolio.
Key facts
- 4,791 sq ft lot
- Built 1919
- Listed 107 days
Neighborhood map
What this means for you Summary
Snapshot
- This is a 3-bed/1.0-bath single-family listed at $123k.
Deal economics
- At list price, monthly cash flow is $611 ($7k/yr) — positive.
- The deal already cash-flows at list — no discount required.
- Meets the 1% rule at list price ($2k rent vs $123k).
- Recommended offer: $112k (9.0% below list) — sets the bar for market timing.
- Cap rate 12.3% vs local median 3.8% in Columbus — top-decile yield for the area; either an underpriced asset or a hidden risk that comps aren't pricing in. Stress-test before assuming the spread holds.
Location & tenants
- Location reads 81/100 on livability (#97 in OH, #1,491 nationally) — a professional / high-income tenant draw. Strengths: commute A+, cost of living A+, housing A+; Watch: employment C-, crime F.
- Columbus City School District (urban): math 15% / reading 26% proficiency, ranked #626 of 656 in OH (top 95%) — low school quality limits family demand, transient renter base, plan for 1-2y turnover; 72% free/reduced lunch — lower-income household profile, screen leases tightly.
- Market conditions: Rents rising (+3.5%/yr); 193 active listings in the ZIP; 40 comparable units currently listed for rent nearby; rentals at typical pace (median 24d on market — plan ~3-4 weeks tenant-placement turnaround); 48% of comp listings sitting > 30 days — soft ceiling on asking rent; solid renter incomes; 8,139 units permitted in Franklin County in 2024 (5,940 in 5+ unit buildings).
Forward outlook
- Local home prices are declining (-3.0%/yr); year-one equity from $850 of loan paydown is wiped out by about $4k of value loss. Plan a longer hold.
- Franklin County population projected at +34% by 2050 — long-run rental-demand tailwind backs the buy-and-hold thesis.
- At projected returns (-3.0% appreciation + 3.5% rent growth), your $34k cash investment doubles in ~6 years — after that, you're playing with house money.
Negotiation context
- It's been on market 107 days — a 9% lower offer ($112k) is reasonable based on typical stale-listing flexibility.
- 6 sale attempts since 21y ago; this cycle's ask has dropped $12k (9%) from the opening price — seller is motivated, your offer sets the floor, not the list.
- Current owner paid $98k; 26% above their basis — modest negotiation headroom, anchor on the comps not their cost.
Risks & watch-outs
- Watch-outs: built in 1919 — expect roof / HVAC / electrical / plumbing capex.
Questions for the listing agent
- It's been on market 107 days. Have you received any prior offers? Is the seller open to a 9% concession, seller financing, or rate buy-down credit?
- Built in 1919 — when were the roof, HVAC, electrical panel, plumbing, and water heater last replaced?
- Why hasn't it sold? Are there any deal-killer items the seller is aware of (foundation, flood, title, zoning, code violations)?
- Is there a deadline driving the sale (1031 exchange, divorce, estate, relocation)? That informs how much negotiation room exists.
- Crime grade is F in this area — have there been break-ins, vandalism, or insurance claims at this property in the last 3 years? What carrier currently insures it and at what premium?
- What's the average days-on-market for RENTAL listings here right now (not sales)? A rising rental-DOM trend means longer vacancies and softer asking-rent achievability than the comps imply.
- What's the recent tenant-quality profile in this submarket — average credit score on applications, eviction rate, late-payment / NSF rate, and stable-employment percentage? A property-management company in the area should have these aggregated.
- How much new for-sale + rental construction is in the pipeline within 1–3 miles? Heavy new supply typically softens prices + rents 12–24 months out; constrained supply supports both.
Investment metrics
- 1% rule
- 1.48% ✓
- Cap rate
- 12.26%
- Cash-on-cash
- 21.31%
- DSCR
- 1.95
- GRM
- 5.6
CMA / ARV
- ARV (median comp)
- $280,317
- List price
- $123,000
- Delta
- -56.12%
- Verdict
- UNDERPRICED
- Comps
- 20 within 1.0 mi
Show comp detail 12 sales within ~0.75 mi
| Address | Dist | Beds/Ba | Sqft | Sold | Price | $/sf | Match |
|---|---|---|---|---|---|---|---|
| 675 Oakwood Ave | 0.40mi | 3/1.0 | 1,631 (+1%) | 1mo | $153,000 | $94 | 79 |
| 831 Wilson Ave | 0.22mi | 3/2.5 | 1,586 (-2%) | 2mo | $292,500 | $184 | 79 |
| 1005 Studer Ave | 0.18mi | 3/2.5 | 1,544 (-4%) | 2mo | $272,900 | $177 | 77 |
| 795 S Ohio Ave | 0.45mi | 3/2.5 | 1,535 (-5%) | 2mo | $340,000 | $221 | 64 |
| 1129 Oakwood Ave | 0.50mi | 3/2.5 | 1,540 (-5%) | 2mo | $327,500 | $213 | 62 |
| 1343 Linwood Ave | 0.69mi | 3/1.5 | 1,520 (-6%) | 0mo | $315,000 | $207 | 56 |
| 758 S 18th St | 0.74mi | 3/2.5 | 1,646 (+2%) | 1mo | $350,000 | $213 | 55 |
| 1029 Geers Ave | 0.40mi | 2/1.0 (-1) | 1,412 (-12%) | 1mo | $235,000 | $166 | 54 |
| 935 S Ohio Ave | 0.47mi | 4/2.5 (+1) | 1,735 (+8%) | 1mo | $330,000 | $190 | 54 |
| 987 E Whittier St | 0.46mi | 2/2.0 (-1) | 1,798 (+11%) | 0mo | $235,000 | $131 | 50 |
| 827 S 22nd St | 0.51mi | 4/3.0 (+1) | 1,777 (+10%) | 1mo | $300,000 | $169 | 46 |
| 461 S 22nd St | 0.73mi | 3/2.5 | 1,403 (-13%) | 2mo | $199,000 | $142 | 37 |
Match score weights: distance 35% · size 25% · config 20% · recency 20%. Top-matched comps best support the ARV.
Projected returns pro-forma
-3.0% appreciation · 3.51% rent growth · sell at horizon
- IRR
- 14.4%
- Equity multiple
- 1.58×
- Total profit
- $19,973
- Equity at exit
- $18,340
- IRR
- 23.5%
- Equity multiple
- 3.08×
- Total profit
- $71,511
- Equity at exit
- $10,635
Cash invested: $34,440 (down + closing). Projections, not guarantees.
Landlord ↔ Tenant lean methodology
- Overall (STATE)
- 73 Landlord-Friendly
- State Ohio
- 73 Landlord-Friendly · R+6
- County
- — inherits STATE
- City
- — inherits STATE
ZIP-level market 43206
- Rents YoY
- 3.5%
- Active inventory
- 193
- Price-to-rent
- 5.6×
Monthly cashflow live
- Estimated rent
- $1,826 high interval (Pro) →
- Mortgage (P&I)
- −$645
- Tax from tax record
- −$135 /mo · $1,617/yr
- Insurance
- −$51
- HOA
- −$0
- Vacancy / Maint / Mgmt
- −$383
- Net cashflow
- $611
Break-even live
UW: 25.0% down · 7.5% · 30yr · 1.5% tax · 5.0% vac · 8.0% maint · 8.0% mgmt
Financing live
Cash to close
- Down payment
- $30,750
- Closing costs
- $3,690
- Reserves months
- —
- Total cash needed
- —
Loan-product check · same deal, 3 products live
Conventional
25% down · 7.5% · 30yr
- Down + closing
- —
- Monthly P&I
- —
- Monthly cashflow
- —
- DSCR
- —
- Eligible?
- —
Personal DTI + credit; lowest rate.
DSCR
20% down · 8.5% · 30yr
- Down + closing
- —
- Monthly P&I
- —
- Monthly cashflow
- —
- DSCR
- —
- Eligible?
- —
No personal income docs; deal must DSCR.
Hard money
10% down · 12.0% · 12mo
- Down + closing
- —
- Monthly P&I
- —
- Monthly cashflow
- —
- DSCR
- —
- Eligible?
- —
Short-term bridge; refi at stabilization.
Rent comps 40 comps
| Address | Beds | Baths | Sqft | Rent | $/sqft | DOM | Units | Dist |
|---|---|---|---|---|---|---|---|---|
| 904 Studer Ave Columbus, OH | 3.0 | 1.5 | 1364 | $1,780 | $1.30 | 23d | 1 | 0.04mi |
| 883 Studer Ave Columbus, OH | 4.0 | 2.5 | 2217 | $2,500 | $1.13 | 1d | 1 | 0.05mi |
| 932 Linwood Ave Columbus, OH | 4.0 | 1.5 | 1663 | $2,045 | $1.23 | 43d | 1 | 0.13mi |
| 908 Ellsworth Ave Columbus, OH | 3.0 | 1.0 | 1154 | $1,325 | $1.15 | 3d | 1 | 0.18mi |
| 857 Wilson Ave #859 Columbus, OH | 3.0 | 2.5 | 1527 | $1,650 | $1.08 | 43d | 1 | 0.19mi |
| 988 Linwood Ave Columbus, OH | 4.0 | 3.0 | 1800 | $2,750 | $1.53 | 17d | 1 | 0.20mi |
| 815 Wilson Ave Columbus, OH | 3.0 | 1.5 | 1400 | $1,500 | $1.07 | 7d | 1 | 0.20mi |
| 813 Wilson Ave Unit 1 Columbus, OH | 3.0 | 1.5 | 1400 | $1,500 | $1.07 | 7d | 1 | 0.20mi |
| 1275-1279 E Kossuth St Columbus, OH | 2.0 | 2.0 | 1160 | $1,350 | $1.16 | 43d | 1 | 0.24mi |
| 1026 Ellsworth Ave Columbus, OH | 3.0 | 1.0 | 1100 | $1,295 | $1.18 | 19d | 1 | 0.25mi |
| 730-732 Oakwood Ave Unit 732 Columbus, OH | 3.0 | 1.0 | 1232 | $1,425 | $1.16 | 43d | 1 | 0.30mi |
| 1272 Kent St Columbus, OH | 2.0 | 1.0 | 1152 | $1,250 | $1.09 | 1d | 1 | 0.32mi |
| 1272 Kent St Unit 2 Columbus, OH | 2.0 | 1.0 | 1152 | $1,295 | $1.12 | 21d | 1 | 0.32mi |
| 1056 Wilson Ave Unit B Columbus, OH | 2.0 | 1.0 | 1100 | $1,195 | $1.09 | 17d | 1 | 0.34mi |
| 1056 Wilson Ave Unit A Columbus, OH | 2.0 | 1.0 | 1100 | $1,225 | $1.11 | 43d | 1 | 0.34mi |
| 1106 Ellsworth Ave Columbus, OH | 3.0 | 1.0 | 1150 | $1,495 | $1.30 | 7d | 1 | 0.34mi |
| 1167 E Whittier St Columbus, OH | 3.0 | 1.5 | 1300 | $1,950 | $1.50 | 43d | 1 | 0.35mi |
| 1165-1167 E Whittier St Columbus, OH | 3.0 | 1.5 | 1300 | $1,950 | $1.50 | 43d | 1 | 0.35mi |
| 997 Oakwood Ave Columbus, OH | 3.0 | 1.5 | 1260 | $1,800 | $1.43 | 12d | 1 | 0.36mi |
| 814 S Ohio Ave Columbus, OH | 3.0 | 1.0 | 1380 | $1,600 | $1.16 | 43d | 1 | 0.39mi |
| 685 S Champion Ave Unit 683 Columbus, OH | 3.0 | 1.0 | 1364 | $1,575 | $1.15 | 21d | 1 | 0.40mi |
| 627 Oakwood Ave Columbus, OH | 3.0 | 2.5 | 2009 | $2,379 | $1.18 | 12d | 1 | 0.41mi |
| 773-775 Berkeley Rd Columbus, OH | 3.0 | 1.0 | 1280 | $1,350 | $1.05 | 1d | 1 | 0.41mi |
| 773-775 Berkeley Rd Columbus, OH | 3.0 | 1.0 | 1280 | $1,400 | $1.09 | 21d | 1 | 0.41mi |
| 555 Kimball Pl Columbus, OH | 3.0 | 2.5 | 1252 | $1,785 | $1.43 | 43d | 1 | 0.47mi |
| 977 S Ohio Ave Columbus, OH | 3.0 | 2.5 | 1650 | $2,500 | $1.52 | 43d | 1 | 0.48mi |
| 963 S 22nd St Columbus, OH | 3.0 | 2.0 | 1188 | $3,200 | $2.69 | 7d | 1 | 0.54mi |
| 936 Wagner St Columbus, OH | 3.0 | 3.0 | 1560 | $2,750 | $1.76 | 23d | 1 | 0.55mi |
| 614-616 Lilley Ave Columbus, OH | 3.0 | 1.5 | 1232 | $1,700 | $1.38 | 43d | 1 | 0.55mi |
| 597 Lilley Ave Columbus, OH | 2.0 | 1.5 | 1300 | $1,550 | $1.19 | 43d | 1 | 0.55mi |
| 880 E Whittier St Columbus, OH | 2.0 | 1.5 | 1064 | $1,100 | $1.03 | 43d | 1 | 0.56mi |
| 736 Seymour Ave Columbus, OH | 3.0 | 1.0 | 1176 | $1,350 | $1.15 | 43d | 1 | 0.57mi |
| 1118 S Ohio Ave Columbus, OH | 3.0 | 1.5 | 1232 | $1,750 | $1.42 | 43d | 1 | 0.57mi |
| 864 Fairwood Ave Columbus, OH | 3.0 | 1.0 | 1176 | $1,300 | $1.11 | 43d | 1 | 0.57mi |
| 852-854 Fairwood Ave Columbus, OH | 3.0 | 1.0 | 1176 | $1,295 | $1.10 | 23d | 1 | 0.58mi |
| 854 Fairwood Ave Columbus, OH | 3.0 | 1.0 | 1176 | $1,295 | $1.10 | 43d | 1 | 0.58mi |
| 852-854 Fairwood Ave Columbus, OH | 3.0 | 1.0 | 1176 | $1,295 | $1.10 | 14d | 1 | 0.58mi |
| 850 E Whittier St Columbus, OH | 3.0 | 2.0 | 1200 | $1,949 | $1.62 | 23d | 1 | 0.60mi |
| 558 Lilley Ave Columbus, OH | 3.0 | 1.0 | 1372 | $1,600 | $1.17 | 43d | 1 | 0.62mi |
| 461 Oakwood Ave Columbus, OH | 3.0 | 1.5 | 1386 | $1,845 | $1.33 | 43d | 1 | 0.62mi |
Listing history 28 events
-
2026-06-13statusdays on market $123,000 Pending 107 DOM
-
2026-06-09days on market $123,000 Active 104 DOM
-
2026-06-08days on market $123,000 Active 103 DOM
-
2026-06-07days on market $123,000 Active 102 DOM
-
2026-06-05days on market $123,000 Active 99 DOM
-
2026-06-03days on market $123,000 Active 98 DOM
-
2026-06-02days on market $123,000 Active 97 DOM
-
2026-06-01pricedays on market $123,000 Active 96 DOM
-
2026-05-31days on market $131,000 Active 95 DOM
-
2026-04-02price $131,000 255-char remark
Show marketing remark (255 chars)
Great Investment opportunity. 2 story home with 3 beds 1 Full bath and a full basement. Lots of room for improvement and creativity! Perfect opportunity for Individuals looking for a fixer upper, flip, brrr, or landlords wanting to add to their portfolio.
-
2026-02-25$135,000 Active 255-char remark
Show marketing remark (255 chars)
Great Investment opportunity. 2 story home with 3 beds 1 Full bath and a full basement. Lots of room for improvement and creativity! Perfect opportunity for Individuals looking for a fixer upper, flip, brrr, or landlords wanting to add to their portfolio.
-
2026-02-12soldstatus $98,000
-
2026-02-11soldstatus $98,000 Closed 410-char remark
Show marketing remark (410 chars)
CALLING FOR HIGHEST AND BEST BY NOON ON SATURDAY JANUARY 31, 2026. PLEASE LEAVE OFFERS OPEN UNTIL 6PM ON THE 31ST. This is a great oppportunity for a rehab project. Was a rental, and rented for $1100 a month. They moved out and someone broke in and stole all the wiring and pipes froze. All unitilities have been shut off. Good furnace and hot water tank. Our lose can be your gain. House is being sold AS IS.
-
2026-01-31status Pending 410-char remark
Show marketing remark (410 chars)
CALLING FOR HIGHEST AND BEST BY NOON ON SATURDAY JANUARY 31, 2026. PLEASE LEAVE OFFERS OPEN UNTIL 6PM ON THE 31ST. This is a great oppportunity for a rehab project. Was a rental, and rented for $1100 a month. They moved out and someone broke in and stole all the wiring and pipes froze. All unitilities have been shut off. Good furnace and hot water tank. Our lose can be your gain. House is being sold AS IS.
-
2026-01-28$59,900 Active 410-char remark
Show marketing remark (410 chars)
CALLING FOR HIGHEST AND BEST BY NOON ON SATURDAY JANUARY 31, 2026. PLEASE LEAVE OFFERS OPEN UNTIL 6PM ON THE 31ST. This is a great oppportunity for a rehab project. Was a rental, and rented for $1100 a month. They moved out and someone broke in and stole all the wiring and pipes froze. All unitilities have been shut off. Good furnace and hot water tank. Our lose can be your gain. House is being sold AS IS.
-
2010-05-06soldstatus $8,100
-
2010-04-28historical
-
2010-01-21$10,000
-
2007-05-18soldstatus $40,000
-
2007-04-02historical
-
2007-03-20$44,900
-
2007-02-19historical
-
2006-10-23$90,000
-
2006-02-02soldstatus $79,900
-
2006-01-31soldstatus $79,900
-
2005-12-13historical
-
2005-10-04$79,900
-
1984-05-01soldstatus $33,500
ⓘ Source: listings_history table (triggers on properties + properties_extension) + one-shot
backfill from property_details.listing_events for pre-trigger history.
Tax reassessment forecast OH · Partial reset (capped growth)
- Current annual tax
- $1,617 · $135/mo
- Projected year-2 tax
- $1,768 · $147/mo
- Expected delta
- +$151/yr (+$13/mo · 9.3%)
ⓘ Screening estimate from a state-policy table — verify with the county assessor before closing.
Climate risk First Street
- Flood 1/10 Low FEMA zone X (unshaded) · 0% chance over 30 yrs
- Wildfire 1/10 Low
- Heat 4/10 Moderate 7 d/yr ≥100°F today · 17 d/yr by 30 yrs out
- Wind 2/10 Low 100% chance of damaging wind over 30 yrs
- Air quality 3/10 Moderate 2 unhealthy d/yr today · 3 by 30 yrs out
Nearby sold comps map
Loading sold comps map…
Walkable amenities ~0.75 mi
Loading nearby amenities…
Taxation est. · year 1
- Rental income
- $21,911
- − Mortgage interest
- −$6,890
- − Property taxes
- −$1,617
- − Insurance
- −$615
- − Repairs & maintenance
- −$1,753
- − Management
- −$1,753
- − Depreciation
- −$3,578
- Taxable income
- $5,706
- Est. tax owed @ 24.0%
- −$1,369
- After-tax cash flow
- $5,969/yr
For passive investors: Depreciation is non-cash, so a rental often shows a tax loss while cash-flowing — sheltering income. Rental losses are passive: they offset passive income freely, and up to $25,000/yr can offset ordinary (W-2) income if you actively participate and your MAGI is under $100k (phasing out to $0 by $150k); unused losses carry forward. On sale, claimed depreciation is recaptured at up to 25%, and gains may owe capital-gains tax (a 1031 exchange can defer both). Figures are a year-1 estimate at your 24.0% rate — not tax advice; consult a CPA.
Schools (NCES district)
- District
- Columbus City School District
- NCES district ID
- 3904380
- Math proficiency
- 15% ▼ -17.00%
- Reading proficiency
- 26% ▼ -12.00%
- Median HH income
- $38,483
- Composite
- 17.19/100
- National rank
- #9105
- State rank
- #626 of 656 in OH
Livability — Columbus
- Score
- 81/100
- State rank
- #97
- US rank
- #1491
Category grades
Schools grade is shown separately in the Schools card above.
Census & demographics
- Census place
- Columbus, OH
- County
- Franklin County · 1,351,780 people
- City population
- 612,189
- Metro
- Columbus, OH
- Population (ZIP)
- 21,996
- Household income
- $75,806
- Rent vs Own
- Severe rent burden
- 846.0
Population outlook (Franklin County) Hauer SSP2
- Today (2025)
- 1,456,139 people
- By 2030
- 1,556,890 · +6.9%
- By 2040
- 1,757,349 · +20.7%
- By 2050
- 1,950,539 · +34.0%
- By 2075
- 2,376,171 · +63.2%
- By 2100
- 2,636,796 · +81.1%
Race, ethnicity, and origin ACS 2023
- Neighborhood character
- Diverse neighborhood (Simpson 0.59)
- Race & ethnicity
- White 56% Black 31% Two or more races 9% Hispanic / Latino 4% Asian 1% Native American 1%
- Common ancestry
- Romanian 3% Slovak 2% Lithuanian 1%
- Foreign-born
- 4% · Canada
- Languages at home
- 96% English-only · Spanish 2% Other Indo-European 1%
Political lean MEDSL · Franklin
- 2024 margin
- Strong D (+28.4) · D 63.7% · R 35.3% · Other 1.0%
- 2008→2024 swing
- +7.7pp toward D · 2008: 20.7pp · 2024: 28.4pp
- All cycles
- 2024: D+28.4 2020: D+31.4 2016: D+25.9 2012: D+21.7 2008: D+20.7
Not yet ingested
- Civics
- —
Market trends
- HPI YoY
- ▼ -576.73%
- Current HPI
- 173.8569
- Rent YoY
- ▲ 3.51%
- Metro
- Columbus, OH
- State GDP YoY
- ▲ 1.98%
- F500 in state
- 48
Industry mix (Fortune 500 HQ in OH)
| Industry | F500 HQs | Revenue |
|---|---|---|
| Insurance | 3 | $145B |
|
||
| Industrial Machinery | 3 | $49B |
|
||
| Financial Services | 3 | $24B |
|
||
| Consumer Goods | 2 | $93B |
|
||
| Aerospace / Defense | 2 | $47B |
|
||
| Utilities | 2 | $33B |
|
||
Price history
+291.0% since first listed19 events — show timeline
- 2026-04-02 Price Changed $131,000 CBRMLS
- 2026-02-25 Listed $135,000 CBRMLS
- 2026-02-12 Sold (Public Records) $98,000 Public Records
- 2026-02-11 Sold (MLS) $98,000 CBRMLS
- 2026-01-31 Pending — CBRMLS
- 2026-01-28 Listed $59,900 CBRMLS
- 2010-05-06 Sold (MLS) $8,100 CBRMLS
- 2010-04-28 Listing Removed — CBRMLS
- 2010-01-21 Listed $10,000 CBRMLS
- 2007-05-18 Sold (MLS) $40,000 CBRMLS
- 2007-04-02 Listing Removed — CBRMLS
- 2007-03-20 Listed $44,900 CBRMLS
- 2007-02-19 Listing Removed — CBRMLS
- 2006-10-23 Listed $90,000 CBRMLS
- 2006-02-02 Sold (Public Records) $79,900 Public Records
- 2006-01-31 Sold (MLS) $79,900 CBRMLS
- 2005-12-13 Listing Removed — CBRMLS
- 2005-10-04 Listed $79,900 CBRMLS
- 1984-05-01 Sold (Public Records) $33,500 Public Records
Property tax history
+19.9%/yrLatest (2024): $1,617 · +1.3% YoY. Source: county tax records.
Cash-flow waterfall
monthlySold comps — $/sqft
last 12 mo · ≤1 miLoading sold comps…