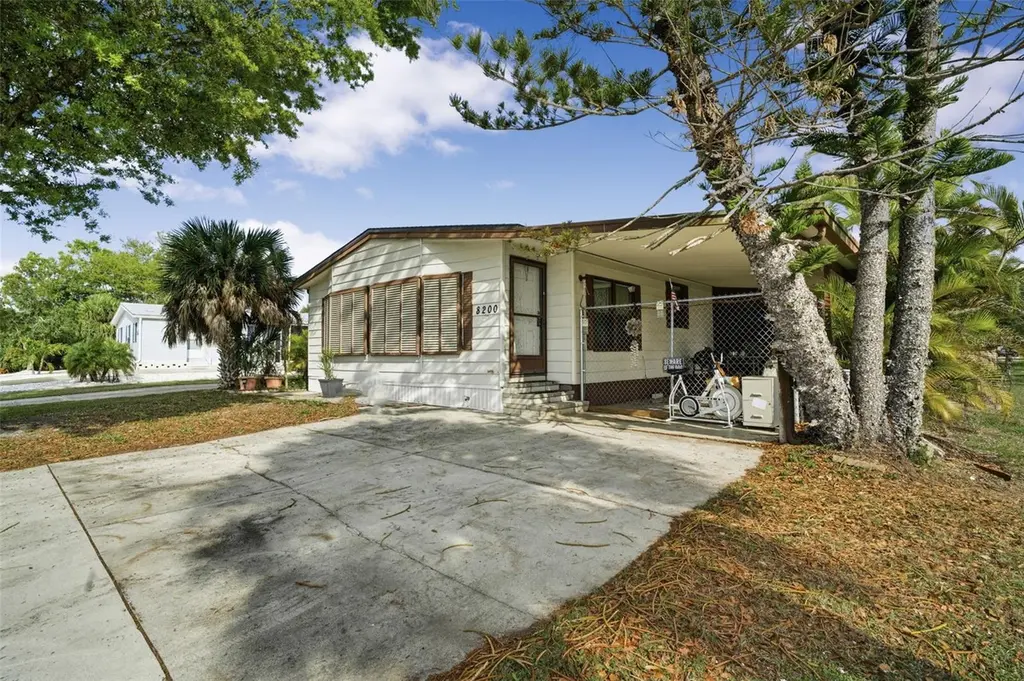
8200 Archie St · Grove City, FL
Flood risk 8/10 · Major
- FEMA flood zone
- AE
- Chance of flooding over 30 yrs
- 0.99%
- Est. flood insurance / yr
- $1,737 – $8,500
Fire risk 2/10 · Minimal
- Est. fire insurance / yr
- $947 – $1,759
Heat risk 10/10 · Severe
- Hot days now (above 107°F)
- 7 days/yr
- Hot days in 30 yrs
- 28 days/yr
Wind risk 10/10 · Severe
- Chance of severe wind over 30 yrs
- 99.0%
Air-quality risk 2/10 · Minimal
- Unhealthy air days now
- 1 days/yr
- Unhealthy air days in 30 yrs
- 1 days/yr
Risk factors via First Street. Map © Google.
Why this score? — see what drove the B grade
The composite is a weighted blend of 9 inputs, each scored 0–100. Each bar is that input's sub-score; the figure is the points it added to the 100-point composite (weight × sub-score).
- Cash flow +30.0/30.0
- 1% rule +10.0/10.0
- DSCR +10.0/10.0
- ARV discount +7.5/15.0
- Schools +4.6/10.0
- Livability +3.2/5.0
- Rent growth +2.5/5.0
- Condition / age +2.5/5.0
- Appreciation +0.0/10.0
$112,500
🖨 Deal sheet 📄 Offer letter ✓ Due diligence
Listing remarks
BUYER’S FINANCING FELL THROUGH — Don’t miss your second chance to own this beautiful, spacious manufactured home in a great location. Homes like this don’t stay available for long!Ever wanted to relive the charm of the early 2000’s? Here’s your chance. This 2-bedroom, 2-bath home brings back the nostalgic interior style of the era but with the big ticket items already taken care of. The roof, plumbing, and HVAC have all been updated within the last 6 years, giving you peace of mind while you decide whether to keep the retro vibe or add your own modern touch. Sitting on a rare spacious lot in a quiet Englewood neighborhood, the property offers plenty of ou
Key facts
- Spacious lot
- Room for parking
- Updated roof
Tags
Property features AI
Finance
- Other: Lot approximately 0.29 acres (0.25–0.5 acre range); Zoned MHC; No waterfront; Unfurnished
- HOA & community: Pets allowed
Exterior
- Parking: Carport with 1 space
- Utilities: Public water; Public sewer; Electricity connected
- Home design: Manufactured double-wide home; One level; North-facing
- Construction: Vinyl siding; Shingle roof; Other foundation
- Exterior features: Other exterior features; Paved road access
Interior
- Kitchen: Cooktop
- Bedrooms: 2 bedrooms
- Flooring: Carpet
- Bathrooms: 2 full bathrooms
- Heating & cooling: Central heating; Central air conditioning
- Interior features: Ceiling fans; Eat-in kitchen; 3 total rooms
- Laundry & utility: Dedicated laundry room
Neighborhood map
What this means for you Summary
Snapshot
- This is a 2-bed/2.0-bath manufactured listed at $112k.
Deal economics
- At list price, monthly cash flow is $417 ($5k/yr) — positive.
- The deal already cash-flows at list — no discount required.
- Meets the 1% rule at list price ($2k rent vs $112k).
- Recommended offer: $109k (3.0% below list) — sets the bar for market timing.
- Cap rate 15.3% vs local median 2.8% in Grove City — top-decile yield for the area; either an underpriced asset or a hidden risk that comps aren't pricing in. Stress-test before assuming the spread holds.
Location & tenants
- Location reads 63/100 on livability (#713 in FL) — a middle-class / working-renter tenant base. Strengths: crime A+, cost of living A+, housing A+; Watch: employment C-, schools F, amenities F.
- Charlotte (suburban): math 54% / reading 54% proficiency, ranked #22 of 73 in FL (top 30%) — acceptable for families but not a draw, mixed tenant base, ~2y average lease.
- Market conditions: Rents soft (-0.1%/yr); 734 active listings in the ZIP; 19 comparable units currently listed for rent nearby; rentals at typical pace (median 21d on market — plan ~3-4 weeks tenant-placement turnaround); 4,585 units permitted in Charlotte County in 2024 (703 in 5+ unit buildings).
- This rent runs 41% of the median local income ($57k/yr) — at the standard rent-burdened threshold; future hikes will face affordability resistance.
Forward outlook
- Local home prices are declining (-3.0%/yr); year-one equity from $778 of loan paydown is wiped out by about $3k of value loss. Plan a longer hold.
- Charlotte County population projected at +24% by 2050 — long-run rental-demand tailwind backs the buy-and-hold thesis.
Negotiation context
- It's been on market 59 days — a 3% lower offer ($109k) is reasonable based on typical stale-listing flexibility.
- 3 sale attempts; this cycle's ask has dropped $12k (10%) from the opening price — seller is motivated, your offer sets the floor, not the list.
- Current owner paid $50k; list at $112k implies a 125% gain — meaningful room to come down on a strong offer.
Risks & watch-outs
- Watch-outs: flood insurance adds $427/mo.
- Climate carrying-cost: in FEMA flood zone AE (mandatory federal flood insurance); severe wind risk, 99% chance of damaging wind over 30y; extreme-heat days projected 7→28/yr by 2055 (HVAC capex compounding) — expect insurance premiums to compound above CPI over the hold.
Questions for the listing agent
- It's been on market 59 days. Have you received any prior offers? Is the seller open to a 3% concession, seller financing, or rate buy-down credit?
- What's the actual annual flood-insurance premium (NFIP or private), and is the property in a SFHA with mandatory coverage?
- Is there a deadline driving the sale (1031 exchange, divorce, estate, relocation)? That informs how much negotiation room exists.
- Schools are F-rated, which usually means shorter tenancies and higher turnover. Who's the typical renter profile here, and what's been the actual vacancy rate?
- What's the average days-on-market for RENTAL listings here right now (not sales)? A rising rental-DOM trend means longer vacancies and softer asking-rent achievability than the comps imply.
- What's the recent tenant-quality profile in this submarket — average credit score on applications, eviction rate, late-payment / NSF rate, and stable-employment percentage? A property-management company in the area should have these aggregated.
- How much new for-sale + rental construction is in the pipeline within 1–3 miles? Heavy new supply typically softens prices + rents 12–24 months out; constrained supply supports both.
Investment metrics
- 1% rule
- 1.75% ✓
- Cap rate
- 15.29%
- Cash-on-cash
- 32.13%
- DSCR
- 2.43
- GRM
- 4.7
CMA / ARV
No comps found within radius.
Projected returns pro-forma
-3.0% appreciation · 0.0% rent growth · sell at horizon
- IRR
- 2.4%
- Equity multiple
- 1.09×
- Total profit
- $2,792
- Equity at exit
- $16,774
- IRR
- 7.8%
- Equity multiple
- 1.49×
- Total profit
- $15,297
- Equity at exit
- $9,727
Cash invested: $31,500 (down + closing). Projections, not guarantees.
Landlord ↔ Tenant lean methodology
- Overall (STATE)
- 87 Strongly Landlord-Friendly
- State Florida
- 87 Strongly Landlord-Friendly · R+3
- County
- — inherits STATE
- City
- — inherits STATE
ZIP-level market 34224
- Home prices YoY
- -18.9%
- Rents YoY
- -0.1%
- Active inventory
- 734
- Price-to-rent
- 4.7×
Monthly cashflow live
- Estimated rent
- $1,974 high interval (Pro) →
- Mortgage (P&I)
- −$590
- Tax from tax record
- −$79 /mo · $952/yr
- Insurance
- −$47
- Flood insurance flood zone
- −$427 /mo · $5,118/yr
- HOA
- −$0
- Vacancy / Maint / Mgmt
- −$415
- Net cashflow
- $417
Break-even live
UW: 25.0% down · 7.5% · 30yr · 1.5% tax · 5.0% vac · 8.0% maint · 8.0% mgmt
Financing live
Cash to close
- Down payment
- $28,125
- Closing costs
- $3,375
- Reserves months
- —
- Total cash needed
- —
Loan-product check · same deal, 3 products live
Conventional
25% down · 7.5% · 30yr
- Down + closing
- —
- Monthly P&I
- —
- Monthly cashflow
- —
- DSCR
- —
- Eligible?
- —
Personal DTI + credit; lowest rate.
DSCR
20% down · 8.5% · 30yr
- Down + closing
- —
- Monthly P&I
- —
- Monthly cashflow
- —
- DSCR
- —
- Eligible?
- —
No personal income docs; deal must DSCR.
Hard money
10% down · 12.0% · 12mo
- Down + closing
- —
- Monthly P&I
- —
- Monthly cashflow
- —
- DSCR
- —
- Eligible?
- —
Short-term bridge; refi at stabilization.
Rent comps 19 comps
| Address | Beds | Baths | Sqft | Rent | $/sqft | DOM | Units | Dist |
|---|---|---|---|---|---|---|---|---|
| 4341 Placida Rd #5 Englewood, FL | 2.0 | 2.0 | 1071 | $1,350 | $1.26 | 20d | 1 | 0.17mi |
| 4341 Placida Rd #6 Englewood, FL | 2.0 | 2.0 | 1071 | $1,450 | $1.35 | 20d | 1 | 0.17mi |
| 8146 Saint Kitts Cir Englewood, FL | 3.0 | 2.0 | 1635 | $2,400 | $1.47 | 20d | 1 | 0.33mi |
| 8787 Saint Kitts Cir Englewood, FL | 3.0 | 2.0 | 1422 | $2,300 | $1.62 | 13d | 1 | 0.60mi |
| 8722 Saint Kitts Cir Englewood, FL | 3.0 | 2.0 | 1417 | $2,100 | $1.48 | 20d | 1 | 0.64mi |
| 8716 Saint Kitts Cir Englewood, FL | 3.0 | 2.0 | 1417 | $2,500 | $1.76 | 20d | 1 | 0.64mi |
| 8644 Saint Kitts Cir Englewood, FL | 3.0 | 3.0 | 1849 | $2,095 | $1.13 | 20d | 1 | 0.68mi |
| 8613 Seasalt Loop Englewood, FL | 3.0 | 2.0 | 1422 | $3,650 | $2.57 | 20d | 1 | 0.70mi |
| 3280 Holly Ave Englewood, FL | 3.0 | 2.0 | 900 | $3,300 | $3.67 | 20d | 1 | 0.73mi |
| 1950 Nebraska Ave Englewood, FL | 2.0 | 2.0 | 1325 | $3,536 | $2.67 | 20d | 1 | 0.74mi |
| 226 Boundary Blvd Rotonda West, FL | 2.0 | 2.0 | 1200 | $1,495 | $1.25 | 13d | 1 | 1.14mi |
| 100 Rotonda Lakes Cir Rotonda West, FL | 1.0–3.0 | 1.0–2.0 | 1024 | $1,126 | $1.10 | 13d | 1 | 1.21mi |
| 278 Boundary Blvd Unit B Rotonda West, FL | 2.0 | 2.0 | 1138 | $1,625 | $1.43 | 20d | 1 | 1.23mi |
| 289 Boundary Blvd Unit 202 Rotonda West, FL | 3.0 | 2.0 | 1168 | $1,645 | $1.41 | 20d | 1 | 1.24mi |
| 260 Rotonda Blvd W Unit 2 Rotonda West, FL | 3.0 | 2.0 | 1047 | $1,500 | $1.43 | 20d | 1 | 1.28mi |
| 173 Rotonda Cir Rotonda West, FL | 3.0 | 2.0 | 1350 | $3,200 | $2.37 | 20d | 1 | 1.31mi |
| 284 Rotonda Blvd W Rotonda West, FL | 2.0 | 2.0 | 897 | $1,475 | $1.64 | 20d | 1 | 1.31mi |
| 309 Boundary Blvd Unit B Rotonda West, FL | 2.0 | 2.0 | 960 | $1,450 | $1.51 | 20d | 1 | 1.34mi |
| 1915 Pennsylvania Ave Englewood, FL | 2.0 | 2.0 | 1394 | $7,500 | $5.38 | 20d | 1 | 1.47mi |
Listing history 25 events
-
2026-06-18days on market $112,500 Active 59 DOM
-
2026-06-17days on market $112,500 Active 58 DOM
-
2026-06-16days on market $112,500 Active 57 DOM
-
2026-06-15days on market $112,500 Active 56 DOM
-
2026-06-14pricedays on market $112,500 Active 54 DOM
-
2026-06-13days on market $117,500 Active 53 DOM
-
2026-06-10days on market $117,500 Active 51 DOM
-
2026-06-09days on market $117,500 Active 50 DOM
-
2026-06-08days on market $117,500 Active 49 DOM
-
2026-06-07days on market $117,500 Active 48 DOM
-
2026-06-05days on market $117,500 Active 45 DOM
-
2026-06-03days on market $117,500 Active 44 DOM
-
2026-06-03price $117,500 Active 43 DOM
-
2026-06-02days on market $125,000 Active 43 DOM
-
2026-06-01days on market $125,000 Active 42 DOM
-
2026-05-31days on market $125,000 Active 41 DOM
-
2026-05-30days on market $125,000 Active 40 DOM
-
2026-05-18status Active
-
2026-04-17status Pending
-
2026-03-27status Active
-
2026-03-24status Pending
-
2026-03-17$125,000 Active
-
2026-03-13soldstatus $50,000
-
2002-03-07soldstatus $77,000
-
2001-06-21soldstatus $68,000
ⓘ Source: listings_history table (triggers on properties + properties_extension) + one-shot
backfill from property_details.listing_events for pre-trigger history.
Tax reassessment forecast FL · Resets to sale price
- Current annual tax
- $952 · $79/mo
- Projected year-2 tax
- $952 · $79/mo
- Expected delta
- $0/yr ($0/mo · 0.0%)
ⓘ Screening estimate from a state-policy table — verify with the county assessor before closing.
Climate risk First Street
- Flood 8/10 Severe FEMA zone AE · 99% chance over 30 yrs
- Wildfire 2/10 Low
- Heat 10/10 Extreme 7 d/yr ≥107°F today · 28 d/yr by 30 yrs out
- Wind 10/10 Extreme 99% chance of damaging wind over 30 yrs
- Air quality 2/10 Low 1 unhealthy d/yr today · 1 by 30 yrs out
Nearby sold comps map
Loading sold comps map…
Walkable amenities ~0.75 mi
Loading nearby amenities…
Taxation est. · year 1
- Rental income
- $23,691
- − Mortgage interest
- −$6,302
- − Property taxes
- −$952
- − Insurance
- −$5,681
- − Repairs & maintenance
- −$1,895
- − Management
- −$1,895
- − Depreciation
- −$3,273
- Taxable income
- $3,693
- Est. tax owed @ 24.0%
- −$886
- After-tax cash flow
- $4,117/yr
For passive investors: Depreciation is non-cash, so a rental often shows a tax loss while cash-flowing — sheltering income. Rental losses are passive: they offset passive income freely, and up to $25,000/yr can offset ordinary (W-2) income if you actively participate and your MAGI is under $100k (phasing out to $0 by $150k); unused losses carry forward. On sale, claimed depreciation is recaptured at up to 25%, and gains may owe capital-gains tax (a 1031 exchange can defer both). Figures are a year-1 estimate at your 24.0% rate — not tax advice; consult a CPA.
Schools (NCES district)
- District
- Charlotte
- NCES district ID
- 1200240
- Math proficiency
- 54% ▼ -6.00%
- Reading proficiency
- 54% ▼ -1.00%
- Median HH income
- $44,864
- Composite
- 45.62/100
- National rank
- #2586
- State rank
- #22 of 73 in FL
Livability — Grove City
- Score
- 63/100
- State rank
- #713
- US rank
- #15171
Category grades
Schools grade is shown separately in the Schools card above.
Census & demographics
- Census place
- Grove City, FL
- County
- Charlotte County · 196,994 people
- Metro
- Punta Gorda, FL
- Population (ZIP)
- 15,536
- Household income
- $57,281
- Rent vs Own
- Severe rent burden
- 329.0
Population outlook (Charlotte County) Hauer SSP2
- Today (2025)
- 198,646 people
- By 2030
- 210,507 · +6.0%
- By 2040
- 230,857 · +16.2%
- By 2050
- 247,148 · +24.4%
- By 2075
- 281,777 · +41.8%
- By 2100
- 293,609 · +47.8%
Race, ethnicity, and origin ACS 2023
- Neighborhood character
- Predominantly White (92%)
- Race & ethnicity
- White 92% Two or more races 5% Hispanic / Latino 3% Asian 1%
- Common ancestry
- Romanian 4% Slovak 4% Lithuanian 4%
- Foreign-born
- 9% · Canada
- Languages at home
- 92% English-only · Other Indo-European 2% Spanish 2% German/W. Germanic 1%
Political lean MEDSL · Charlotte
- 2024 margin
- Solid R (+34.0) · D 32.7% · R 66.7%
- 2008→2024 swing
- -26.7pp toward R · 2008: -7.2pp · 2024: -34.0pp
- All cycles
- 2024: R+34.0 2020: R+26.6 2016: R+27.8 2012: R+14.3 2008: R+7.2
Not yet ingested
- Civics
- —
Market trends
- HPI YoY
- ▼ -75.76%
- Current HPI
- 325.0345
- Rent YoY
- ▼ -0.11%
- Metro
- Punta Gorda, FL
- State GDP YoY
- ▲ 3.28%
- F500 in state
- 36
Industry mix (Fortune 500 HQ in FL)
| Industry | F500 HQs | Revenue |
|---|---|---|
| Industrial Technology | 2 | $29B |
|
||
| Insurance | 2 | $17B |
|
||
| Retail | 1 | $60B |
|
||
| Technology Distribution | 1 | $58B |
|
||
| Homebuilding | 1 | $35B |
|
||
| Technology Manufacturing | 1 | $35B |
|
||
Price history
+83.8% since first listed8 events — show timeline
- 2026-05-18 Relisted — Stellar MLS as Distributed by MLS Grid
- 2026-04-17 Pending — Stellar MLS as Distributed by MLS Grid
- 2026-03-27 Relisted — Stellar MLS as Distributed by MLS Grid
- 2026-03-24 Pending — Stellar MLS as Distributed by MLS Grid
- 2026-03-17 Listed $125,000 Stellar MLS as Distributed by MLS Grid
- 2026-03-13 Sold (Public Records) $50,000 Public Records
- 2002-03-07 Sold (Public Records) $77,000 Public Records
- 2001-06-21 Sold (Public Records) $68,000 Public Records
Property tax history
+7.9%/yrLatest (2025): $952 · +4.8% YoY. Source: county tax records.
Cash-flow waterfall
monthlySold comps — $/sqft
last 12 mo · ≤1 miLoading sold comps…