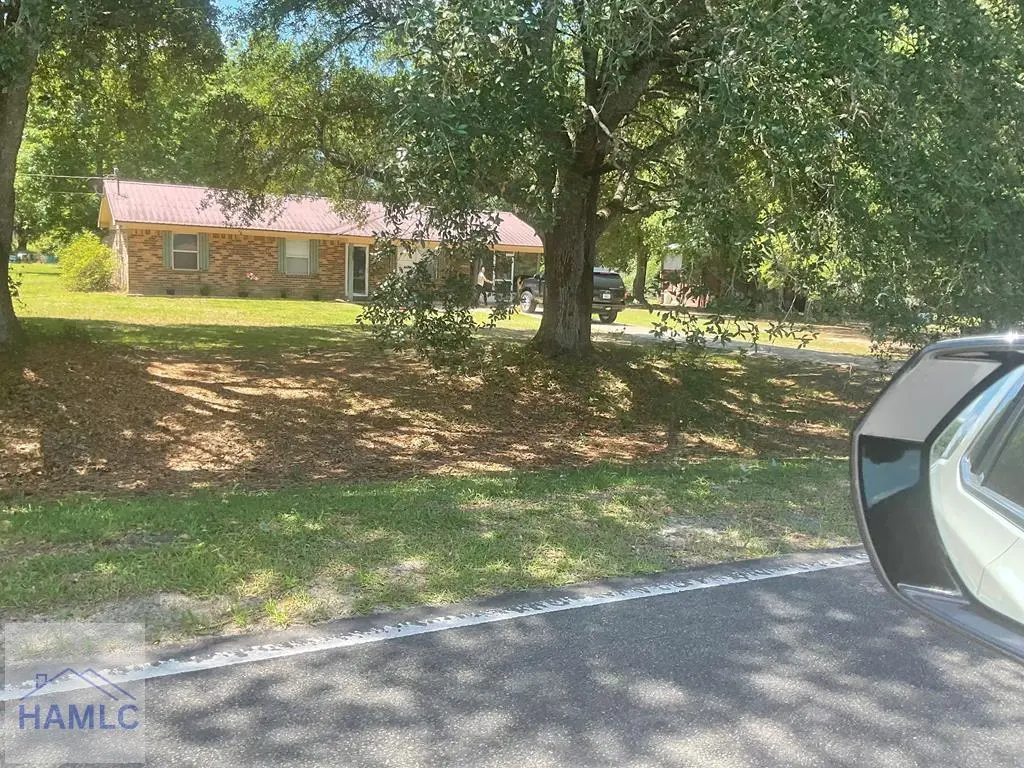
2821 Stanfield Rd · Screven, GA
Flood risk 1/10 · Minimal
- FEMA flood zone
- X (unshaded)
- Chance of flooding over 30 yrs
- 0.0%
- Est. flood insurance / yr
- $507 – $1,088
Fire risk 5/10 · Moderate
- Est. fire insurance / yr
- $963 – $1,789
Heat risk 8/10 · Major
- Hot days now (above 108°F)
- 7 days/yr
- Hot days in 30 yrs
- 18 days/yr
Wind risk 9/10 · Severe
- Chance of severe wind over 30 yrs
- 99.0%
Air-quality risk 3/10 · Minor
- Unhealthy air days now
- 4 days/yr
- Unhealthy air days in 30 yrs
- 4 days/yr
Risk factors via First Street. Map © Google.
Why this score? — see what drove the D grade
The composite is a weighted blend of 9 inputs, each scored 0–100. Each bar is that input's sub-score; the figure is the points it added to the 100-point composite (weight × sub-score).
- Appreciation +10.0/10.0
- Cash flow +8.1/30.0
- ARV discount +7.5/15.0
- Livability +3.2/5.0
- Schools +2.9/10.0
- Rent growth +2.5/5.0
- Condition / age +2.5/5.0
- DSCR +2.1/10.0
- 1% rule +1.9/10.0
$145,000
🖨 Deal sheet 📄 Offer letter ✓ Due diligence
Key facts
- 1 acre lot
- Built 1987
Property features AI
Exterior
- Parking: Driveway; No garage
- Utilities: Private well water; Septic tank; Electricity connected / electric on property
- Home design: Single family residence; Residential property
- Construction: Brick veneer construction; Asbestos shingle roof; Slab foundation; Built area approximately 1168
- Exterior features: Cleared lot; Paved road frontage on a county road; No exterior special features noted; No fencing
Interior
- Kitchen: Electric oven
- Bathrooms: 1 full bathroom
- Interior features: Electric water heater; Electric oven; No fireplace; 6 total rooms
- Laundry & utility: Electric water heater
Neighborhood map
What this means for you Summary
Snapshot
- This is a 3-bed/1.0-bath single-family listed at $145k.
Deal economics
- At list price, monthly cash flow is $-144 ($-2k/yr) — negative.
- To cash-flow at today's rent, offer at most $120k (17.5% below list).
- To meet the 1% rule (rent ≥ 1% of price), the offer needs to be $100k (31.0% below list).
- Recommended offer: $100k (31.0% below list) — sets the bar for 1% rule.
Location & tenants
- Location reads 65/100 on livability (#210 in GA) — a middle-class / working-renter tenant base. Strengths: cost of living A+, housing A+, health & safety A+; Watch: schools D+, crime F, amenities F.
- Wayne County (rural): math 35% / reading 35% proficiency, ranked #68 of 174 in GA (top 39%) — families likely to look elsewhere, expect single-tenant / working-renter base with shorter leases; 60% free/reduced lunch — lower-income household profile, screen leases tightly.
- Market conditions: 19 active listings in the ZIP; 163 units permitted in Wayne County in 2024 (0 in 5+ unit buildings).
Forward outlook
- In year one you build about $16k of equity ($1k loan paydown + $14k appreciation (10.0% local appreciation)).
- Wayne County population projected to shrink 10% by 2050 — rents likely to lag national; underwrite the cash flow, not the appreciation.
- By year 3, paydown + projected appreciation supports a ~$39k cash-out refi (75% LTV) — recoverable capital for the next deal without selling this one.
Negotiation context
- Only 1 days on market — expect competitive offers; lowballing is unlikely to land.
- 2 sale attempts with the ask held roughly flat each time — persistent listings suggest the price (not the market) is what's stuck; bring a comps-based counter.
- Current owner paid $80k; list at $145k implies a 81% gain — meaningful room to come down on a strong offer.
Risks & watch-outs
- Climate carrying-cost: severe wind risk, 99% chance of damaging wind over 30y; moderate wildfire risk; extreme-heat days projected 7→18/yr by 2055 (HVAC capex compounding) — expect insurance premiums to compound above CPI over the hold.
Questions for the listing agent
- What do current leases actually rent for vs. the listed asking? Can we see a recent rent roll and the last 12 months of T-12 income?
- Is there a deadline driving the sale (1031 exchange, divorce, estate, relocation)? That informs how much negotiation room exists.
- Schools are D-rated, which usually means shorter tenancies and higher turnover. Who's the typical renter profile here, and what's been the actual vacancy rate?
- Crime grade is F in this area — have there been break-ins, vandalism, or insurance claims at this property in the last 3 years? What carrier currently insures it and at what premium?
- The area grade is low — what's the realistic commute time and amenity access for the typical tenant pool here? Any planned neighborhood developments (good or bad) we should know about?
- What's the average days-on-market for RENTAL listings here right now (not sales)? A rising rental-DOM trend means longer vacancies and softer asking-rent achievability than the comps imply.
- What's the recent tenant-quality profile in this submarket — average credit score on applications, eviction rate, late-payment / NSF rate, and stable-employment percentage? A property-management company in the area should have these aggregated.
- How much new for-sale + rental construction is in the pipeline within 1–3 miles? Heavy new supply typically softens prices + rents 12–24 months out; constrained supply supports both.
Investment metrics
- 1% rule
- 0.69% ✗
- Cap rate
- 5.10%
- Cash-on-cash
- -4.24%
- DSCR
- 0.81
- GRM
- 12.1
CMA / ARV
No comps found within radius.
Projected returns pro-forma
10.0% appreciation · 3.0% rent growth · sell at horizon
- IRR
- 21.3%
- Equity multiple
- 2.72×
- Total profit
- $69,800
- Equity at exit
- $130,627
- IRR
- 19.2%
- Equity multiple
- 6.24×
- Total profit
- $212,687
- Equity at exit
- $281,703
Cash invested: $40,600 (down + closing). Projections, not guarantees.
Landlord ↔ Tenant lean methodology
- Overall (STATE)
- 90 Strongly Landlord-Friendly
- State Georgia
- 90 Strongly Landlord-Friendly · R+3
- County
- — inherits STATE
- City
- — inherits STATE
ZIP-level market 31560
- Home prices YoY
- 20.1%
- Active inventory
- 19
- Price-to-rent
- 12.1×
Monthly cashflow live
- Estimated rent
- $1,001 medium interval (Pro) →
- Mortgage (P&I)
- −$760
- Tax from tax record
- −$113 /mo · $1,361/yr
- Insurance
- −$60
- HOA
- −$0
- Vacancy / Maint / Mgmt
- −$210
- Net cashflow
- $-144
Break-even live
UW: 25.0% down · 7.5% · 30yr · 1.5% tax · 5.0% vac · 8.0% maint · 8.0% mgmt
Financing live
Cash to close
- Down payment
- $36,250
- Closing costs
- $4,350
- Reserves months
- —
- Total cash needed
- —
Loan-product check · same deal, 3 products live
Conventional
25% down · 7.5% · 30yr
- Down + closing
- —
- Monthly P&I
- —
- Monthly cashflow
- —
- DSCR
- —
- Eligible?
- —
Personal DTI + credit; lowest rate.
DSCR
20% down · 8.5% · 30yr
- Down + closing
- —
- Monthly P&I
- —
- Monthly cashflow
- —
- DSCR
- —
- Eligible?
- —
No personal income docs; deal must DSCR.
Hard money
10% down · 12.0% · 12mo
- Down + closing
- —
- Monthly P&I
- —
- Monthly cashflow
- —
- DSCR
- —
- Eligible?
- —
Short-term bridge; refi at stabilization.
Listing history 1 events
-
2026-06-13$145,000 Pending 1 DOM
ⓘ Source: listings_history table (triggers on properties + properties_extension) + one-shot
backfill from property_details.listing_events for pre-trigger history.
Tax reassessment forecast GA · Resets to sale price
- Current annual tax
- $1,361 · $113/mo
- Projected year-2 tax
- $1,361 · $113/mo
- Expected delta
- $0/yr ($0/mo · 0.0%)
ⓘ Screening estimate from a state-policy table — verify with the county assessor before closing.
Climate risk First Street
- Flood 1/10 Low FEMA zone X (unshaded) · 0% chance over 30 yrs
- Wildfire 5/10 Major
- Heat 8/10 Severe 7 d/yr ≥108°F today · 18 d/yr by 30 yrs out
- Wind 9/10 Extreme 99% chance of damaging wind over 30 yrs
- Air quality 3/10 Moderate 4 unhealthy d/yr today · 4 by 30 yrs out
Nearby sold comps map
Loading sold comps map…
Walkable amenities ~0.75 mi
Loading nearby amenities…
Taxation est. · year 1
- Rental income
- $12,009
- − Mortgage interest
- −$8,122
- − Property taxes
- −$1,361
- − Insurance
- −$725
- − Repairs & maintenance
- −$961
- − Management
- −$961
- − Depreciation
- −$4,218
- Taxable loss
- −$4,338
- Est. tax savings @ 24.0%
- +$1,041
- After-tax cash flow
- $-682/yr
For passive investors: Depreciation is non-cash, so a rental often shows a tax loss while cash-flowing — sheltering income. Rental losses are passive: they offset passive income freely, and up to $25,000/yr can offset ordinary (W-2) income if you actively participate and your MAGI is under $100k (phasing out to $0 by $150k); unused losses carry forward. On sale, claimed depreciation is recaptured at up to 25%, and gains may owe capital-gains tax (a 1031 exchange can defer both). Figures are a year-1 estimate at your 24.0% rate — not tax advice; consult a CPA.
Schools (NCES district)
- District
- Wayne County
- NCES district ID
- 1305550
- Math proficiency
- 35% ▼ -4.00%
- Reading proficiency
- 35% ▼ -3.00%
- Median HH income
- $38,918
- Composite
- 29.3/100
- National rank
- #6554
- State rank
- #68 of 174 in GA
Livability — Screven
- Score
- 65/100
- State rank
- #210
- US rank
- #12723
Category grades
Schools grade is shown separately in the Schools card above.
Census & demographics
- Population (ZIP)
- 2,810
Population outlook (Wayne County) Hauer SSP2
- Today (2025)
- 28,891 people
- By 2030
- 28,388 · -1.7%
- By 2040
- 27,396 · -5.2%
- By 2050
- 26,135 · -9.5%
- By 2075
- 23,253 · -19.5%
- By 2100
- 19,481 · -32.6%
Race, ethnicity, and origin ACS 2023
- Neighborhood character
- Predominantly White (92%)
- Race & ethnicity
- White 92% Black 5%
- Common ancestry
- Italian 2% Slovak 2%
- Foreign-born
- 0%
- Languages at home
- 99% English-only · Spanish 1%
Political lean MEDSL · Wayne
- 2024 margin
- Solid R (+59.8) · D 20.0% · R 79.7%
- 2008→2024 swing
- -14.8pp toward R · 2008: -44.9pp · 2024: -59.8pp
- All cycles
- 2024: R+59.8 2020: R+57.1 2016: R+58.9 2012: R+48.3 2008: R+44.9
Not yet ingested
- Civics
- —
Market trends
- HPI YoY
- ▲ 48.63%
- Current HPI
- 291.2119
- Rent YoY
- —
- Metro
- —
- State GDP YoY
- ▲ 2.66%
- F500 in state
- 28
Industry mix (Fortune 500 HQ in GA)
| Industry | F500 HQs | Revenue |
|---|---|---|
| Paper / Packaging | 2 | $29B |
|
||
| Retail | 1 | $160B |
|
||
| Transportation / Logistics | 1 | $91B |
|
||
| Airlines | 1 | $62B |
|
||
| Consumer Goods | 1 | $47B |
|
||
| Utilities | 1 | $25B |
|
||
Price history
+81.2% since first listed6 events — show timeline
- 2026-06-12 Pending — HABR
- 2026-06-11 Relisted — HABR
- 2026-05-20 Delisted — HABR
- 2026-05-20 Delisted — HABR
- 2026-05-19 Listed $145,000 HABR
- 2022-08-24 Sold (Public Records) $80,000 Public Records
Property tax history
+13.3%/yrLatest (2024): $1,361 · +44.8% YoY. Source: county tax records.
Cash-flow waterfall
monthlySold comps — $/sqft
last 12 mo · ≤1 miLoading sold comps…