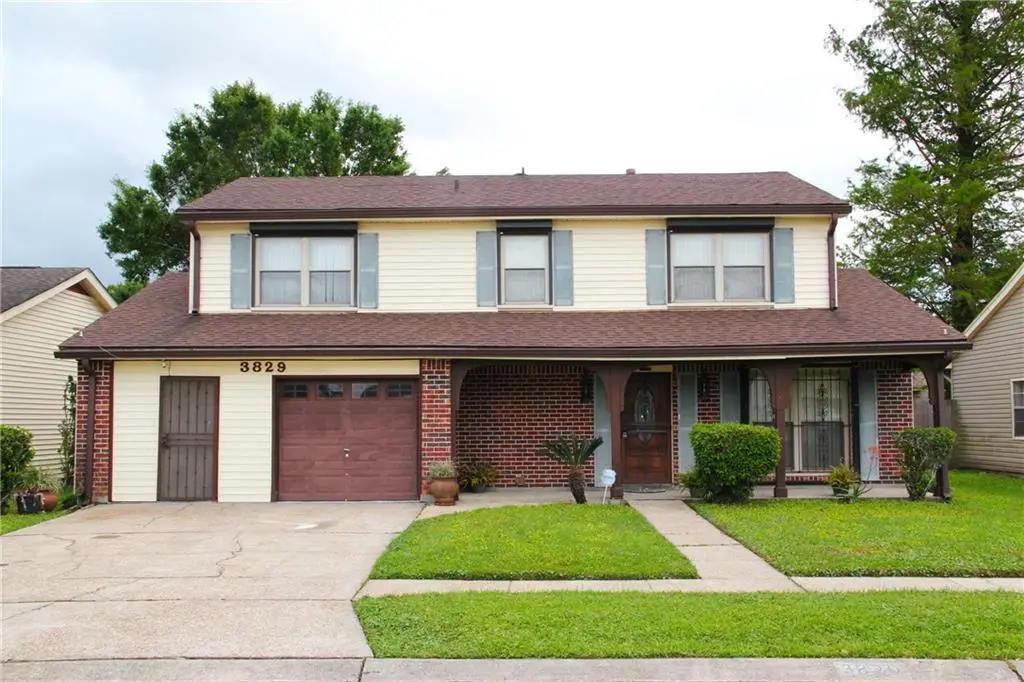
3829 N Deerwood Dr · Woodmere, LA
Flood risk 8/10 · Major
- FEMA flood zone
- X
- Chance of flooding over 30 yrs
- 0.6%
- Est. flood insurance / yr
- $507 – $1,088
Fire risk 1/10 · Minimal
- Est. fire insurance / yr
- $1,269 – $2,357
Heat risk 10/10 · Severe
- Hot days now (above 108°F)
- 7 days/yr
- Hot days in 30 yrs
- 22 days/yr
Wind risk 10/10 · Severe
- Chance of severe wind over 30 yrs
- 99.0%
Air-quality risk 3/10 · Minor
- Unhealthy air days now
- 3 days/yr
- Unhealthy air days in 30 yrs
- 4 days/yr
Risk factors via First Street. Map © Google.
Why this score? — see what drove the C- grade
The composite is a weighted blend of 9 inputs, each scored 0–100. Each bar is that input's sub-score; the figure is the points it added to the 100-point composite (weight × sub-score).
- Cash flow +19.8/30.0
- ARV discount +13.5/15.0
- DSCR +6.3/10.0
- 1% rule +4.2/10.0
- Livability +3.1/5.0
- Schools +2.5/10.0
- Condition / age +2.5/5.0
- Rent growth +1.5/5.0
- Appreciation +0.0/10.0
$235,000
🖨 Deal sheet 📄 Offer letter ✓ Due diligence
Listing remarks MLS
WELL MAINTAINED BELLEWOOD MODEL, ALL MAINT FREE EXTERIOR, NEWER ROOF, LOTS OF IMPROVEMENTS, NEWER SS GRANITE KITCHEN, RECESSED LIGHTING, TILED FLOORS AND CARPET ON STAIRS AND BDRMS. FULL SIZE COVERED CONCRETE PATIO ACROSS REAR, ROLL DOWN STORM SHUTTERS, NICE WORKSHOP WITH WATER AND ELECTRICITY.
Key facts
- Newer roof
- Tiled floors
- Recessed lighting
Tags
Neighborhood map
What this means for you Summary
Snapshot
- This is a 4-bed/2.5-bath single-family listed at $235k.
Deal economics
- At list price, monthly cash flow is $215 ($3k/yr) — positive.
- The deal already cash-flows at list — no discount required.
- To meet the 1% rule (rent ≥ 1% of price), the offer needs to be $215k (8.4% below list).
- Recommended offer: $215k (8.4% below list) — sets the bar for 1% rule.
Location & tenants
- Location reads 62/100 on livability (#216 in LA) — a middle-class / working-renter tenant base. Strengths: cost of living A+, housing A+; Watch: schools F, crime F, amenities F.
- Jefferson Parish (suburban): math 24% / reading 34% proficiency, ranked #44 of 98 in LA (top 45%) — low school quality limits family demand, transient renter base, plan for 1-2y turnover; 70% free/reduced lunch — lower-income household profile, screen leases tightly.
- Market conditions: Rents falling (-3.9%/yr); 187 active listings in the ZIP; 8 comparable units currently listed for rent nearby; rentals at typical pace (median 24d on market — plan ~3-4 weeks tenant-placement turnaround); 518 units permitted in Jefferson Parish in 2024 (43 in 5+ unit buildings).
- This rent runs 41% of the median local income ($62k/yr) — at the standard rent-burdened threshold; future hikes will face affordability resistance.
Forward outlook
- Local home prices are declining (-3.0%/yr); year-one equity from $2k of loan paydown is wiped out by about $7k of value loss. Plan a longer hold.
Negotiation context
- It's been on market 73 days — a 6% lower offer ($221k) is reasonable based on typical stale-listing flexibility.
- 6 sale attempts since 18y ago with the ask held roughly flat each time — persistent listings suggest the price (not the market) is what's stuck; bring a comps-based counter.
- Current owner paid $62k; list at $235k implies a 276% gain — meaningful room to come down on a strong offer.
Risks & watch-outs
- Watch-outs: flood insurance adds $66/mo.
- Climate carrying-cost: severe flood risk; severe wind risk, 99% chance of damaging wind over 30y; extreme-heat days projected 7→22/yr by 2055 (HVAC capex compounding) — expect insurance premiums to compound above CPI over the hold.
Questions for the listing agent
- It's been on market 73 days. Have you received any prior offers? Is the seller open to a 8% concession, seller financing, or rate buy-down credit?
- What's the actual annual flood-insurance premium (NFIP or private), and is the property in a SFHA with mandatory coverage?
- Why hasn't it sold? Are there any deal-killer items the seller is aware of (foundation, flood, title, zoning, code violations)?
- Is there a deadline driving the sale (1031 exchange, divorce, estate, relocation)? That informs how much negotiation room exists.
- Schools are F-rated, which usually means shorter tenancies and higher turnover. Who's the typical renter profile here, and what's been the actual vacancy rate?
- Crime grade is F in this area — have there been break-ins, vandalism, or insurance claims at this property in the last 3 years? What carrier currently insures it and at what premium?
- What's the average days-on-market for RENTAL listings here right now (not sales)? A rising rental-DOM trend means longer vacancies and softer asking-rent achievability than the comps imply.
- What's the recent tenant-quality profile in this submarket — average credit score on applications, eviction rate, late-payment / NSF rate, and stable-employment percentage? A property-management company in the area should have these aggregated.
- How much new for-sale + rental construction is in the pipeline within 1–3 miles? Heavy new supply typically softens prices + rents 12–24 months out; constrained supply supports both.
Investment metrics
- 1% rule
- 0.92% ✗
- Cap rate
- 7.73%
- Cash-on-cash
- 5.13%
- DSCR
- 1.23
- GRM
- 9.1
CMA / ARV
- ARV (median comp)
- $271,491
- List price
- $235,000
- Delta
- -13.44%
- Verdict
- UNDERPRICED
- Comps
- 20 within 1.0 mi
Show comp detail 12 sales within ~0.75 mi
| Address | Dist | Beds/Ba | Sqft | Sold | Price | $/sf | Match |
|---|---|---|---|---|---|---|---|
| 3853 S Deerwood Dr | 0.08mi | 4/2.5 | 2,280 (+0%) | 4mo | $285,000 | $125 | 93 |
| 3860 N Deerwood Dr | 0.10mi | 4/2.5 | 2,332 (+2%) | 2mo | $150,000 | $64 | 90 |
| 3872 Accacia Ln | 0.30mi | 4/2.0 | 2,164 (-5%) | 1mo | $245,000 | $113 | 75 |
| 3884 Chinkapin St | 0.59mi | 4/2.5 | 2,275 (0%) | 1mo | $233,000 | $102 | 72 |
| 3832 Redbud Ln | 0.23mi | 3/2.5 (-1) | 2,100 (-8%) | 0mo | $121,600 | $58 | 71 |
| 2316 Alex Kornman Blvd | 0.25mi | 4/3.5 | 2,055 (-10%) | 4mo | $286,000 | $139 | 65 |
| 3812 Chadwood Dr | 0.69mi | 4/2.5 | 2,300 (+1%) | 3mo | $207,000 | $90 | 64 |
| 3837 Deer Run Ln | 0.16mi | 3/2.0 (-1) | 1,986 (-13%) | 4mo | $138,000 | $69 | 61 |
| 3889 Chriswood Ln | 0.48mi | 3/2.5 (-1) | 2,118 (-7%) | 2mo | $120,000 | $57 | 59 |
| 2513 W Catawba Dr | 0.30mi | 3/2.0 (-1) | 1,986 (-13%) | 5mo | $244,800 | $123 | 53 |
| 2553 E Catawba Dr | 0.38mi | 3/2.0 (-1) | 2,028 (-11%) | 5mo | $210,000 | $104 | 53 |
| 3864 Nathan Kornman Dr | 0.64mi | 3/2.0 (-1) | 1,986 (-13%) | 2mo | $228,000 | $115 | 41 |
Match score weights: distance 35% · size 25% · config 20% · recency 20%. Top-matched comps best support the ARV.
Projected returns pro-forma
-3.0% appreciation · 0.0% rent growth · sell at horizon
- IRR
- -13.4%
- Equity multiple
- 0.53×
- Total profit
- $-30,763
- Equity at exit
- $35,039
- IRR
- -9.5%
- Equity multiple
- 0.49×
- Total profit
- $-33,773
- Equity at exit
- $20,319
Cash invested: $65,800 (down + closing). Projections, not guarantees.
Landlord ↔ Tenant lean methodology
- Overall (STATE)
- 90 Strongly Landlord-Friendly
- State Louisiana
- 90 Strongly Landlord-Friendly · R+12
- County
- — inherits STATE
- City
- — inherits STATE
ZIP-level market 70058
- Rents YoY
- -3.9%
- Active inventory
- 187
- Price-to-rent
- 9.1×
Monthly cashflow live
- Estimated rent
- $2,153 high interval (Pro) →
- Mortgage (P&I)
- −$1,232
- Tax from tax record
- −$90 /mo · $1,076/yr
- Insurance
- −$98
- Flood insurance flood zone
- −$66 /mo · $798/yr
- HOA
- −$0
- Vacancy / Maint / Mgmt
- −$452
- Net cashflow
- $215
Break-even live
UW: 25.0% down · 7.5% · 30yr · 1.5% tax · 5.0% vac · 8.0% maint · 8.0% mgmt
Financing live
Cash to close
- Down payment
- $58,750
- Closing costs
- $7,050
- Reserves months
- —
- Total cash needed
- —
Loan-product check · same deal, 3 products live
Conventional
25% down · 7.5% · 30yr
- Down + closing
- —
- Monthly P&I
- —
- Monthly cashflow
- —
- DSCR
- —
- Eligible?
- —
Personal DTI + credit; lowest rate.
DSCR
20% down · 8.5% · 30yr
- Down + closing
- —
- Monthly P&I
- —
- Monthly cashflow
- —
- DSCR
- —
- Eligible?
- —
No personal income docs; deal must DSCR.
Hard money
10% down · 12.0% · 12mo
- Down + closing
- —
- Monthly P&I
- —
- Monthly cashflow
- —
- DSCR
- —
- Eligible?
- —
Short-term bridge; refi at stabilization.
Rent comps 8 comps
| Address | Beds | Baths | Sqft | Rent | $/sqft | DOM | Units | Dist |
|---|---|---|---|---|---|---|---|---|
| 2236 Litchwood Ln Harvey, LA | 4.0 | 2.0 | 1800 | $2,200 | $1.22 | 3d | 1 | 0.31mi |
| 2236 Litchwood Ln Harvey, LA | 4.0 | 2.0 | 1800 | $2,200 | $1.22 | 2d | 1 | 0.31mi |
| 4016 S Dells St Harvey, LA | 4.0 | 2.0 | 1750 | $2,000 | $1.14 | 43d | 1 | 0.39mi |
| 2424 Oakmere Dr Harvey, LA | 4.0 | 2.0 | 3000 | $2,400 | $0.80 | 23d | 1 | 0.55mi |
| 2713 W Friendship Dr Harvey, LA | 3.0 | 2.0 | 1750 | $1,850 | $1.06 | 23d | 1 | 1.03mi |
| 2278 Telestar St Harvey, LA | 4.0 | 2.0 | 2121 | $2,450 | $1.16 | 23d | 1 | 1.14mi |
| 2323 N Harper Dr Harvey, LA | 3.0 | 2.0 | 1678 | $3,000 | $1.79 | 43d | 1 | 1.17mi |
| 2612 Susie Ct Marrero, LA | 3.0 | 2.0 | 1852 | $2,200 | $1.19 | 20d | 1 | 1.22mi |
Listing history 21 events
-
2026-06-19price $235,000 Active 73 DOM
-
2026-06-18days on market $239,000 Active 73 DOM
-
2026-06-17days on market $239,000 Active 72 DOM
-
2026-06-16days on market $239,000 Active 71 DOM
-
2026-06-15days on market $239,000 Active 70 DOM
-
2026-06-13days on market $239,000 Active 68 DOM
-
2026-06-10days on market $239,000 Active 65 DOM
-
2026-06-09days on market $239,000 Active 64 DOM
-
2026-06-08days on market $239,000 Active 63 DOM
-
2026-06-07days on market $239,000 Active 62 DOM
-
2026-06-03days on market $239,000 Active 58 DOM
-
2026-06-02days on market $239,000 Active 57 DOM
-
2026-06-01days on market $239,000 Active 56 DOM
-
2026-05-31days on market $239,000 Active 55 DOM
-
2026-04-06$239,000 Active 295-char remark
Show marketing remark (295 chars)
WELL MAINTAINED BELLEWOOD MODEL, ALL MAINT FREE EXTERIOR, NEWER ROOF, LOTS OF IMPROVEMENTS, NEWER SS GRANITE KITCHEN, RECESSED LIGHTING, TILED FLOORS AND CARPET ON STAIRS AND BDRMS. FULL SIZE COVERED CONCRETE PATIO ACROSS REAR, ROLL DOWN STORM SHUTTERS, NICE WORKSHOP WITH WATER AND ELECTRICITY.
-
2009-11-20$149,900
-
2009-11-20$149,900
-
2008-06-17$160,000
-
2008-06-17$160,000
-
1991-03-01soldstatus $62,500
ⓘ Source: listings_history table (triggers on properties + properties_extension) + one-shot
backfill from property_details.listing_events for pre-trigger history.
Tax reassessment forecast LA · Resets to sale price
- Current annual tax
- $1,076 · $90/mo
- Projected year-2 tax
- $1,292 · $108/mo
- Expected delta
- +$217/yr (+$18/mo · 20.2%)
ⓘ Screening estimate from a state-policy table — verify with the county assessor before closing.
Climate risk First Street
- Flood 8/10 Severe FEMA zone X · 60% chance over 30 yrs
- Wildfire 1/10 Low
- Heat 10/10 Extreme 7 d/yr ≥108°F today · 22 d/yr by 30 yrs out
- Wind 10/10 Extreme 99% chance of damaging wind over 30 yrs
- Air quality 3/10 Moderate 3 unhealthy d/yr today · 4 by 30 yrs out
Nearby sold comps map
Loading sold comps map…
Walkable amenities ~0.75 mi
Loading nearby amenities…
Taxation est. · year 1
- Rental income
- $25,840
- − Mortgage interest
- −$13,164
- − Property taxes
- −$1,076
- − Insurance
- −$1,972
- − Repairs & maintenance
- −$2,067
- − Management
- −$2,067
- − Depreciation
- −$6,836
- Taxable loss
- −$1,342
- Est. tax savings @ 24.0%
- +$322
- After-tax cash flow
- $2,900/yr
For passive investors: Depreciation is non-cash, so a rental often shows a tax loss while cash-flowing — sheltering income. Rental losses are passive: they offset passive income freely, and up to $25,000/yr can offset ordinary (W-2) income if you actively participate and your MAGI is under $100k (phasing out to $0 by $150k); unused losses carry forward. On sale, claimed depreciation is recaptured at up to 25%, and gains may owe capital-gains tax (a 1031 exchange can defer both). Figures are a year-1 estimate at your 24.0% rate — not tax advice; consult a CPA.
Schools (NCES district)
- District
- Jefferson Parish
- NCES district ID
- 2200840
- Math proficiency
- 24% ▼ -36.00%
- Reading proficiency
- 34% ▼ -30.00%
- Median HH income
- $48,421
- Composite
- 25.19/100
- National rank
- #7511
- State rank
- #44 of 98 in LA
Livability — Woodmere
- Score
- 62/100
- State rank
- #216
- US rank
- #16658
Category grades
Schools grade is shown separately in the Schools card above.
Census & demographics
- Census place
- Woodmere, LA
- County
- Jefferson Parish · 426,999 people
- Metro
- New Orleans-Metairie, LA
- Population (ZIP)
- 39,578
- Household income
- $62,416
- Rent vs Own
- Severe rent burden
- 1992.0
Population outlook (Jefferson County) Hauer SSP2
- Today (2025)
- 451,696 people
- By 2030
- 455,451 · +0.8%
- By 2040
- 458,308 · +1.5%
- By 2050
- 461,031 · +2.1%
- By 2075
- 476,351 · +5.5%
- By 2100
- 499,377 · +10.6%
Race, ethnicity, and origin ACS 2023
- Neighborhood character
- Diverse neighborhood (Simpson 0.60)
- Race & ethnicity
- Black 58% White 20% Hispanic / Latino 13% Asian 7% Two or more races 4%
- Hispanic origin (detail)
- Mexican 1% Dominican 1%
- Common ancestry
- Lithuanian 4% Hispanic 1%
- Foreign-born
- 13% · Canada, Vietnam
- Languages at home
- 81% English-only · Spanish 10% Vietnamese 5% French/Haitian/Cajun 2%
Political lean MEDSL · Jefferson
- 2024 margin
- R (+12.9) · D 42.5% · R 55.5% · Other 2.1%
- 2008→2024 swing
- +13.6pp toward D · 2008: -26.6pp · 2024: -12.9pp
- All cycles
- 2024: R+12.9 2020: R+11.1 2016: R+14.8 2012: R+18.4 2008: R+26.6
Not yet ingested
- Civics
- —
Market trends
- HPI YoY
- ▼ -96.82%
- Current HPI
- 156.1052
- Rent YoY
- ▼ -3.88%
- Metro
- New Orleans-Metairie, LA
- State GDP YoY
- ▲ 3.29%
- F500 in state
- 10
Industry mix (Fortune 500 HQ in LA)
| Industry | F500 HQs | Revenue |
|---|---|---|
| Telecommunications | 2 | $23B |
|
||
| Utilities | 1 | $12B |
|
||
| Wholesale / Distribution | 1 | $5B |
|
||
| Advertising | 1 | $2B |
|
||
Price history
+282.4% since first listed7 events — show timeline
- 2026-04-06 Listed $239,000 GSREIN
- 2026-04-06 Listed $239,000 AcadianaMLS
- 2009-11-20 Listed $149,900 GSREIN
- 2009-11-20 Listed $149,900 AcadianaMLS
- 2008-06-17 Listed $160,000 GSREIN
- 2008-06-17 Listed $160,000 AcadianaMLS
- 1991-03-01 Sold (Public Records) $62,500 Public Records
Property tax history
+1.1%/yrLatest (2025): $1,076 · +0.3% YoY. Source: county tax records.
Cash-flow waterfall
monthlySold comps — $/sqft
last 12 mo · ≤1 miLoading sold comps…