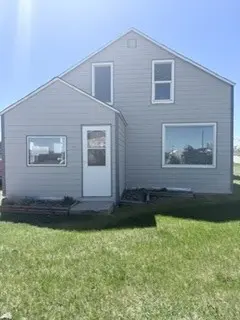
400 Main Ave · Denton, MT
Flood risk No data
- FEMA flood zone
- —
- Chance of flooding over 30 yrs
- —
- Est. flood insurance / yr
- —
Fire risk No data
- Est. fire insurance / yr
- —
Heat risk No data
- Hot days now (above threshold)
- —
- Hot days in 30 yrs
- —
Wind risk No data
- Chance of severe wind over 30 yrs
- —
Air-quality risk No data
- Unhealthy air days now
- —
- Unhealthy air days in 30 yrs
- —
Risk factors via First Street. Map © Google.
Why this score? — see what drove the B+ grade
The composite is a weighted blend of 9 inputs, each scored 0–100. Each bar is that input's sub-score; the figure is the points it added to the 100-point composite (weight × sub-score).
- Cash flow +30.0/30.0
- DSCR +10.0/10.0
- Appreciation +10.0/10.0
- 1% rule +8.7/10.0
- ARV discount +7.5/15.0
- Schools +4.4/10.0
- Livability +3.5/5.0
- Rent growth +2.5/5.0
- Condition / age +2.5/5.0
$115,000
🖨 Deal sheet 📄 Offer letter ✓ Due diligence
Key facts
- 6,926 sq ft lot
- Garage
- Built 1915
Property features AI
Exterior
- Parking: Detached garage with 1 car space; RV access/parking; On-street parking
- Utilities: Electricity available; Public sewer
- Home design: Single-family residence; Two levels
- Construction: Aluminum siding; Composition roof; Basement: crawl space with concrete
- Exterior features: Chain link and wood fencing; Level lot; Front yard; Asphalt and gravel road access
Interior
- Kitchen: Range; Refrigerator
- Bathrooms: One full bathroom
- Heating & cooling: Baseboard heating; Electric heating; Pellet stove
- Interior features: Range; Refrigerator; One fireplace
- Laundry & utility: Washer hookup; Crawl space/concrete basement
Neighborhood map
What this means for you Summary
Snapshot
- This is a 4-bed/1.5-bath single-family listed at $115k.
Deal economics
- At list price, monthly cash flow is $503 ($6k/yr) — positive.
- The deal already cash-flows at list — no discount required.
- Meets the 1% rule at list price ($2k rent vs $115k).
Location & tenants
- Location reads 69/100 on livability (#83 in MT) — a middle-class / working-renter tenant base. Strengths: cost of living A+, housing A+, schools B+; Watch: health & safety C-, crime F, amenities F.
- Denton H S (rural): math 50% / reading 50% proficiency, ranked #75 of 339 in MT (top 22%) — acceptable for families but not a draw, mixed tenant base, ~2y average lease.
- Market conditions: 5 active listings in the ZIP; 4 units permitted in Fergus County in 2024 (0 in 5+ unit buildings).
Forward outlook
- In year one you build about $12k of equity ($795 loan paydown + $12k appreciation (10.0% local appreciation)).
- Fergus County population projected to shrink 9% by 2050 — rents likely to lag national; underwrite the cash flow, not the appreciation.
- At projected returns (10.0% appreciation + 3.0% rent growth), your $32k cash investment doubles in ~2 years — after that, you're playing with house money.
- By year 3, paydown + projected appreciation supports a ~$31k cash-out refi (75% LTV) — recoverable capital for the next deal without selling this one.
Negotiation context
- Only 14 days on market — expect competitive offers; lowballing is unlikely to land.
Risks & watch-outs
- Watch-outs: built in 1915 — expect roof / HVAC / electrical / plumbing capex.
Questions for the listing agent
- Built in 1915 — when were the roof, HVAC, electrical panel, plumbing, and water heater last replaced?
- Is there a deadline driving the sale (1031 exchange, divorce, estate, relocation)? That informs how much negotiation room exists.
- Schools are B-rated — typically a magnet for longer-tenancy family renters. What's the average tenant stay here, and is there a school-zone premium baked into asking?
- Crime grade is F in this area — have there been break-ins, vandalism, or insurance claims at this property in the last 3 years? What carrier currently insures it and at what premium?
- What's the average days-on-market for RENTAL listings here right now (not sales)? A rising rental-DOM trend means longer vacancies and softer asking-rent achievability than the comps imply.
- What's the recent tenant-quality profile in this submarket — average credit score on applications, eviction rate, late-payment / NSF rate, and stable-employment percentage? A property-management company in the area should have these aggregated.
- How much new for-sale + rental construction is in the pipeline within 1–3 miles? Heavy new supply typically softens prices + rents 12–24 months out; constrained supply supports both.
Investment metrics
- 1% rule
- 1.37% ✓
- Cap rate
- 11.55%
- Cash-on-cash
- 18.76%
- DSCR
- 1.83
- GRM
- 6.1
CMA / ARV
No comps found within radius.
Projected returns pro-forma
10.0% appreciation · 3.0% rent growth · sell at horizon
- IRR
- 38.2%
- Equity multiple
- 3.94×
- Total profit
- $94,682
- Equity at exit
- $103,601
- IRR
- 32.9%
- Equity multiple
- 8.88×
- Total profit
- $253,598
- Equity at exit
- $223,420
Cash invested: $32,200 (down + closing). Projections, not guarantees.
Landlord ↔ Tenant lean methodology
- Overall (STATE)
- 82 Strongly Landlord-Friendly
- State Montana
- 82 Strongly Landlord-Friendly · R+11
- County
- — inherits STATE
- City
- — inherits STATE
ZIP-level market 59430
- Home prices YoY
- 6.7%
- Active inventory
- 5
- Price-to-rent
- 6.1×
Monthly cashflow live
- Estimated rent
- $1,578 medium interval (Pro) →
- Mortgage (P&I)
- −$603
- Tax from tax record
- −$93 /mo · $1,112/yr
- Insurance
- −$48
- HOA
- −$0
- Vacancy / Maint / Mgmt
- −$331
- Net cashflow
- $503
Break-even live
UW: 25.0% down · 7.5% · 30yr · 1.5% tax · 5.0% vac · 8.0% maint · 8.0% mgmt
Financing live
Cash to close
- Down payment
- $28,750
- Closing costs
- $3,450
- Reserves months
- —
- Total cash needed
- —
Loan-product check · same deal, 3 products live
Conventional
25% down · 7.5% · 30yr
- Down + closing
- —
- Monthly P&I
- —
- Monthly cashflow
- —
- DSCR
- —
- Eligible?
- —
Personal DTI + credit; lowest rate.
DSCR
20% down · 8.5% · 30yr
- Down + closing
- —
- Monthly P&I
- —
- Monthly cashflow
- —
- DSCR
- —
- Eligible?
- —
No personal income docs; deal must DSCR.
Hard money
10% down · 12.0% · 12mo
- Down + closing
- —
- Monthly P&I
- —
- Monthly cashflow
- —
- DSCR
- —
- Eligible?
- —
Short-term bridge; refi at stabilization.
Listing history 10 events
-
2026-06-18days on market $115,000 Active 14 DOM
-
2026-06-17days on market $115,000 Active 13 DOM
-
2026-06-16days on market $115,000 Active 12 DOM
-
2026-06-15days on market $115,000 Active 11 DOM
-
2026-06-13days on market $115,000 Active 9 DOM
-
2026-06-12days on market $115,000 Active 8 DOM
-
2026-06-09days on market $115,000 Active 5 DOM
-
2026-06-08days on market $115,000 Active 4 DOM
-
2026-06-07days on market $115,000 Active 3 DOM
-
2026-06-05$115,000 Active 1 DOM
ⓘ Source: listings_history table (triggers on properties + properties_extension) + one-shot
backfill from property_details.listing_events for pre-trigger history.
Tax reassessment forecast MT · Resets to sale price
- Current annual tax
- $1,112 · $93/mo
- Projected year-2 tax
- $1,112 · $93/mo
- Expected delta
- $0/yr ($0/mo · 0.0%)
ⓘ Screening estimate from a state-policy table — verify with the county assessor before closing.
Nearby sold comps map
Loading sold comps map…
Walkable amenities ~0.75 mi
Loading nearby amenities…
Taxation est. · year 1
- Rental income
- $18,942
- − Mortgage interest
- −$6,442
- − Property taxes
- −$1,112
- − Insurance
- −$575
- − Repairs & maintenance
- −$1,515
- − Management
- −$1,515
- − Depreciation
- −$3,345
- Taxable income
- $4,437
- Est. tax owed @ 24.0%
- −$1,065
- After-tax cash flow
- $4,975/yr
For passive investors: Depreciation is non-cash, so a rental often shows a tax loss while cash-flowing — sheltering income. Rental losses are passive: they offset passive income freely, and up to $25,000/yr can offset ordinary (W-2) income if you actively participate and your MAGI is under $100k (phasing out to $0 by $150k); unused losses carry forward. On sale, claimed depreciation is recaptured at up to 25%, and gains may owe capital-gains tax (a 1031 exchange can defer both). Figures are a year-1 estimate at your 24.0% rate — not tax advice; consult a CPA.
Schools (NCES district)
- District
- Denton H S
- NCES district ID
- 3008850
- Math proficiency
- 50% ▲ 53.00%
- Reading proficiency
- 50% ▲ 53.00%
- Median HH income
- $46,573
- Composite
- 44.48/100
- National rank
- #6076
- State rank
- #75 of 339 in MT
Livability — Denton
- Score
- 69/100
- State rank
- #83
- US rank
- #8353
Category grades
Schools grade is shown separately in the Schools card above.
Census & demographics
- Census place
- Denton, MT
- Population (ZIP)
- 476
Population outlook (Fergus County) Hauer SSP2
- Today (2025)
- 10,955 people
- By 2030
- 10,722 · -2.1%
- By 2040
- 10,274 · -6.2%
- By 2050
- 9,993 · -8.8%
- By 2075
- 10,766 · -1.7%
- By 2100
- 10,922 · -0.3%
Race, ethnicity, and origin ACS 2023
- Neighborhood character
- Predominantly White (98%)
- Race & ethnicity
- White 98% Two or more races 2%
- Common ancestry
- Portuguese 21% Slovak 5% Romanian 3%
Political lean MEDSL · Fergus
- 2024 margin
- Solid R (+51.3) · D 22.7% · R 74.0% · Other 3.4%
- 2008→2024 swing
- -16.4pp toward R · 2008: -34.9pp · 2024: -51.3pp
- All cycles
- 2024: R+51.3 2020: R+51.6 2016: R+52.6 2012: R+43.3 2008: R+34.9
Not yet ingested
- Civics
- —
Market trends
- HPI YoY
- ▲ 13.09%
- Current HPI
- 207.6
- Rent YoY
- —
- Metro
- —
- State GDP YoY
- ▲ 3.41%
- F500 in state
- 2
Industry mix (Fortune 500 HQ in MT)
| Industry | F500 HQs | Revenue |
|---|---|---|
| Technology / Analytics | 1 | $2B |
|
||
Price history
4 events — show timeline
- 2026-06-04 Listed $115,000 MRMLS
- 2020-10-06 Sold (Public Records) — Public Records
- 2012-07-27 Sold (Public Records) — Public Records
- 1997-01-31 Sold (Public Records) — Public Records
Property tax history
+9.9%/yrLatest (2025): $1,112 · -13.0% YoY. Source: county tax records.
Cash-flow waterfall
monthlySold comps — $/sqft
last 12 mo · ≤1 miLoading sold comps…