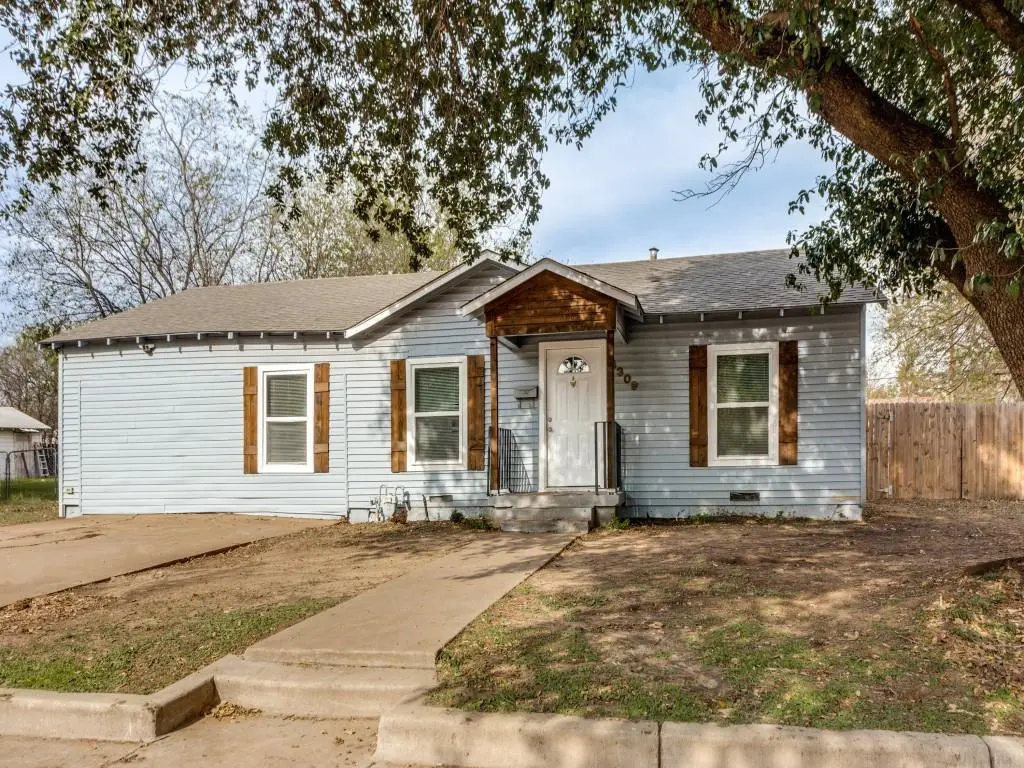
4309 Patricia St · Haltom City, TX
Flood risk 1/10 · Minimal
- FEMA flood zone
- X (unshaded)
- Chance of flooding over 30 yrs
- 0.0%
- Est. flood insurance / yr
- $507 – $1,088
Fire risk 1/10 · Minimal
- Est. fire insurance / yr
- $1,222 – $2,270
Heat risk 7/10 · Major
- Hot days now (above 110°F)
- 7 days/yr
- Hot days in 30 yrs
- 22 days/yr
Wind risk 4/10 · Minor
- Chance of severe wind over 30 yrs
- 24.0%
Air-quality risk 4/10 · Minor
- Unhealthy air days now
- 4 days/yr
- Unhealthy air days in 30 yrs
- 5 days/yr
Risk factors via First Street. Map © Google.
Why this score? — see what drove the D+ grade
The composite is a weighted blend of 9 inputs, each scored 0–100. Each bar is that input's sub-score; the figure is the points it added to the 100-point composite (weight × sub-score).
- ARV discount +14.9/15.0
- Cash flow +10.3/30.0
- Rent growth +4.5/5.0
- Schools +3.7/10.0
- 1% rule +3.4/10.0
- Livability +3.3/5.0
- DSCR +2.9/10.0
- Condition / age +2.5/5.0
- Appreciation +0.0/10.0
$189,900
🖨 Deal sheet 📄 Offer letter ✓ Due diligence
Listing remarks MLS
Four bedroom and one and a half bath sits on one third of an acre. Primary bedroom has the half bath. Close to Downtown Fort Worth, 121 and 820. Great investment property. New windows. Come take a look. Selling as is.
Key facts
- New windows
- 0.31 acre lot
- Built 1952
Tags
Neighborhood map
What this means for you Summary
Snapshot
- This is a 3-bed/1.0-bath single-family listed at $190k.
Deal economics
- At list price, monthly cash flow is $-105 ($-1k/yr) — negative.
- To cash-flow at today's rent, offer at most $171k (9.8% below list).
- To meet the 1% rule (rent ≥ 1% of price), the offer needs to be $159k (16.3% below list).
- Recommended offer: $159k (16.3% below list) — sets the bar for 1% rule.
- Cap rate 5.6% vs local median 4.3% in Haltom City — top-decile yield for the area; either an underpriced asset or a hidden risk that comps aren't pricing in. Stress-test before assuming the spread holds.
Location & tenants
- Location reads 66/100 on livability (#644 in TX) — a middle-class / working-renter tenant base. Strengths: cost of living A+, housing A+; Watch: employment D+, schools D, amenities F.
- Birdville ISD (suburban): math 42% / reading 43% proficiency, ranked #299 of 826 in TX (top 36%) — families likely to look elsewhere, expect single-tenant / working-renter base with shorter leases.
- Market conditions: Rents rising fast (+7.9%/yr); 125 active listings in the ZIP; 16 comparable units currently listed for rent nearby; rentals leasing fast (median 13d on market — plan ~1-2 weeks tenant-placement turnaround); 18,938 units permitted in Tarrant County in 2024 (8,336 in 5+ unit buildings).
- This rent runs 37% of the median local income ($52k/yr) — at the standard rent-burdened threshold; future hikes will face affordability resistance.
Forward outlook
- Local home prices are declining (-3.0%/yr); year-one equity from $1k of loan paydown is wiped out by about $6k of value loss. Plan a longer hold.
- Tarrant County population projected at +41% by 2050 — long-run rental-demand tailwind backs the buy-and-hold thesis.
Negotiation context
- It's been on market 177 days — a 12% lower offer ($167k) is reasonable based on typical stale-listing flexibility.
- 2 sale attempts; this cycle's ask has dropped $50k (21%) from the opening price — seller is motivated, your offer sets the floor, not the list.
- Current owner paid $51k; list at $190k implies a 273% gain — meaningful room to come down on a strong offer.
Risks & watch-outs
- Watch-outs: built in 1952 — expect roof / HVAC / electrical / plumbing capex.
- Climate carrying-cost: extreme-heat days projected 7→22/yr by 2055 (HVAC capex compounding) — expect insurance premiums to compound above CPI over the hold.
Questions for the listing agent
- What do current leases actually rent for vs. the listed asking? Can we see a recent rent roll and the last 12 months of T-12 income?
- It's been on market 177 days. Have you received any prior offers? Is the seller open to a 16% concession, seller financing, or rate buy-down credit?
- Built in 1952 — when were the roof, HVAC, electrical panel, plumbing, and water heater last replaced?
- Why hasn't it sold? Are there any deal-killer items the seller is aware of (foundation, flood, title, zoning, code violations)?
- Is there a deadline driving the sale (1031 exchange, divorce, estate, relocation)? That informs how much negotiation room exists.
- Schools are D-rated, which usually means shorter tenancies and higher turnover. Who's the typical renter profile here, and what's been the actual vacancy rate?
- The area grade is low — what's the realistic commute time and amenity access for the typical tenant pool here? Any planned neighborhood developments (good or bad) we should know about?
- What's the average days-on-market for RENTAL listings here right now (not sales)? A rising rental-DOM trend means longer vacancies and softer asking-rent achievability than the comps imply.
- What's the recent tenant-quality profile in this submarket — average credit score on applications, eviction rate, late-payment / NSF rate, and stable-employment percentage? A property-management company in the area should have these aggregated.
- How much new for-sale + rental construction is in the pipeline within 1–3 miles? Heavy new supply typically softens prices + rents 12–24 months out; constrained supply supports both.
Investment metrics
- 1% rule
- 0.84% ✗
- Cap rate
- 5.63%
- Cash-on-cash
- -2.38%
- DSCR
- 0.89
- GRM
- 10.0
CMA / ARV
- ARV (median comp)
- $227,133
- List price
- $189,900
- Delta
- -16.39%
- Verdict
- UNDERPRICED
- Comps
- 20 within 1.0 mi
Show comp detail 12 sales within ~0.75 mi
| Address | Dist | Beds/Ba | Sqft | Sold | Price | $/sf | Match |
|---|---|---|---|---|---|---|---|
| 4308 Patricia St | 0.03mi | 3/1.0 | 909 (-7%) | 8mo | $167,000 | $184 | 80 |
| 4320 Voncille St | 0.10mi | 2/1.0 (-1) | 1,071 (+9%) | 2mo | $145,000 | $135 | 73 |
| 4229 Voncille St | 0.15mi | 3/2.0 | 1,104 (+13%) | 6mo | $199,900 | $181 | 63 |
| 4809 Monna St | 0.40mi | 3/1.0 | 1,092 (+11%) | 5mo | $220,000 | $201 | 58 |
| 4405 Mckibben St | 0.14mi | 3/2.0 | 1,104 (+13%) | 13mo | $224,000 | $203 | 58 |
| 3736 Layton Ave | 0.44mi | 3/1.5 | 1,080 (+10%) | 5mo | $164,900 | $153 | 57 |
| 3600 Katrine St | 0.44mi | 3/1.0 | 1,076 (+10%) | 8mo | $179,990 | $167 | 56 |
| 4821 Jerri Ln | 0.45mi | 3/1.0 | 1,104 (+13%) | 6mo | $240,000 | $217 | 53 |
| 3541 Haltom Rd | 0.62mi | 3/1.0 | 1,074 (+10%) | 6mo | $170,000 | $158 | 51 |
| 5029 Monette St | 0.53mi | 2/1.0 (-1) | 888 (-9%) | 11mo | $200,000 | $225 | 46 |
| 3569 Regal Rd | 0.70mi | 3/1.5 | 1,063 (+8%) | 8mo | $249,000 | $234 | 45 |
| 3405 Eastridge Dr | 0.57mi | 2/1.0 (-1) | 853 (-13%) | 7mo | $175,000 | $205 | 41 |
Match score weights: distance 35% · size 25% · config 20% · recency 20%. Top-matched comps best support the ARV.
Projected returns pro-forma
-3.0% appreciation · 7.89% rent growth · sell at horizon
- IRR
- -14.7%
- Equity multiple
- 0.45×
- Total profit
- $-29,216
- Equity at exit
- $28,315
- IRR
- 0.8%
- Equity multiple
- 1.06×
- Total profit
- $3,416
- Equity at exit
- $16,419
Cash invested: $53,172 (down + closing). Projections, not guarantees.
Landlord ↔ Tenant lean methodology
- Overall (STATE)
- 87 Strongly Landlord-Friendly
- State Texas
- 87 Strongly Landlord-Friendly · R+5
- County
- — inherits STATE
- City
- — inherits STATE
ZIP-level market 76117
- Home prices YoY
- -23.9%
- Rents YoY
- 7.9%
- Active inventory
- 125
- Price-to-rent
- 10.0×
Monthly cashflow live
- Estimated rent
- $1,590 high interval (Pro) →
- Mortgage (P&I)
- −$996
- Tax from tax record
- −$286 /mo · $3,436/yr
- Insurance
- −$79
- HOA
- −$0
- Vacancy / Maint / Mgmt
- −$334
- Net cashflow
- $-105
Break-even live
UW: 25.0% down · 7.5% · 30yr · 1.5% tax · 5.0% vac · 8.0% maint · 8.0% mgmt
Financing live
Cash to close
- Down payment
- $47,475
- Closing costs
- $5,697
- Reserves months
- —
- Total cash needed
- —
Loan-product check · same deal, 3 products live
Conventional
25% down · 7.5% · 30yr
- Down + closing
- —
- Monthly P&I
- —
- Monthly cashflow
- —
- DSCR
- —
- Eligible?
- —
Personal DTI + credit; lowest rate.
DSCR
20% down · 8.5% · 30yr
- Down + closing
- —
- Monthly P&I
- —
- Monthly cashflow
- —
- DSCR
- —
- Eligible?
- —
No personal income docs; deal must DSCR.
Hard money
10% down · 12.0% · 12mo
- Down + closing
- —
- Monthly P&I
- —
- Monthly cashflow
- —
- DSCR
- —
- Eligible?
- —
Short-term bridge; refi at stabilization.
Rent comps 16 comps
| Address | Beds | Baths | Sqft | Rent | $/sqft | DOM | Units | Dist |
|---|---|---|---|---|---|---|---|---|
| 4233 Voncille St Haltom City, TX | 3.0 | 1.0 | 1085 | $1,740 | $1.60 | 15d | 1 | 0.13mi |
| 3301 Aurora St Unit D Haltom City, TX | 2.0 | 1.5 | 1120 | $1,600 | $1.43 | 24d | 1 | 0.22mi |
| 3301 Aurora St Haltom City, TX | 2.0 | 1.0 | 1120 | $1,600 | $1.43 | 24d | 1 | 0.22mi |
| 3301 Aurora St Haltom City, TX | 2.0 | 1.5 | 1120 | $1,600 | $1.43 | 43d | 1 | 0.22mi |
| 3301 Aurora St Unit B Haltom City, TX | 2.0 | 1.5 | 1116 | $1,500 | $1.34 | 2d | 1 | 0.22mi |
| 3736 Layton Ave Haltom City, TX | 3.0 | 1.5 | 1100 | $1,600 | $1.45 | 43d | 1 | 0.41mi |
| 5100 Herrick Ct Haltom City, TX | 2.0 | 2.0 | 901 | $1,075 | $1.19 | 6d | 1 | 0.91mi |
| 4425 Jane Anne St Haltom City, TX | 3.0 | 1.5 | 1025 | $1,800 | $1.76 | 24d | 1 | 1.23mi |
| 5501 Adams Dr Haltom City, TX | 3.0 | 2.0 | 1125 | $1,580 | $1.40 | 11d | 1 | 1.24mi |
| 5501 Adams Dr Haltom City, TX | 3.0 | 2.0 | 1125 | $1,560 | $1.39 | 3d | 1 | 1.24mi |
| 5501 Adams Dr Haltom City, TX | 2.0 | 1.0 | 889 | $1,215 | $1.37 | 12d | 1 | 1.24mi |
| 5501 Adams Dr Haltom City, TX | 2.0 | 1.0 | 889 | $1,215 | $1.37 | 11d | 1 | 1.24mi |
| 5501 Adams Dr Haltom City, TX | 2.0 | 1.0 | 889 | $1,250 | $1.41 | 43d | 1 | 1.24mi |
| 5501 Adams Dr Haltom City, TX | 2.0 | 1.0 | 889 | $1,215 | $1.37 | 3d | 1 | 1.24mi |
| 4200 Northern Cross Blvd Haltom City, TX | 1.0–3.0 | 1.0–2.0 | 979 | $1,980 | $2.02 | 1d | 30 | 1.40mi |
| 4100 Northern Cross Blvd Fort Worth, TX | 3.0 | 1.0–2.0 | 948 | $2,921 | $3.08 | 1d | 35 | 1.42mi |
Listing history 12 events
-
2026-06-01days on market $189,900 Active 177 DOM
-
2026-05-31days on market $189,900 Active 176 DOM
-
2026-04-06price $189,900 217-char remark
Show marketing remark (217 chars)
Four bedroom and one and a half bath sits on one third of an acre. Primary bedroom has the half bath. Close to Downtown Fort Worth, 121 and 820. Great investment property. New windows. Come take a look. Selling as is.
-
2026-04-06status Active 217-char remark
Show marketing remark (217 chars)
Four bedroom and one and a half bath sits on one third of an acre. Primary bedroom has the half bath. Close to Downtown Fort Worth, 121 and 820. Great investment property. New windows. Come take a look. Selling as is.
-
2026-03-28historical Active Option Contract 217-char remark
Show marketing remark (217 chars)
Four bedroom and one and a half bath sits on one third of an acre. Primary bedroom has the half bath. Close to Downtown Fort Worth, 121 and 820. Great investment property. New windows. Come take a look. Selling as is.
-
2026-03-12price $205,000 217-char remark
Show marketing remark (217 chars)
Four bedroom and one and a half bath sits on one third of an acre. Primary bedroom has the half bath. Close to Downtown Fort Worth, 121 and 820. Great investment property. New windows. Come take a look. Selling as is.
-
2026-03-03price $219,000 217-char remark
Show marketing remark (217 chars)
Four bedroom and one and a half bath sits on one third of an acre. Primary bedroom has the half bath. Close to Downtown Fort Worth, 121 and 820. Great investment property. New windows. Come take a look. Selling as is.
-
2026-02-04price $225,000 217-char remark
Show marketing remark (217 chars)
Four bedroom and one and a half bath sits on one third of an acre. Primary bedroom has the half bath. Close to Downtown Fort Worth, 121 and 820. Great investment property. New windows. Come take a look. Selling as is.
-
2026-01-08price $234,900 217-char remark
Show marketing remark (217 chars)
Four bedroom and one and a half bath sits on one third of an acre. Primary bedroom has the half bath. Close to Downtown Fort Worth, 121 and 820. Great investment property. New windows. Come take a look. Selling as is.
-
2025-12-06$239,900 Active 217-char remark
Show marketing remark (217 chars)
Four bedroom and one and a half bath sits on one third of an acre. Primary bedroom has the half bath. Close to Downtown Fort Worth, 121 and 820. Great investment property. New windows. Come take a look. Selling as is.
-
1997-12-22soldstatus $50,861
-
1997-07-15soldstatus
ⓘ Source: listings_history table (triggers on properties + properties_extension) + one-shot
backfill from property_details.listing_events for pre-trigger history.
Tax reassessment forecast TX · Resets to sale price
- Current annual tax
- $3,436 · $286/mo
- Projected year-2 tax
- $3,475 · $290/mo
- Expected delta
- +$39/yr (+$3/mo · 1.1%)
ⓘ Screening estimate from a state-policy table — verify with the county assessor before closing.
Climate risk First Street
- Flood 1/10 Low FEMA zone X (unshaded) · 0% chance over 30 yrs
- Wildfire 1/10 Low
- Heat 7/10 Severe 7 d/yr ≥110°F today · 22 d/yr by 30 yrs out
- Wind 4/10 Moderate 24% chance of damaging wind over 30 yrs
- Air quality 4/10 Moderate 4 unhealthy d/yr today · 5 by 30 yrs out
Nearby sold comps map
Loading sold comps map…
Walkable amenities ~0.75 mi
Loading nearby amenities…
Taxation est. · year 1
- Rental income
- $19,079
- − Mortgage interest
- −$10,637
- − Property taxes
- −$3,436
- − Insurance
- −$950
- − Repairs & maintenance
- −$1,526
- − Management
- −$1,526
- − Depreciation
- −$5,524
- Taxable loss
- −$4,521
- Est. tax savings @ 24.0%
- +$1,085
- After-tax cash flow
- $-179/yr
For passive investors: Depreciation is non-cash, so a rental often shows a tax loss while cash-flowing — sheltering income. Rental losses are passive: they offset passive income freely, and up to $25,000/yr can offset ordinary (W-2) income if you actively participate and your MAGI is under $100k (phasing out to $0 by $150k); unused losses carry forward. On sale, claimed depreciation is recaptured at up to 25%, and gains may owe capital-gains tax (a 1031 exchange can defer both). Figures are a year-1 estimate at your 24.0% rate — not tax advice; consult a CPA.
Schools (NCES district)
- District
- Birdville ISD
- NCES district ID
- 4810230
- Math proficiency
- 42% ▼ -12.00%
- Reading proficiency
- 43% ▼ -6.00%
- Median HH income
- $55,930
- Composite
- 37.13/100
- National rank
- #4491
- State rank
- #299 of 826 in TX
Livability — Haltom City
- Score
- 66/100
- State rank
- #644
- US rank
- #12214
Category grades
Schools grade is shown separately in the Schools card above.
Census & demographics
- Census place
- Haltom City, TX
- County
- Tarrant County · 2,033,669 people
- City population
- 32,950
- Metro
- Dallas-Fort Worth-Arlington, TX
- Population (ZIP)
- 32,950
- Household income
- $51,670
- Rent vs Own
- Severe rent burden
- 1105.0
Population outlook (Tarrant County) Hauer SSP2
- Today (2025)
- 2,380,417 people
- By 2030
- 2,578,900 · +8.3%
- By 2040
- 2,974,995 · +25.0%
- By 2050
- 3,350,489 · +40.8%
- By 2075
- 4,216,909 · +77.2%
- By 2100
- 4,741,527 · +99.2%
Race, ethnicity, and origin ACS 2023
- Neighborhood character
- Diverse neighborhood (Simpson 0.64)
- Race & ethnicity
- Hispanic / Latino 46% White 38% Two or more races 18% Asian 7% Black 6%
- Hispanic origin (detail)
- Mexican 42% Puerto Rican 1%
- Common ancestry
- Italian 2% Serbian 1% Lithuanian 1%
- Foreign-born
- 24% · Canada, Vietnam
- Languages at home
- 56% English-only · Spanish 36% Other Asian/Pacific 4% Vietnamese 2%
Political lean MEDSL · Tarrant
- 2024 margin
- Lean R (+5.1) · D 46.7% · R 51.9% · Other 1.4%
- 2008→2024 swing
- +6.6pp toward D · 2008: -11.7pp · 2024: -5.1pp
- All cycles
- 2024: R+5.1 2020: D+0.2 2016: R+8.7 2012: R+15.7 2008: R+11.7
Not yet ingested
- Civics
- —
Market trends
- HPI YoY
- ▼ -103.25%
- Current HPI
- 328.69
- Rent YoY
- ▲ 7.89%
- Metro
- Dallas-Fort Worth-Arlington, TX
- State GDP YoY
- ▲ 3.95%
- F500 in state
- 110
Industry mix (Fortune 500 HQ in TX)
| Industry | F500 HQs | Revenue |
|---|---|---|
| Energy | 16 | $1,198B |
|
||
| Technology | 5 | $198B |
|
||
| Engineering / Construction | 4 | $72B |
|
||
| Energy Services | 3 | $60B |
|
||
| Utilities | 3 | $41B |
|
||
| Healthcare | 2 | $330B |
|
||
Price history
+273.4% since first listed10 events — show timeline
- 2026-04-06 Price Changed $189,900 NTREIS
- 2026-04-06 Relisted — NTREIS
- 2026-03-28 Contingent — NTREIS
- 2026-03-12 Price Changed $205,000 NTREIS
- 2026-03-03 Price Changed $219,000 NTREIS
- 2026-02-04 Price Changed $225,000 NTREIS
- 2026-01-08 Price Changed $234,900 NTREIS
- 2025-12-06 Listed $239,900 NTREIS
- 1997-12-22 Sold (Public Records) $50,861 Public Records
- 1997-07-15 Sold (Public Records) — Public Records
Property tax history
+5.4%/yrLatest (2025): $3,436 · -17.0% YoY. Source: county tax records.
Cash-flow waterfall
monthlySold comps — $/sqft
last 12 mo · ≤1 miLoading sold comps…