 Duplex
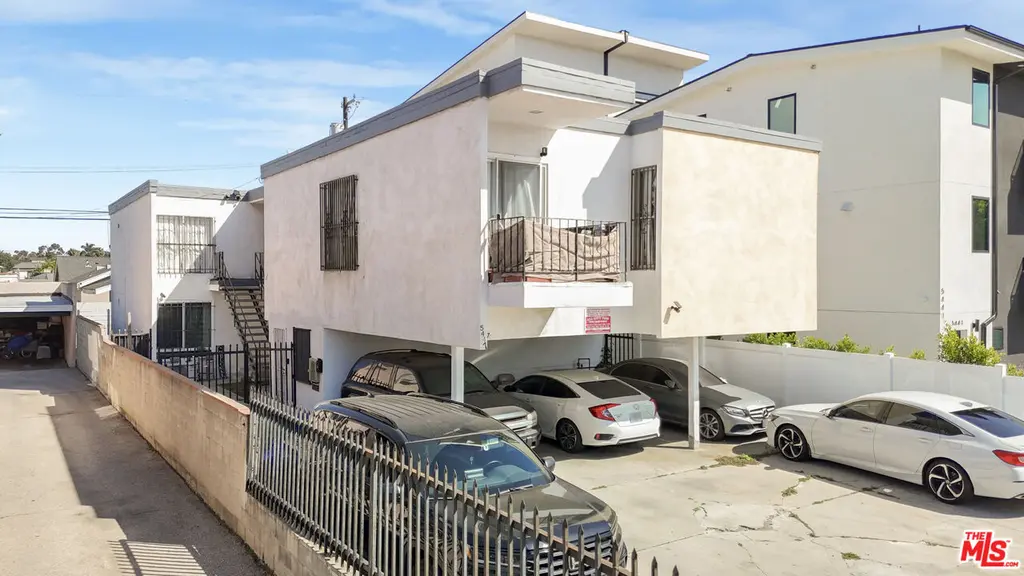
5447 Blackwelder St · Los Angeles, CA
Flood risk 5/10 · Moderate
- FEMA flood zone
- X (unshaded)
- Chance of flooding over 30 yrs
- 0.63%
- Est. flood insurance / yr
- $507 – $1,088
Fire risk 1/10 · Minimal
- Est. fire insurance / yr
- $659 – $1,223
Heat risk 6/10 · Moderate
- Hot days now (above 88°F)
- 7 days/yr
- Hot days in 30 yrs
- 21 days/yr
Wind risk 1/10 · Minimal
- Chance of severe wind over 30 yrs
- —
Air-quality risk 4/10 · Minor
- Unhealthy air days now
- 6 days/yr
- Unhealthy air days in 30 yrs
- 7 days/yr
Risk factors via First Street. Map © Google.
Why this score? — see what drove the C grade
The composite is a weighted blend of 9 inputs, each scored 0–100. Each bar is that input's sub-score; the figure is the points it added to the 100-point composite (weight × sub-score).
- Cash flow +18.5/30.0
- ARV discount +15.0/15.0
- DSCR +5.8/10.0
- 1% rule +4.6/10.0
- Schools +3.6/10.0
- Livability +3.4/5.0
- Rent growth +2.8/5.0
- Condition / age +2.5/5.0
- Appreciation +0.0/10.0
$935,000
🖨 Deal sheet (PDF) 📄 Offer letter ✓ Due diligence
Multi-family units
County records classify this as Multi-Family (2-4 Unit). Listing-text estimate: 2 units. confirmed
Listing remarks MLS
4Plex West Adams for $935,000! Welcome to 5447 Blackwelder St! The property is located in an excellent West Adams Location with 4 Units. The property provides an excellent Unit Mix offering 1 & 2 Bedroom Layouts. Spacious Units are spacious Averaging Approx. 930 SF Each! Approximately Over 58% Rental Upside! Selected Units Offer En Suite Washer/Dryers. Well Parked! 7 Spaces for 4 Units. Tenants pay for trash. Units are separately Metered for Gas/Electric. The property also offers Brand New Electrical Main Panel!
Key facts
- West adams location
- 4,800 sq ft lot
- 7 parking spots
Tags
Neighborhood map
What this means for you Summary
Snapshot
- This is a 2 × 3-bed/?-bath units multifamily listed at $935k.
Deal economics
- At list price, monthly cash flow is $885 ($11k/yr) — positive. Per door: $442/mo.
- The deal already cash-flows at list — no discount required.
- To meet the 1% rule (rent ≥ 1% of price), the offer needs to be $896k (4.2% below list).
- Recommended offer: $823k (12.0% below list) — sets the bar for market timing.
- Cap rate 7.4% vs local median 2.1% in Los Angeles — top-decile yield for the area; either an underpriced asset or a hidden risk that comps aren't pricing in. Stress-test before assuming the spread holds.
Location & tenants
- Location reads 68/100 on livability (#273 in CA) — a middle-class / working-renter tenant base. Strengths: amenities A+, commute A+, employment B; Watch: health & safety C-, crime F, cost of living F.
- Los Angeles Unified (urban): math 29% / reading 54% proficiency, ranked #223 of 517 in CA (top 43%) — families likely to look elsewhere, expect single-tenant / working-renter base with shorter leases; 67% free/reduced lunch — lower-income household profile, screen leases tightly.
- Zoned schools: Marvin Elementary (550 students, 90% FRL); Daniel Webster Middle (442 students, 90% FRL); Valley Academy of Arts And Sciences (math 22% / reading 52%, grade F, #578 of 1,170 statewide, top 51%, 868 students, 64% FRL).
- Market conditions: Rents rising (+1.1%/yr); 150 active listings in the ZIP; 5 comparable units currently listed for rent nearby; rentals lingering (median 45d on market — plan ~5-8 weeks vacancy on turnover, expect pricing pressure); 60% of comp listings sitting > 30 days — soft ceiling on asking rent; 19,697 units permitted in Los Angeles County in 2024 (9,426 in 5+ unit buildings).
- At $8,961/mo this rent would consume 146% of the median local household income ($74k/yr) (locally 3450% of renters already pay >50% of income on rent) — very limited rent-growth headroom before tenants either downsize or default.
Forward outlook
- Local home prices are declining (-3.0%/yr); year-one equity from $6k of loan paydown is wiped out by about $28k of value loss. Plan a longer hold.
- Los Angeles County population projected at +9% by 2050 — modest demand growth; plan on rents tracking national, not racing it.
Negotiation context
- It's been on market 127 days — a 12% lower offer ($823k) is reasonable based on typical stale-listing flexibility.
- 10 sale attempts since 18y ago; this cycle's ask has dropped $140k (13%) from the opening price — seller is motivated, your offer sets the floor, not the list.
- Current owner paid $750k; 25% above their basis — modest negotiation headroom, anchor on the comps not their cost.
Risks & watch-outs
- Climate carrying-cost: moderate flood risk; extreme-heat days projected 7→21/yr by 2055 (HVAC capex compounding) — expect insurance premiums to compound above CPI over the hold.
Questions for the listing agent
- It's been on market 127 days. Have you received any prior offers? Is the seller open to a 12% concession, seller financing, or rate buy-down credit?
- Can we see the unit-by-unit rent roll, current vacancy, and any below-market leases? What's the average tenancy length?
- What capital expenditures (roof, boiler, parking lot, exteriors) have been made in the last 5 years, and what's planned in the next 2?
- Built in 1963 — when were the roof, HVAC, electrical panel, plumbing, and water heater last replaced?
- Why hasn't it sold? Are there any deal-killer items the seller is aware of (foundation, flood, title, zoning, code violations)?
- Is there a deadline driving the sale (1031 exchange, divorce, estate, relocation)? That informs how much negotiation room exists.
- Schools are D-rated, which usually means shorter tenancies and higher turnover. Who's the typical renter profile here, and what's been the actual vacancy rate?
- Crime grade is F in this area — have there been break-ins, vandalism, or insurance claims at this property in the last 3 years? What carrier currently insures it and at what premium?
- What's the average days-on-market for RENTAL listings here right now (not sales)? A rising rental-DOM trend means longer vacancies and softer asking-rent achievability than the comps imply.
- What's the recent tenant-quality profile in this submarket — average credit score on applications, eviction rate, late-payment / NSF rate, and stable-employment percentage? A property-management company in the area should have these aggregated.
- How much new apartment / multifamily construction is in the pipeline within 1–3 miles? Heavy new supply (>2% of stock underway) typically softens rents 12–24 months out; light construction supports rent growth.
Investment metrics
- 1% rule
- 0.96% ✗
- Cap rate
- 7.43%
- Cash-on-cash
- 4.06%
- DSCR
- 1.18
- GRM
- 8.7
CMA / ARV
- ARV (median comp)
- $1,250,168
- List price
- $935,000
- Delta
- -25.21%
- Verdict
- UNDERPRICED
- Comps
- 20 within 1.0 mi
Show comp detail 1 sale within ~0.75 mi
| Address | Dist | Beds/Ba | Sqft | Sold | Price | $/sf | Match |
|---|---|---|---|---|---|---|---|
| 5232 Westhaven St | 0.34mi | 6/6.0 | 3,984 (+7%) | 7mo | $800,000 | $201 | 59 |
Match score weights: distance 35% · size 25% · config 20% · recency 20%. Top-matched comps best support the ARV.
Projected returns pro-forma
-3.0% appreciation · 1.12% rent growth · sell at horizon
- IRR
- -12.0%
- Equity multiple
- 0.57×
- Total profit
- $-111,831
- Equity at exit
- $139,412
- IRR
- -5.8%
- Equity multiple
- 0.65×
- Total profit
- $-90,690
- Equity at exit
- $80,842
Cash invested: $261,800 (down + closing). Projections, not guarantees.
Landlord ↔ Tenant lean methodology
- Overall (CITY)
- 0 Strongly Tenant-Friendly
- State California
- 18 Strongly Tenant-Friendly · D+13
- County
- — inherits STATE
- City Los Angeles
- 0 Strongly Tenant-Friendly · D+22
ZIP-level market 90016
- Rents YoY
- 1.1%
- Active inventory
- 150
- Price-to-rent
- 17.4×
Monthly cashflow live
- Estimated rent
- $8,961 high interval (Pro) →
- Mortgage (P&I)
- −$4,903
- Tax from tax record
- −$902 /mo · $10,820/yr
- Insurance
- −$390
- HOA
- −$0
- Vacancy / Maint / Mgmt
- −$1,882
- Net cashflow
- $885
Break-even live
Sensitivity live
| Price | -10% $1,414 | -5% $1,149 | +0% $885 | +5% $620 | +10% $355 |
|---|---|---|---|---|---|
| Rent | -10% $177 | -5% $531 | +0% $885 | +5% $1,239 | +10% $1,593 |
| Rate | -1.0pp $1,356 | -0.5pp $1,123 | base $885 | +0.5pp $642 | +1.0pp $396 |
2-unit breakdown (identical units grouped — click to expand)
| Units | Beds | Baths | Est. rent |
|---|---|---|---|
| 2× units | 3 | — | $8,960 |
| #1 | 3 | — | $4,480 |
| #2 | 3 | — | $4,480 |
| Total (2 units) | $8,961 | ||
UW: 25.0% down · 7.5% · 30yr · 1.5% tax · 5.0% vac · 8.0% maint · 8.0% mgmt
Financing live
Cash to close
- Down payment
- $233,750
- Closing costs
- $28,050
- Reserves months
- —
- Total cash needed
- —
Loan-product check · same deal, 3 products live
Conventional
25% down · 7.5% · 30yr
- Down + closing
- —
- Monthly P&I
- —
- Monthly cashflow
- —
- DSCR
- —
- Eligible?
- —
Personal DTI + credit; lowest rate.
DSCR
20% down · 8.5% · 30yr
- Down + closing
- —
- Monthly P&I
- —
- Monthly cashflow
- —
- DSCR
- —
- Eligible?
- —
No personal income docs; deal must DSCR.
Hard money
10% down · 12.0% · 12mo
- Down + closing
- —
- Monthly P&I
- —
- Monthly cashflow
- —
- DSCR
- —
- Eligible?
- —
Short-term bridge; refi at stabilization.
Rent comps 5 comps
| Address | Beds | Baths | Sqft | Rent | $/sqft | DOM | Units | Dist |
|---|---|---|---|---|---|---|---|---|
| 1948 S Point View St Los Angeles, CA | 5.0 | 4.5 | 3100 | $16,995 | $5.48 | 45d | 1 | 0.99mi |
| 2125 S West View St Los Angeles, CA | 6.0 | 5.0 | 2546 | $5,500 | $2.16 | 45d | 1 | 1.12mi |
| 1631 S Point View St Los Angeles, CA | 5.0 | 3.5 | 3162 | $9,750 | $3.08 | 4d | 1 | 1.36mi |
| 1907 S Corning St Unit 1 Los Angeles, CA | 5.0 | 5.0 | 2594 | $6,495 | $2.50 | 12d | 1 | 1.37mi |
| 1920 S Sherbourne Dr Unit 1922 Los Angeles, CA | 5.0 | 4.0 | 2518 | $5,995 | $2.38 | 45d | 1 | 1.45mi |
Listing history 36 events
-
2026-06-21days on market $935,000 Active 127 DOM
-
2026-06-18days on market $935,000 Active 124 DOM
-
2026-06-17days on market $935,000 Active 123 DOM
-
2026-06-16days on market $935,000 Active 122 DOM
-
2026-06-15days on market $935,000 Active 121 DOM
-
2026-06-13days on market $935,000 Active 119 DOM
-
2026-06-09days on market $935,000 Active 115 DOM
-
2026-06-08days on market $935,000 Active 114 DOM
-
2026-06-07days on market $935,000 Active 113 DOM
-
2026-06-04days on market $935,000 Active 110 DOM
-
2026-06-03days on market $935,000 Active 109 DOM
-
2026-06-02days on market $935,000 Active 108 DOM
-
2026-06-01days on market $935,000 Active 107 DOM
-
2026-05-31days on market $935,000 Active 106 DOM
-
2026-05-12status Active 523-char remark
Show marketing remark (523 chars)
4Plex West Adams for $935,000! Welcome to 5447 Blackwelder St! The property is located in an excellent West Adams Location with 4 Units. The property provides an excellent Unit Mix offering 1 & 2 Bedroom Layouts. Spacious Units are spacious Averaging Approx. 930 SF Each! Approximately Over 58% Rental Upside! Selected Units Offer En Suite Washer/Dryers. Well Parked! 7 Spaces for 4 Units. Tenants pay for trash. Units are separately Metered for Gas/Electric. The property also offers Brand New Electrical Main Panel!
-
2026-03-02price $995,000 523-char remark
Show marketing remark (523 chars)
4Plex West Adams for $935,000! Welcome to 5447 Blackwelder St! The property is located in an excellent West Adams Location with 4 Units. The property provides an excellent Unit Mix offering 1 & 2 Bedroom Layouts. Spacious Units are spacious Averaging Approx. 930 SF Each! Approximately Over 58% Rental Upside! Selected Units Offer En Suite Washer/Dryers. Well Parked! 7 Spaces for 4 Units. Tenants pay for trash. Units are separately Metered for Gas/Electric. The property also offers Brand New Electrical Main Panel!
-
2026-02-10$1,075,000 Active 523-char remark
Show marketing remark (523 chars)
4Plex West Adams for $935,000! Welcome to 5447 Blackwelder St! The property is located in an excellent West Adams Location with 4 Units. The property provides an excellent Unit Mix offering 1 & 2 Bedroom Layouts. Spacious Units are spacious Averaging Approx. 930 SF Each! Approximately Over 58% Rental Upside! Selected Units Offer En Suite Washer/Dryers. Well Parked! 7 Spaces for 4 Units. Tenants pay for trash. Units are separately Metered for Gas/Electric. The property also offers Brand New Electrical Main Panel!
-
2025-04-24historical $1,870
-
2025-04-19$1,870
-
2025-04-19historical $1,900
-
2025-04-12$1,900
-
2022-05-12price $1,850
-
2017-12-28soldstatus $750,000 Closed 602-char remark
Show marketing remark (602 chars)
Great opportunity to purchase a large triplex in highly sought-after West Adams neighborhood of City of Los Angeles where there are many art galleries, studios, boutiques and a busy commercial corridor. This triplex has two spacious 2-bedroom units and one 2-bedroom plus den unit that will be delivered vacant at closing. Owner/user or investment opportunity in a neighborhood closely watched by investors! Property is located very close to Metro Expo Line on Jefferson. This is a COURT-ORDERED SALE. SUBJECT TO COURT CONFIRMATION AND POTENTIAL OVERBID. AGENTS: PLEASE SEE AGENT REMARKS FOR MORE INFO.
-
2017-12-28soldstatus $750,000
Show marketing remark (602 chars)
Great opportunity to purchase a large triplex in highly sought-after West Adams neighborhood of City of Los Angeles where there are many art galleries, studios, boutiques and a busy commercial corridor. This triplex has two spacious 2-bedroom units and one 2-bedroom plus den unit that will be delivered vacant at closing. Owner/user or investment opportunity in a neighborhood closely watched by investors! Property is located very close to Metro Expo Line on Jefferson. This is a COURT-ORDERED SALE. SUBJECT TO COURT CONFIRMATION AND POTENTIAL OVERBID. AGENTS: PLEASE SEE AGENT REMARKS FOR MORE INFO.
-
2017-11-01status Backup Offers Accepted 602-char remark
Show marketing remark (602 chars)
Great opportunity to purchase a large triplex in highly sought-after West Adams neighborhood of City of Los Angeles where there are many art galleries, studios, boutiques and a busy commercial corridor. This triplex has two spacious 2-bedroom units and one 2-bedroom plus den unit that will be delivered vacant at closing. Owner/user or investment opportunity in a neighborhood closely watched by investors! Property is located very close to Metro Expo Line on Jefferson. This is a COURT-ORDERED SALE. SUBJECT TO COURT CONFIRMATION AND POTENTIAL OVERBID. AGENTS: PLEASE SEE AGENT REMARKS FOR MORE INFO.
-
2017-09-18$825,000 Active 602-char remark
Show marketing remark (602 chars)
Great opportunity to purchase a large triplex in highly sought-after West Adams neighborhood of City of Los Angeles where there are many art galleries, studios, boutiques and a busy commercial corridor. This triplex has two spacious 2-bedroom units and one 2-bedroom plus den unit that will be delivered vacant at closing. Owner/user or investment opportunity in a neighborhood closely watched by investors! Property is located very close to Metro Expo Line on Jefferson. This is a COURT-ORDERED SALE. SUBJECT TO COURT CONFIRMATION AND POTENTIAL OVERBID. AGENTS: PLEASE SEE AGENT REMARKS FOR MORE INFO.
-
2017-09-18$825,000
Show marketing remark (602 chars)
Great opportunity to purchase a large triplex in highly sought-after West Adams neighborhood of City of Los Angeles where there are many art galleries, studios, boutiques and a busy commercial corridor. This triplex has two spacious 2-bedroom units and one 2-bedroom plus den unit that will be delivered vacant at closing. Owner/user or investment opportunity in a neighborhood closely watched by investors! Property is located very close to Metro Expo Line on Jefferson. This is a COURT-ORDERED SALE. SUBJECT TO COURT CONFIRMATION AND POTENTIAL OVERBID. AGENTS: PLEASE SEE AGENT REMARKS FOR MORE INFO.
-
2009-08-07historical
-
2009-07-26Active
-
2009-06-05historical
-
2009-03-10
-
2009-02-19historical
-
2008-12-02
-
2008-11-18historical
-
2008-05-15
ⓘ Source: listings_history table (triggers on properties + properties_extension) + one-shot
backfill from property_details.listing_events for pre-trigger history.
Tax reassessment forecast CA · Resets to sale price
- Current annual tax
- $10,820 · $902/mo
- Projected year-2 tax
- $10,820 · $902/mo
- Expected delta
- $0/yr ($0/mo · 0.0%)
ⓘ Screening estimate from a state-policy table — verify with the county assessor before closing.
Climate risk First Street
- Flood 5/10 Major FEMA zone X (unshaded) · 63% chance over 30 yrs
- Wildfire 1/10 Low
- Heat 6/10 Major 7 d/yr ≥88°F today · 21 d/yr by 30 yrs out
- Wind 1/10 Low
- Air quality 4/10 Moderate 6 unhealthy d/yr today · 7 by 30 yrs out
Nearby sold comps map
Loading sold comps map…
Walkable amenities ~0.75 mi
Loading nearby amenities…
Taxation est. · year 1
- Rental income
- $107,532
- − Mortgage interest
- −$52,375
- − Property taxes
- −$10,820
- − Insurance
- −$4,675
- − Repairs & maintenance
- −$8,603
- − Management
- −$8,603
- − Depreciation
- −$27,200
- Taxable loss
- −$4,743
- Est. tax savings @ 24.0%
- +$1,138
- After-tax cash flow
- $11,755/yr
For passive investors: Depreciation is non-cash, so a rental often shows a tax loss while cash-flowing — sheltering income. Rental losses are passive: they offset passive income freely, and up to $25,000/yr can offset ordinary (W-2) income if you actively participate and your MAGI is under $100k (phasing out to $0 by $150k); unused losses carry forward. On sale, claimed depreciation is recaptured at up to 25%, and gains may owe capital-gains tax (a 1031 exchange can defer both). Figures are a year-1 estimate at your 24.0% rate — not tax advice; consult a CPA.
Schools (NCES district)
- District
- Los Angeles Unified
- NCES district ID
- 0622710
- Math proficiency
- 29% ▼ -4.00%
- Reading proficiency
- 54% ▲ 10.00%
- Median HH income
- $50,403
- Composite
- 35.67/100
- National rank
- #4875
- State rank
- #223 of 517 in CA
Livability — Los Angeles
- Score
- 68/100
- State rank
- #273
- US rank
- #9237
Category grades
Schools grade is shown separately in the Schools card above.
Census & demographics
- Census place
- Los Angeles, CA
- County
- Los Angeles County · 9,444,647 people
- City population
- 3,838,149
- Metro
- Los Angeles-Long Beach-Anaheim, CA
- Population (ZIP)
- 46,457
- Household income
- $73,516
- Rent vs Own
- Severe rent burden
- 3450.0
Population outlook (Los Angeles County) Hauer SSP2
- Today (2025)
- 10,940,515 people
- By 2030
- 11,256,481 · +2.9%
- By 2040
- 11,729,929 · +7.2%
- By 2050
- 11,948,407 · +9.2%
- By 2075
- 11,818,114 · +8.0%
- By 2100
- 10,842,928 · -0.9%
Race, ethnicity, and origin ACS 2023
- Neighborhood character
- Diverse neighborhood (Simpson 0.64)
- Race & ethnicity
- Hispanic / Latino 52% Black 27% Two or more races 18% White 12% Asian 4%
- Hispanic origin (detail)
- Mexican 34%
- Common ancestry
- British 1% Scotch-Irish 1% Romanian 1%
- Foreign-born
- 30% · Canada, South Korea, China
- Languages at home
- 47% English-only · Spanish 47% French/Haitian/Cajun 1% Chinese 1%
Political lean MEDSL · Los Angeles
- 2024 margin
- Solid D (+32.9) · D 64.8% · R 31.9% · Other 3.3%
- 2008→2024 swing
- -7.4pp toward R · 2008: 40.4pp · 2024: 32.9pp
- All cycles
- 2024: D+32.9 2020: D+44.2 2016: D+48.0 2012: D+40.0 2008: D+40.4
Not yet ingested
- Civics
- —
Market trends
- HPI YoY
- ▼ -991.94%
- Current HPI
- 584.0673
- Rent YoY
- ▲ 1.12%
- Metro
- Los Angeles-Long Beach-Anaheim, CA
- State GDP YoY
- ▲ 3.21%
- F500 in state
- 116
Industry mix (Fortune 500 HQ in CA)
| Industry | F500 HQs | Revenue |
|---|---|---|
| Technology | 27 | $1,492B |
|
||
| Financial Services | 3 | $174B |
|
||
| Retail | 3 | $44B |
|
||
| Insurance | 3 | $26B |
|
||
| Media / Entertainment | 2 | $115B |
|
||
| Pharmaceuticals / Biotech | 2 | $62B |
|
||
Price history
+20.6% since first listed22 events — show timeline
- 2026-05-12 Relisted — TheMLS
- 2026-03-02 Price Changed $995,000 TheMLS
- 2026-02-10 Listed $1,075,000 TheMLS
- 2025-04-24 Rental Removed $1,870 RENTALBEAST
- 2025-04-19 Listed for Rent $1,870 RENTALBEAST
- 2025-04-19 Rental Removed $1,900 RENTALBEAST
- 2025-04-12 Listed for Rent $1,900 RENTALBEAST
- 2022-05-12 Price Changed $1,850 RENT.
- 2017-12-28 Sold (Public Records) $750,000 Public Records
- 2017-12-28 Sold (MLS) $750,000 SDMLS
- 2017-12-28 Sold (MLS) $750,000 TheMLS
- 2017-11-01 Pending — TheMLS
- 2017-09-18 Listed $825,000 TheMLS
- 2017-09-18 Listed $825,000 SDMLS
- 2009-08-07 Delisted — TheMLS
- 2009-07-26 Listed — TheMLS
- 2009-06-05 Delisted — TheMLS
- 2009-03-10 Listed — TheMLS
- 2009-02-19 Delisted — TheMLS
- 2008-12-02 Listed — TheMLS
- 2008-11-18 Delisted — TheMLS
- 2008-05-15 Listed — TheMLS
Property tax history
+13.4%/yrLatest (2025): $10,820 · -6.4% YoY. Source: county tax records.
Cash-flow waterfall
monthlySold comps — $/sqft
last 12 mo · ≤1 miLoading sold comps…