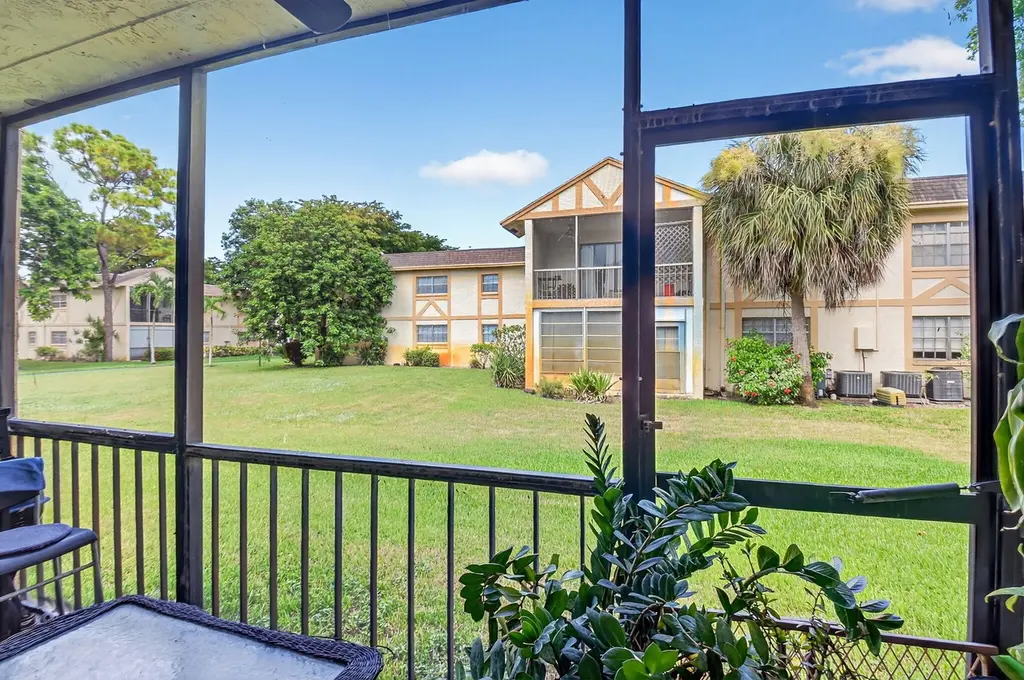
3001 Linton Blvd #105 · Delray Beach, FL
Flood risk 1/10 · Minimal
- FEMA flood zone
- X (unshaded)
- Chance of flooding over 30 yrs
- 0.0%
- Est. flood insurance / yr
- $507 – $1,088
Fire risk 1/10 · Minimal
- Est. fire insurance / yr
- $947 – $1,759
Heat risk 10/10 · Severe
- Hot days now (above 106°F)
- 7 days/yr
- Hot days in 30 yrs
- 27 days/yr
Wind risk 10/10 · Severe
- Chance of severe wind over 30 yrs
- 99.0%
Air-quality risk 3/10 · Minor
- Unhealthy air days now
- 2 days/yr
- Unhealthy air days in 30 yrs
- 3 days/yr
Risk factors via First Street. Map © Google.
Why this score? — see what drove the C- grade
The composite is a weighted blend of 9 inputs, each scored 0–100. Each bar is that input's sub-score; the figure is the points it added to the 100-point composite (weight × sub-score).
- Cash flow +17.8/30.0
- 1% rule +8.2/10.0
- ARV discount +7.5/15.0
- DSCR +5.6/10.0
- Schools +4.3/10.0
- Livability +3.9/5.0
- Rent growth +3.0/5.0
- Condition / age +2.8/5.0
- Appreciation +0.0/10.0
$180,000
🖨 Deal sheet 📄 Offer letter ✓ Due diligence
Listing remarks
First floor, corner unit with lots of illumination, 2 master bedrooms with bathrooms incorporated, walk-in closet, tile floor, and a garden view. The kitchen needs to be updated, make it your own, and design it your way. 5 year-old AC
Key facts
- Walk-in closet
- Garden view
- Corner unit
Tags
Property features AI
Finance
- HOA & community: HOA managed by Lisa Management; Monthly HOA fee ($490) covering cable TV, insurance, grounds maintenance, pest control, sewer, trash, water and common areas; Community amenities include pool, tennis courts, picnic area and library; Pets allowed with restrictions (cats only; pet restrictions possible)
Exterior
- Parking: Two open parking spaces (total 2 parking spaces)
- Utilities: Public water; Public sewer; 220 volt electric; Cable available; Water available; Sewer available
- Home design: Condominium; Single-story (1 story); Multi/split levels; Faces west; Resale condition
- Construction: Concrete / CBS construction; Composition/shingle roof; Built as part of a single-story building
- Exterior features: Screened patio; Patio
Interior
- Kitchen: Disposal; Microwave
- Bedrooms: One main-level bedroom
- Flooring: Ceramic tile
- Bathrooms: Two full bathrooms, one on the main level
- Heating & cooling: Central heating; Central air conditioning
- Interior features: Walk-in closet(s); Unfurnished
Neighborhood map
What this means for you Summary
Snapshot
- This is a 2-bed/2.0-bath condo listed at $180k. Condition is rated average.
Deal economics
- At list price, monthly cash flow is $147 ($2k/yr) — positive.
- The deal already cash-flows at list — no discount required.
- Meets the 1% rule at list price ($2k rent vs $180k).
- Recommended offer: $175k (3.0% below list) — sets the bar for market timing.
- Cap rate 7.3% vs local median 4.3% in Delray Beach — top-decile yield for the area; either an underpriced asset or a hidden risk that comps aren't pricing in. Stress-test before assuming the spread holds.
Location & tenants
- Location reads 77/100 on livability (#202 in FL, #3,160 nationally) — a middle-class / working-renter tenant base. Strengths: housing A+, health & safety A+, commute A-; Watch: cost of living C-, crime D-, amenities F.
- Palm Beach (suburban): math 46% / reading 53% proficiency, ranked #34 of 73 in FL (top 47%) — families likely to look elsewhere, expect single-tenant / working-renter base with shorter leases.
- Zoned schools: Orchard View Elementary School (math 48% / reading 47%, grade D, #1,182 of 2,144 statewide, top 55%, 596 students, 76% FRL); Atlantic High School (math 28% / reading 52%, grade F, #296 of 667 statewide, top 45%, 1,889 students, 59% FRL) — zoned schools average 68% FRL vs 52% district-wide (16 pts higher); higher-poverty schools than district average — tighter screening recommended.
- Market conditions: Rents rising (+1.8%/yr); 354 active listings in the ZIP; 40 comparable units currently listed for rent nearby; rentals at typical pace (median 24d on market — plan ~3-4 weeks tenant-placement turnaround); solid renter incomes; 3,974 units permitted in Palm Beach County in 2024 (1,012 in 5+ unit buildings).
- This rent runs 37% of the median local income ($78k/yr) — at the standard rent-burdened threshold; future hikes will face affordability resistance.
Forward outlook
- Local home prices are declining (-3.0%/yr); year-one equity from $1k of loan paydown is wiped out by about $5k of value loss. Plan a longer hold.
- Palm Beach County population projected at +30% by 2050 — long-run rental-demand tailwind backs the buy-and-hold thesis.
Negotiation context
- It's been on market 47 days — a 3% lower offer ($175k) is reasonable based on typical stale-listing flexibility.
Risks & watch-outs
- Watch-outs: HOA is 21% of rent.
- Climate carrying-cost: severe wind risk, 99% chance of damaging wind over 30y; extreme-heat days projected 7→27/yr by 2055 (HVAC capex compounding) — expect insurance premiums to compound above CPI over the hold.
Questions for the listing agent
- It's been on market 47 days. Have you received any prior offers? Is the seller open to a 3% concession, seller financing, or rate buy-down credit?
- What does the HOA fee cover, when was the last increase, and are there any pending special assessments or reserve-fund shortfalls?
- Any open or pending special assessments — roof, HVAC, plumbing, elevator, façade? What's the per-unit balance and payoff schedule, and is the seller paying it off at close or rolling it to the buyer?
- Is there a deadline driving the sale (1031 exchange, divorce, estate, relocation)? That informs how much negotiation room exists.
- Schools are B-rated — typically a magnet for longer-tenancy family renters. What's the average tenant stay here, and is there a school-zone premium baked into asking?
- Crime grade is D in this area — have there been break-ins, vandalism, or insurance claims at this property in the last 3 years? What carrier currently insures it and at what premium?
- What's the average days-on-market for RENTAL listings here right now (not sales)? A rising rental-DOM trend means longer vacancies and softer asking-rent achievability than the comps imply.
- What's the recent tenant-quality profile in this submarket — average credit score on applications, eviction rate, late-payment / NSF rate, and stable-employment percentage? A property-management company in the area should have these aggregated.
- How much new apartment / multifamily construction is in the pipeline within 1–3 miles? Heavy new supply (>2% of stock underway) typically softens rents 12–24 months out; light construction supports rent growth.
Investment metrics
- 1% rule
- 1.32% ✓
- Cap rate
- 7.27%
- Cash-on-cash
- 3.51%
- DSCR
- 1.16
- GRM
- 6.3
CMA / ARV
No comps found within radius.
Projected returns pro-forma
-3.0% appreciation · 1.83% rent growth · sell at horizon
- IRR
- -12.4%
- Equity multiple
- 0.56×
- Total profit
- $-22,221
- Equity at exit
- $26,839
- IRR
- -5.5%
- Equity multiple
- 0.66×
- Total profit
- $-17,007
- Equity at exit
- $15,563
Cash invested: $50,400 (down + closing). Projections, not guarantees.
Landlord ↔ Tenant lean methodology
- Overall (STATE)
- 87 Strongly Landlord-Friendly
- State Florida
- 87 Strongly Landlord-Friendly · R+3
- County
- — inherits STATE
- City
- — inherits STATE
ZIP-level market 33445
- Rents YoY
- 1.8%
- Active inventory
- 354
- Price-to-rent
- 6.3×
Monthly cashflow live
- Estimated rent
- $2,381 high interval (Pro) →
- Mortgage (P&I)
- −$944
- Tax est. 1.5%
- −$225 /mo · $2,700/yr
- Insurance
- −$75
- HOA
- −$490
- Vacancy / Maint / Mgmt
- −$500
- Net cashflow
- $147
Break-even live
UW: 25.0% down · 7.5% · 30yr · 1.5% tax · 5.0% vac · 8.0% maint · 8.0% mgmt
Financing live
Cash to close
- Down payment
- $45,000
- Closing costs
- $5,400
- Reserves months
- —
- Total cash needed
- —
Loan-product check · same deal, 3 products live
Conventional
25% down · 7.5% · 30yr
- Down + closing
- —
- Monthly P&I
- —
- Monthly cashflow
- —
- DSCR
- —
- Eligible?
- —
Personal DTI + credit; lowest rate.
DSCR
20% down · 8.5% · 30yr
- Down + closing
- —
- Monthly P&I
- —
- Monthly cashflow
- —
- DSCR
- —
- Eligible?
- —
No personal income docs; deal must DSCR.
Hard money
10% down · 12.0% · 12mo
- Down + closing
- —
- Monthly P&I
- —
- Monthly cashflow
- —
- DSCR
- —
- Eligible?
- —
Short-term bridge; refi at stabilization.
Rent comps 40 comps
| Address | Beds | Baths | Sqft | Rent | $/sqft | DOM | Units | Dist |
|---|---|---|---|---|---|---|---|---|
| 3001 San Clara Dr Unit 4A Delray Beach, FL | 2.0 | 2.5 | 1500 | $2,250 | $1.50 | 15d | 1 | 0.09mi |
| 3118 Spanish Wells Dr Unit 15B Delray Beach, FL | 2.0 | 2.5 | 1230 | $2,650 | $2.15 | 24d | 1 | 0.14mi |
| 1825 Palm Cove Blvd Unit 7-105 Delray Beach, FL | 2.0 | 2.0 | 946 | $2,200 | $2.33 | 15d | 1 | 0.18mi |
| 3301 Spanish Wells Dr Unit D Delray Beach, FL | 2.0 | 2.5 | 1400 | $2,400 | $1.71 | 24d | 1 | 0.18mi |
| 1740 Palm Cove Blvd Apt 103 Delray Beach, FL | 3.0 | 2.0 | 1065 | $2,900 | $2.72 | 24d | 1 | 0.19mi |
| 1760 Palm Cove Blvd Unit 5-203 Delray Beach, FL | 2.0 | 2.0 | 992 | $2,200 | $2.22 | 24d | 1 | 0.19mi |
| 1760 Palm Cove Blvd Unit 5-203 Delray Beach, FL | 2.0 | 2.0 | 993 | $2,200 | $2.22 | 14d | 1 | 0.19mi |
| 1845 Palm Cove Blvd Unit 8-103 Delray Beach, FL | 3.0 | 2.0 | 1065 | $2,500 | $2.35 | 18d | 1 | 0.20mi |
| 3216 Spanish Wells Dr Unit 26D Delray Beach, FL | 2.0 | 2.5 | 1232 | $2,400 | $1.95 | 24d | 1 | 0.21mi |
| 1705 Palm Cove Blvd Apt 302 Delray Beach, FL | 1.0 | 1.0 | 934 | $2,000 | $2.14 | 24d | 1 | 0.23mi |
| 2730 SW 13th St #203 Delray Beach, FL | 2.0 | 2.0 | 1084 | $2,200 | $2.03 | 24d | 1 | 0.25mi |
| 1725 Palm Cove Blvd Unit 2-306 Delray Beach, FL | 1.0 | 1.0 | 934 | $2,100 | $2.25 | 20d | 1 | 0.26mi |
| 2835 SW 13th St #201 Delray Beach, FL | 2.0 | 2.0 | 1144 | $1,975 | $1.73 | 18d | 1 | 0.26mi |
| 1885 Palm Cove Blvd Unit 10-203 Delray Beach, FL | 2.0 | 2.0 | 992 | $2,300 | $2.32 | 4d | 1 | 0.27mi |
| 1850 Homewood Blvd #2070 Delray Beach, FL | 2.0 | 2.0 | 1090 | $2,550 | $2.34 | 24d | 1 | 0.29mi |
| 2070 Homewood Blvd #3150 Delray Beach, FL | 2.0 | 2.0 | 1090 | $2,350 | $2.16 | 15d | 1 | 0.30mi |
| 2070 Homewood Blvd #214 Delray Beach, FL | 2.0 | 2.0 | 1155 | $2,350 | $2.03 | 24d | 1 | 0.31mi |
| 2715 Ponce de Leon Blvd Delray Beach, FL | 2.0 | 1.0 | 1000 | $2,200 | $2.20 | 24d | 1 | 0.35mi |
| 1141 Calamondin Ter #203 Delray Beach, FL | 2.0 | 2.0 | 1167 | $1,700 | $1.46 | 24d | 1 | 0.36mi |
| 1121 Cactus Ter #202 Delray Beach, FL | 2.0 | 2.0 | 1167 | $2,100 | $1.80 | 24d | 1 | 0.37mi |
| 2731 Knight Ln Delray Beach, FL | 2.0 | 2.0 | 1050 | $2,650 | $2.52 | 24d | 1 | 0.38mi |
| 2520 Black Olive Blvd #203 Delray Beach, FL | 2.0 | 2.0 | 1167 | $1,799 | $1.54 | 4d | 1 | 0.39mi |
| 2520 Black Olive Blvd #203 Delray Beach, FL | 2.0 | 2.0 | 1167 | $1,799 | $1.54 | 24d | 1 | 0.39mi |
| 1101 Cactus Ter #203 Delray Beach, FL | 2.0 | 2.0 | 1167 | $2,100 | $1.80 | 17d | 1 | 0.39mi |
| 1130 Cactus Ter Unit 45C Delray Beach, FL | 2.0 | 1.5 | 982 | $2,000 | $2.04 | 24d | 1 | 0.42mi |
| 2756 Carnation Ct Delray Beach, FL | 2.0 | 2.0 | 1407 | $3,200 | $2.27 | 19d | 1 | 0.43mi |
| 1120 Homewood Blvd Unit G204 Delray Beach, FL | 2.0 | 2.0 | 1247 | $2,550 | $2.04 | 19d | 1 | 0.44mi |
| 2736 Carnation Ct Delray Beach, FL | 3.0 | 2.0 | 1496 | $3,400 | $2.27 | 22d | 1 | 0.45mi |
| 2736 Carnation Ct Delray Beach, FL | 3.0 | 2.0 | 1496 | $3,400 | $2.27 | 5d | 1 | 0.45mi |
| 2450 Black Olive Blvd Unit A Delray Beach, FL | 2.0 | 2.0 | 1167 | $1,950 | $1.67 | 24d | 1 | 0.46mi |
| 2450 Black Olive Blvd Unit A Delray Beach, FL | 2.0 | 2.0 | 1167 | $1,950 | $1.67 | 15d | 1 | 0.46mi |
| 1060 Homewood Blvd Unit J102 Delray Beach, FL | 2.0 | 2.0 | 1247 | $2,450 | $1.96 | 20d | 1 | 0.48mi |
| 2733 Zorno Way Delray Beach, FL | 2.0 | 2.0 | 1245 | $2,950 | $2.37 | 19d | 1 | 0.48mi |
| 1021 Flame Vine Ave Delray Beach, FL | 2.0 | 2.0 | 1167 | $1,750 | $1.50 | 24d | 1 | 0.49mi |
| 1100 Boxwood Dr #101 Delray Beach, FL | 2.0 | 2.0 | 1167 | $1,800 | $1.54 | 15d | 1 | 0.51mi |
| 2520 Pansy Ln Unit D Delray Beach, FL | 2.0 | 2.0 | 1167 | $2,150 | $1.84 | 24d | 1 | 0.51mi |
| 2480 Juniper Dr #204 Delray Beach, FL | 2.0 | 2.0 | 1167 | $1,750 | $1.50 | 24d | 1 | 0.52mi |
| 2480 Juniper Dr #203 Delray Beach, FL | 2.0 | 2.0 | 1167 | $1,900 | $1.63 | 24d | 1 | 0.52mi |
| 1001 Flame Vine Ave #202 Delray Beach, FL | 2.0 | 2.0 | 1167 | $2,800 | $2.40 | 24d | 1 | 0.52mi |
| 2521 Pansey Ln Unit 7A Delray Beach, FL | 2.0 | 2.0 | 1167 | $2,100 | $1.80 | 24d | 1 | 0.53mi |
HOA detail condo
- Monthly dues
- $490 · $5,880/yr
- Assessments
- None detected in remarks — confirm with the listing agent.
Listing history 14 events
-
2026-06-18days on market $180,000 Active 47 DOM
-
2026-06-17days on market $180,000 Active 46 DOM
-
2026-06-16days on market $180,000 Active 45 DOM
-
2026-06-15days on market $180,000 Active 44 DOM
-
2026-06-13days on market $180,000 Active 42 DOM
-
2026-06-09days on market $180,000 Active 38 DOM
-
2026-06-08days on market $180,000 Active 37 DOM
-
2026-06-07days on market $180,000 Active 36 DOM
-
2026-06-04days on market $180,000 Active 33 DOM
-
2026-06-03days on market $180,000 Active 32 DOM
-
2026-06-02days on market $180,000 Active 31 DOM
-
2026-06-01days on market $180,000 Active 30 DOM
-
2026-05-31days on market $180,000 Active 29 DOM
-
2026-05-01$180,000 Active
ⓘ Source: listings_history table (triggers on properties + properties_extension) + one-shot
backfill from property_details.listing_events for pre-trigger history.
Climate risk First Street
- Flood 1/10 Low FEMA zone X (unshaded) · 0% chance over 30 yrs
- Wildfire 1/10 Low
- Heat 10/10 Extreme 7 d/yr ≥106°F today · 27 d/yr by 30 yrs out
- Wind 10/10 Extreme 99% chance of damaging wind over 30 yrs
- Air quality 3/10 Moderate 2 unhealthy d/yr today · 3 by 30 yrs out
Nearby sold comps map
Loading sold comps map…
Walkable amenities ~0.75 mi
Loading nearby amenities…
Taxation est. · year 1
- Rental income
- $28,576
- − Mortgage interest
- −$10,083
- − Property taxes
- −$2,700
- − Insurance
- −$900
- − Repairs & maintenance
- −$2,286
- − Management
- −$2,286
- − HOA
- −$5,880
- − Depreciation
- −$5,236
- Taxable loss
- −$796
- Est. tax savings @ 24.0%
- +$191
- After-tax cash flow
- $1,958/yr
For passive investors: Depreciation is non-cash, so a rental often shows a tax loss while cash-flowing — sheltering income. Rental losses are passive: they offset passive income freely, and up to $25,000/yr can offset ordinary (W-2) income if you actively participate and your MAGI is under $100k (phasing out to $0 by $150k); unused losses carry forward. On sale, claimed depreciation is recaptured at up to 25%, and gains may owe capital-gains tax (a 1031 exchange can defer both). Figures are a year-1 estimate at your 24.0% rate — not tax advice; consult a CPA.
Condition & rehab AI · 12 photos
This townhouse requires moderate renovations to update the kitchen and paint interior walls, which will significantly increase its resale and rental value.
Repairs flagged
- Moderate kitchen cabinets — dated and need updating
- Moderate kitchen appliances — outdated and need replacement
- Minor HVAC system — 5-year-old AC
Value-add opportunities
- Both update kitchen cabinets and appliances — modernizing kitchen will appeal to buyers and renters
- Both paint interior walls — fresh paint enhances curb appeal and interior aesthetics
- Both prune vegetation — improves curb appeal and reduces maintenance costs
Renovation cost estimate screening
| Repair item | Severity | Est. cost |
|---|---|---|
| kitchen cabinets · dated and need updating | Moderate | $3,000–15,000 |
| kitchen appliances · outdated and need replacement | Moderate | $3,000–15,000 |
| HVAC system · 5-year-old AC | Minor | $500–3,000 |
| Total estimated repair cost · 3 items | $6,500–33,000 |
Value-add ROI direction
- Both update kitchen cabinets and appliances — modernizing kitchen will appeal to buyers and renters ↑
- Both paint interior walls — fresh paint enhances curb appeal and interior aesthetics ↑
- Both prune vegetation — improves curb appeal and reduces maintenance costs ↑
ⓘ Cost ranges are severity-bucket heuristics (US national rule-of-thumb). Get contractor quotes + a written scope before underwriting a rehab budget.
Schools (NCES district)
- District
- Palm Beach
- NCES district ID
- 1201500
- Math proficiency
- 46% ▼ -16.00%
- Reading proficiency
- 53% ▼ -4.00%
- Median HH income
- $53,943
- Composite
- 42.72/100
- National rank
- #3160
- State rank
- #34 of 73 in FL
Livability — Delray Beach
- Score
- 77/100
- State rank
- #202
- US rank
- #3160
Category grades
Schools grade is shown separately in the Schools card above.
Census & demographics
- Census place
- Delray Beach, FL
- County
- Palm Beach County · 1,438,312 people
- City population
- 123,167
- Metro
- Miami-Fort Lauderdale-Pompano Beach, FL
- Population (ZIP)
- 33,122
- Household income
- $78,163
- Rent vs Own
- Severe rent burden
- 1649.0
Population outlook (Palm Beach County) Hauer SSP2
- Today (2025)
- 1,637,487 people
- By 2030
- 1,743,255 · +6.5%
- By 2040
- 1,948,712 · +19.0%
- By 2050
- 2,132,979 · +30.3%
- By 2075
- 2,530,027 · +54.5%
- By 2100
- 2,706,979 · +65.3%
Race, ethnicity, and origin ACS 2023
- Neighborhood character
- Diverse neighborhood (Simpson 0.62)
- Race & ethnicity
- White 55% Black 24% Hispanic / Latino 11% Two or more races 11% Asian 4%
- Hispanic origin (detail)
- Puerto Rican 3% Cuban 2%
- Common ancestry
- Hispanic 14% Romanian 3% Scotch-Irish 3%
- Foreign-born
- 27% · Canada, Jamaica, Dominican Republic
- Languages at home
- 66% English-only · French/Haitian/Cajun 18% Spanish 9% Other Indo-European 4%
Political lean MEDSL · Palm Beach
- 2024 margin
- Toss-up / Even · D 50.0% · R 49.2%
- 2008→2024 swing
- -22.1pp toward R · 2008: 22.9pp · 2024: 0.8pp
- All cycles
- 2024: D+0.8 2020: D+12.8 2016: D+15.3 2012: D+17.0 2008: D+22.9
Not yet ingested
- Civics
- —
Market trends
- HPI YoY
- ▼ -258.16%
- Current HPI
- 349.5505
- Rent YoY
- ▲ 1.83%
- Metro
- Miami-Fort Lauderdale-Pompano Beach, FL
- State GDP YoY
- ▲ 3.28%
- F500 in state
- 36
Industry mix (Fortune 500 HQ in FL)
| Industry | F500 HQs | Revenue |
|---|---|---|
| Industrial Technology | 2 | $29B |
|
||
| Insurance | 2 | $17B |
|
||
| Retail | 1 | $60B |
|
||
| Technology Distribution | 1 | $58B |
|
||
| Homebuilding | 1 | $35B |
|
||
| Technology Manufacturing | 1 | $35B |
|
||
Price history
1 event — show timeline
- 2026-05-01 Listed $180,000 Beaches MLS
Cash-flow waterfall
monthlySold comps — $/sqft
last 12 mo · ≤1 miLoading sold comps…