86 Stern St · Freeport, FL
Flood risk 1/10 · Minimal
- FEMA flood zone
- X (unshaded)
- Chance of flooding over 30 yrs
- 0.0%
- Est. flood insurance / yr
- $507 – $1,088
Fire risk 5/10 · Moderate
- Est. fire insurance / yr
- $947 – $1,759
Heat risk 10/10 · Severe
- Hot days now (above 104°F)
- 7 days/yr
- Hot days in 30 yrs
- 20 days/yr
Wind risk 9/10 · Severe
- Chance of severe wind over 30 yrs
- 99.0%
Air-quality risk 1/10 · Minimal
- Unhealthy air days now
- 0 days/yr
- Unhealthy air days in 30 yrs
- 0 days/yr
Risk factors via First Street. Map © Google.
Why this score? — see what drove the F grade
The composite is a weighted blend of 9 inputs, each scored 0–100. Each bar is that input's sub-score; the figure is the points it added to the 100-point composite (weight × sub-score).
- Cash flow +11.2/30.0
- Schools +5.2/10.0
- ARV discount +4.1/15.0
- 1% rule +3.8/10.0
- Livability +3.4/5.0
- DSCR +3.3/10.0
- Rent growth +2.9/5.0
- Condition / age +1.0/5.0
- Appreciation +0.0/10.0
$252,400
🖨 Deal sheet (PDF) 📄 Offer letter ✓ Due diligence
Listing remarks
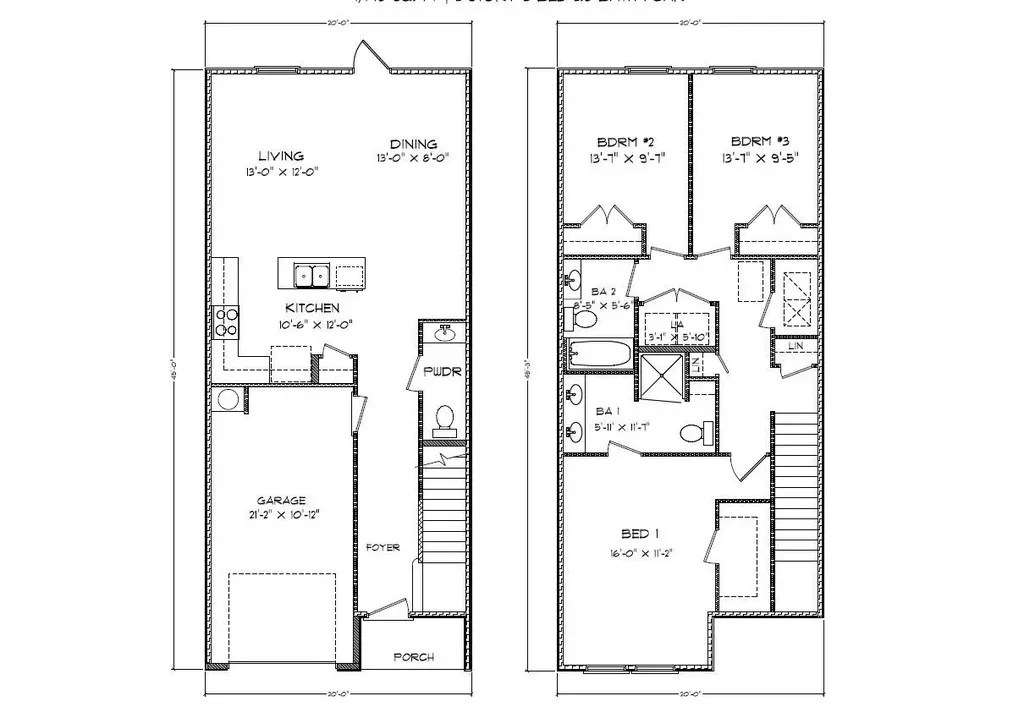
This is an interior unit that is located in a four unit building. As you enter this townhome you will find a hall with EVP flooring that leads to an open-concept kitchen, living, and dining area, designed for entertaining and everyday living. From the dining area you will have access to the back patio and there is window that will illuminate the living area with natural light. The kitchen serves as the culinary center with its spacious center island and cabinetry for storage as well as a pantry. The kitchen has been appointed with stainless appliances including a stove, microwave and dishwasher and quartz countertops
Key facts
- Quartz countertops
- Open-concept kitchen
- Stainless appliances
Tags
Property features AI
Finance
- Other: Address: 86 Stern St, Freeport, FL 32439; Listing last modified June 9, 2026
- Financial info: List price $252,400
Exterior
- Parking: 1-car garage (1 parking space total)
- Home design: Single-family property; Active listing
- Exterior features: Living area approximately 1,459 (living area provided)
Interior
- Bedrooms: 3 bedrooms
- Bathrooms: 2 full bathrooms and 1 half bathroom (2.5 total)
- Interior features: Spec home, Palm Interior plan
Neighborhood map
What this means for you Summary
Snapshot
- This is a 3-bed/2.5-bath townhouse listed at $252k. Condition is rated poor.
Deal economics
- At list price, monthly cash flow is $-96 ($-1k/yr) — negative.
- To cash-flow at today's rent, offer at most $239k (5.5% below list).
- To meet the 1% rule (rent ≥ 1% of price), the offer needs to be $222k (12.0% below list).
- Recommended offer: $222k (12.0% below list) — sets the bar for 1% rule.
- Cap rate 5.8% vs local median 3.0% in Freeport — top-decile yield for the area; either an underpriced asset or a hidden risk that comps aren't pricing in. Stress-test before assuming the spread holds.
Location & tenants
- Location reads 68/100 on livability (#520 in FL) — a middle-class / working-renter tenant base. Strengths: crime A+, housing A+, employment B+; Watch: health & safety C-, amenities F, commute F.
- Walton (rural): math 62% / reading 61% proficiency, ranked #10 of 73 in FL (top 14%) — acceptable for families but not a draw, mixed tenant base, ~2y average lease.
- Zoned schools: Freeport Elementary School (math 50% / reading 57%, grade C, #949 of 2,144 statewide, top 45%, 1,123 students, 55% FRL); Emerald Coast Middle School (math 70% / reading 65%, grade A-, #77 of 571 statewide, top 14%, 868 students, 24% FRL); South Walton High School (math 61% / reading 73%, grade B, #69 of 667 statewide, top 11%, 1,235 students, 20% FRL) — zoned schools average 33% FRL vs 48% district-wide (15 pts lower); this property's tenant base skews higher-income than the district average.
- Market conditions: Rents rising (+1.4%/yr); 1020 active listings in the ZIP; 22 comparable units currently listed for rent nearby; rentals at typical pace (median 23d on market — plan ~3-4 weeks tenant-placement turnaround); solid renter incomes; 2,883 units permitted in Walton County in 2024 (1,322 in 5+ unit buildings).
- This rent runs 32% of the median local income ($83k/yr) — at the standard rent-burdened threshold; future hikes will face affordability resistance.
Forward outlook
- Local home prices are declining (-3.0%/yr); year-one equity from $2k of loan paydown is wiped out by about $8k of value loss. Plan a longer hold.
- Walton County population projected at +46% by 2050 — long-run rental-demand tailwind backs the buy-and-hold thesis.
Negotiation context
- Only 11 days on market — expect competitive offers; lowballing is unlikely to land.
Risks & watch-outs
- Climate carrying-cost: severe wind risk, 99% chance of damaging wind over 30y; moderate wildfire risk; extreme-heat days projected 7→20/yr by 2055 (HVAC capex compounding) — expect insurance premiums to compound above CPI over the hold.
Questions for the listing agent
- What do current leases actually rent for vs. the listed asking? Can we see a recent rent roll and the last 12 months of T-12 income?
- Have any recent inspections been done? Can we get a copy of the seller's disclosures and any deferred-maintenance estimates?
- What does the HOA fee cover, when was the last increase, and are there any pending special assessments or reserve-fund shortfalls?
- Is there a deadline driving the sale (1031 exchange, divorce, estate, relocation)? That informs how much negotiation room exists.
- The area grade is low — what's the realistic commute time and amenity access for the typical tenant pool here? Any planned neighborhood developments (good or bad) we should know about?
- What's the average days-on-market for RENTAL listings here right now (not sales)? A rising rental-DOM trend means longer vacancies and softer asking-rent achievability than the comps imply.
- What's the recent tenant-quality profile in this submarket — average credit score on applications, eviction rate, late-payment / NSF rate, and stable-employment percentage? A property-management company in the area should have these aggregated.
- How much new for-sale + rental construction is in the pipeline within 1–3 miles? Heavy new supply typically softens prices + rents 12–24 months out; constrained supply supports both.
Investment metrics
- 1% rule
- 0.88% ✗
- Cap rate
- 5.84%
- Cash-on-cash
- -1.63%
- DSCR
- 0.93
- GRM
- 9.5
CMA / ARV
- ARV (on-the-fly)
- $234,899
- Comps found
- 10
Show comp detail 10 sales within ~0.75 mi
| Address | Dist | Beds/Ba | Sqft | Sold | Price | $/sf | Match |
|---|---|---|---|---|---|---|---|
| 25 S Main Deck Dr | 0.09mi | 3/2.5 | 1,459 (0%) | 1mo | $232,000 | $159 | 96 |
| 18 Rudder Ln | 0.04mi | 3/2.5 | 1,459 (0%) | 5mo | $243,250 | $167 | 94 |
| 13 S Main Deck Dr | 0.09mi | 3/2.5 | 1,470 (+1%) | 0mo | $240,777 | $164 | 94 |
| 51 S Main Deck Dr | 0.08mi | 3/2.5 | 1,459 (0%) | 3mo | $229,900 | $158 | 94 |
| 57 S Main Deck Dr | 0.08mi | 3/2.5 | 1,459 (0%) | 3mo | $233,750 | $160 | 94 |
| 45 S Main Deck Dr | 0.08mi | 3/2.5 | 1,459 (0%) | 3mo | $222,050 | $152 | 94 |
| 14 Rudder Ln | 0.04mi | 3/2.5 | 1,459 (0%) | 6mo | $234,900 | $161 | 93 |
| 41 S Main Deck Dr | 0.08mi | 3/2.5 | 1,470 (+1%) | 3mo | $236,900 | $161 | 93 |
| 22 Rudder Ln | 0.04mi | 3/2.5 | 1,470 (+1%) | 6mo | $279,900 | $190 | 92 |
| 61 S Main Deck Dr | 0.12mi | 3/2.5 | 1,470 (+1%) | 3mo | $239,900 | $163 | 91 |
Match score weights: distance 35% · size 25% · config 20% · recency 20%. Top-matched comps best support the ARV.
Projected returns pro-forma
-3.0% appreciation · 1.4% rent growth · sell at horizon
- IRR
- -20.9%
- Equity multiple
- 0.29×
- Total profit
- $-50,428
- Equity at exit
- $37,634
- IRR
- -18.5%
- Equity multiple
- 0.08×
- Total profit
- $-65,363
- Equity at exit
- $21,823
Cash invested: $70,672 (down + closing). Projections, not guarantees.
Landlord ↔ Tenant lean methodology
- Overall (STATE)
- 87 Strongly Landlord-Friendly
- State Florida
- 87 Strongly Landlord-Friendly · R+3
- County
- — inherits STATE
- City
- — inherits STATE
ZIP-level market 32439
- Home prices YoY
- -4.2%
- Rents YoY
- 1.4%
- Active inventory
- 1020
- Price-to-rent
- 9.5×
Monthly cashflow live
- Estimated rent
- $2,222 high interval (Pro) →
- Mortgage (P&I)
- −$1,324
- Tax est. 1.5%
- −$316 /mo · $3,786/yr
- Insurance
- −$105
- HOA
- −$107
- Vacancy / Maint / Mgmt
- −$467
- Net cashflow
- $-96
Break-even live
Sensitivity live
| Price | -10% $79 | -5% $-9 | +0% $-96 | +5% $-183 | +10% $-270 |
|---|---|---|---|---|---|
| Rent | -10% $-271 | -5% $-184 | +0% $-96 | +5% $-8 | +10% $80 |
| Rate | -1.0pp $31 | -0.5pp $-32 | base $-96 | +0.5pp $-161 | +1.0pp $-228 |
UW: 25.0% down · 7.5% · 30yr · 1.5% tax · 5.0% vac · 8.0% maint · 8.0% mgmt
Financing live
Cash to close
- Down payment
- $63,100
- Closing costs
- $7,572
- Reserves months
- —
- Total cash needed
- —
Loan-product check · same deal, 3 products live
Conventional
25% down · 7.5% · 30yr
- Down + closing
- —
- Monthly P&I
- —
- Monthly cashflow
- —
- DSCR
- —
- Eligible?
- —
Personal DTI + credit; lowest rate.
DSCR
20% down · 8.5% · 30yr
- Down + closing
- —
- Monthly P&I
- —
- Monthly cashflow
- —
- DSCR
- —
- Eligible?
- —
No personal income docs; deal must DSCR.
Hard money
10% down · 12.0% · 12mo
- Down + closing
- —
- Monthly P&I
- —
- Monthly cashflow
- —
- DSCR
- —
- Eligible?
- —
Short-term bridge; refi at stabilization.
Rent comps 22 comps
| Address | Beds | Baths | Sqft | Rent | $/sqft | DOM | Units | Dist |
|---|---|---|---|---|---|---|---|---|
| 51 S Main Deck Dr Freeport, FL | 3.0 | 2.5 | 1500 | $2,095 | $1.40 | 23d | 1 | 0.08mi |
| 47 S Main Deck Dr Unit 1 Freeport, FL | 3.0 | 2.5 | 1459 | $2,000 | $1.37 | 23d | 1 | 0.08mi |
| 41 S Main Deck Dr Unit 1 Freeport, FL | 3.0 | 2.5 | 1500 | $2,195 | $1.46 | 23d | 1 | 0.08mi |
| 103 Bradford Ct Freeport, FL | 3.0 | 2.0 | 1713 | $2,095 | $1.22 | 15d | 1 | 0.31mi |
| 160 Bradford Ct Freeport, FL | 3.0 | 2.0 | 1223 | $2,495 | $2.04 | 23d | 1 | 0.36mi |
| 170 Bradford Ct Freeport, FL | 3.0 | 2.0 | 1253 | $2,300 | $1.84 | 23d | 1 | 0.36mi |
| 2 Polk St Freeport, FL | 3.0 | 2.0 | 1155 | $1,550 | $1.34 | 23d | 1 | 0.67mi |
| 266 Emr AVE Freeport, FL | 1.0–2.0 | 1.0–2.0 | 909 | $985 | $1.08 | 15d | 5 | 0.72mi |
| 3495 Sanctuary WAY Melbourne, FL | 1.0–3.0 | 1.0–2.0 | 1002 | $2,412 | $2.41 | 15d | 38 | 0.77mi |
| 15 Oakfield Dr Freeport, FL | 3.0 | 2.0 | 1531 | $2,350 | $1.53 | 15d | 1 | 1.01mi |
| 70 Jakes Way Freeport, FL | 3.0 | 2.0 | 1500 | $2,100 | $1.40 | 23d | 1 | 1.11mi |
| 255 N Jackson St Freeport, FL | 3.0 | 2.0 | 1456 | $2,100 | $1.44 | 23d | 1 | 1.15mi |
| 156 Date Palm Ln Freeport, FL | 3.0 | 2.5 | 1432 | $2,300 | $1.61 | 23d | 1 | 1.20mi |
| 151 Date Palm Ln Freeport, FL | 3.0 | 2.5 | 1484 | $1,775 | $1.20 | 15d | 1 | 1.21mi |
| 532 Marquis Way Freeport, FL | 3.0 | 2.0 | 1807 | $2,950 | $1.63 | 23d | 1 | 1.22mi |
| 15284 U.S. 331 Business Freeport, FL | 2.0 | 3.0 | 1106 | $1,400 | $1.27 | 23d | 1 | 1.23mi |
| 259 N Sand Palm Rd Freeport, FL | 3.0 | 2.5 | 1336 | $1,600 | $1.20 | 23d | 1 | 1.29mi |
| 246 N Sand Palm Rd Freeport, FL | 3.0 | 2.5 | 1471 | $1,650 | $1.12 | 23d | 1 | 1.31mi |
| 147 N Sand Palm Rd Freeport, FL | 3.0 | 2.5 | 1471 | $1,595 | $1.08 | 23d | 1 | 1.34mi |
| 201 Marsh Lndg S Freeport, FL | 3.0 | 2.0 | 1757 | $2,450 | $1.39 | 23d | 1 | 1.38mi |
| 76 N Sand Palm Rd Freeport, FL | 2.0 | 3.0 | 1128 | $1,450 | $1.29 | 23d | 1 | 1.42mi |
| 130 Speckled Trout Ln N Freeport, FL | 3.0 | 2.0 | 1500 | $2,350 | $1.57 | 23d | 1 | 1.43mi |
HOA detail
- Monthly dues
- $107 · $1,284/yr
Listing history 10 events
-
2026-06-21days on market $252,400 Active 11 DOM
-
2026-06-18days on market $252,400 Active 8 DOM
-
2026-06-17days on market $252,400 Active 7 DOM
-
2026-06-16days on market $252,400 Active 6 DOM
-
2026-06-15days on market $252,400 Active 5 DOM
-
2026-06-14days on market $252,400 Active 3 DOM
-
2026-06-13remarks 624-char remark
-
2026-06-13days on market $252,400 Active 2 DOM
-
2026-06-09remarks 441-char remark
-
2026-06-09$252,400 Active 1 DOM
ⓘ Source: listings_history table (triggers on properties + properties_extension) + one-shot
backfill from property_details.listing_events for pre-trigger history.
Climate risk First Street
- Flood 1/10 Low FEMA zone X (unshaded) · 0% chance over 30 yrs
- Wildfire 5/10 Major
- Heat 10/10 Extreme 7 d/yr ≥104°F today · 20 d/yr by 30 yrs out
- Wind 9/10 Extreme 99% chance of damaging wind over 30 yrs
- Air quality 1/10 Low 0 unhealthy d/yr today · 0 by 30 yrs out
Nearby sold comps map
Loading sold comps map…
Walkable amenities ~0.75 mi
Loading nearby amenities…
Taxation est. · year 1
- Rental income
- $26,664
- − Mortgage interest
- −$14,138
- − Property taxes
- −$3,786
- − Insurance
- −$1,262
- − Repairs & maintenance
- −$2,133
- − Management
- −$2,133
- − HOA
- −$1,284
- − Depreciation
- −$7,343
- Taxable loss
- −$5,415
- Est. tax savings @ 24.0%
- +$1,300
- After-tax cash flow
- $149/yr
For passive investors: Depreciation is non-cash, so a rental often shows a tax loss while cash-flowing — sheltering income. Rental losses are passive: they offset passive income freely, and up to $25,000/yr can offset ordinary (W-2) income if you actively participate and your MAGI is under $100k (phasing out to $0 by $150k); unused losses carry forward. On sale, claimed depreciation is recaptured at up to 25%, and gains may owe capital-gains tax (a 1031 exchange can defer both). Figures are a year-1 estimate at your 24.0% rate — not tax advice; consult a CPA.
Condition & rehab AI · 1 photo
This pre-construction townhouse requires extensive renovations and repairs to bring it up to current standards and increase its value for resale and rental.
Repairs flagged
- Major Kitchen cabinets — No photos provided.
- Major Bathroom fixtures — No photos provided.
- Major Roof — No photos provided.
- Major Exterior siding — No photos provided.
- Major Flooring — No photos provided.
- Major Interior walls/paint — No photos provided.
- Major Windows — No photos provided.
- Major Foundation/structure — No photos provided.
- Major HVAC/mechanicals — No photos provided.
- Major Landscaping/curb appeal — No photos provided.
Value-add opportunities
- Both Kitchen renovation — Modern kitchen design can significantly increase both resale and rental value.
- Both Bathroom updates — Upgraded bathrooms are a major selling point for both buyers and renters.
- Both Exterior paint and landscaping — A fresh coat of paint and well-maintained landscaping can enhance curb appeal and property value.
- Both HVAC system replacement — A new HVAC system ensures comfort and energy efficiency, attracting more buyers and renters.
- Both Structural repairs — Addressing structural issues ensures the property is safe and structurally sound, which is crucial for both resale and rental markets.
Renovation cost estimate screening
| Repair item | Severity | Est. cost |
|---|---|---|
| Kitchen cabinets · No photos provided. | Major | $15,000–50,000 |
| Bathroom fixtures · No photos provided. | Major | $15,000–50,000 |
| Roof · No photos provided. | Major | $15,000–50,000 |
| Exterior siding · No photos provided. | Major | $15,000–50,000 |
| Flooring · No photos provided. | Major | $15,000–50,000 |
| Interior walls/paint · No photos provided. | Major | $15,000–50,000 |
| Windows · No photos provided. | Major | $15,000–50,000 |
| Foundation/structure · No photos provided. | Major | $15,000–50,000 |
| HVAC/mechanicals · No photos provided. | Major | $15,000–50,000 |
| Landscaping/curb appeal · No photos provided. | Major | $15,000–50,000 |
| Total estimated repair cost · 10 items | $150,000–500,000 |
Value-add ROI direction
- Both Kitchen renovation — Modern kitchen design can significantly increase both resale and rental value. ↑
- Both Bathroom updates — Upgraded bathrooms are a major selling point for both buyers and renters. ↑
- Both Exterior paint and landscaping — A fresh coat of paint and well-maintained landscaping can enhance curb appeal and property value. ↑
- Both HVAC system replacement — A new HVAC system ensures comfort and energy efficiency, attracting more buyers and renters. ↑
- Both Structural repairs — Addressing structural issues ensures the property is safe and structurally sound, which is crucial for both resale and rental markets. ↑
ⓘ Cost ranges are severity-bucket heuristics (US national rule-of-thumb). Get contractor quotes + a written scope before underwriting a rehab budget.
Schools (NCES district)
- District
- Walton
- NCES district ID
- 1201980
- Math proficiency
- 62% ▼ -4.00%
- Reading proficiency
- 61% ▼ -2.00%
- Median HH income
- $46,794
- Composite
- 52.03/100
- National rank
- #1634
- State rank
- #10 of 73 in FL
Livability — Freeport
- Score
- 68/100
- State rank
- #520
- US rank
- #9579
Category grades
Schools grade is shown separately in the Schools card above.
Census & demographics
- Census place
- Freeport, FL
- County
- Walton County · 70,839 people
- City population
- 15,328
- Metro
- Crestview-Fort Walton Beach-Destin, FL
- Population (ZIP)
- 15,328
- Household income
- $83,227
- Rent vs Own
- Severe rent burden
- 172.0
Population outlook (Walton County) Hauer SSP2
- Today (2025)
- 80,014 people
- By 2030
- 88,120 · +10.1%
- By 2040
- 103,537 · +29.4%
- By 2050
- 117,034 · +46.3%
- By 2075
- 143,901 · +79.8%
- By 2100
- 155,138 · +93.9%
Race, ethnicity, and origin ACS 2023
- Neighborhood character
- Predominantly White (76%)
- Race & ethnicity
- White 76% Hispanic / Latino 16% Two or more races 8% Native American 5% Black 1%
- Hispanic origin (detail)
- Mexican 8% Puerto Rican 2% Cuban 1%
- Common ancestry
- Slovak 3% Italian 3% Serbian 2%
- Foreign-born
- 8% · Canada, Jamaica
- Languages at home
- 86% English-only · Spanish 13% Other Indo-European 1%
Political lean MEDSL · Walton
- 2024 margin
- Solid R (+57.8) · D 20.7% · R 78.6%
- 2008→2024 swing
- -12.0pp toward R · 2008: -45.8pp · 2024: -57.8pp
- All cycles
- 2024: R+57.8 2020: R+51.7 2016: R+56.1 2012: R+52.0 2008: R+45.8
Not yet ingested
- Civics
- —
Market trends
- HPI YoY
- ▼ -15.18%
- Current HPI
- 350.4692
- Rent YoY
- ▲ 1.40%
- Metro
- Crestview-Fort Walton Beach-Destin, FL
- State GDP YoY
- ▲ 3.28%
- F500 in state
- 36
Industry mix (Fortune 500 HQ in FL)
| Industry | F500 HQs | Revenue |
|---|---|---|
| Industrial Technology | 2 | $29B |
|
||
| Insurance | 2 | $17B |
|
||
| Retail | 1 | $60B |
|
||
| Technology Distribution | 1 | $58B |
|
||
| Homebuilding | 1 | $35B |
|
||
| Technology Manufacturing | 1 | $35B |
|
||
Cash-flow waterfall
monthlySold comps — $/sqft
last 12 mo · ≤1 miLoading sold comps…