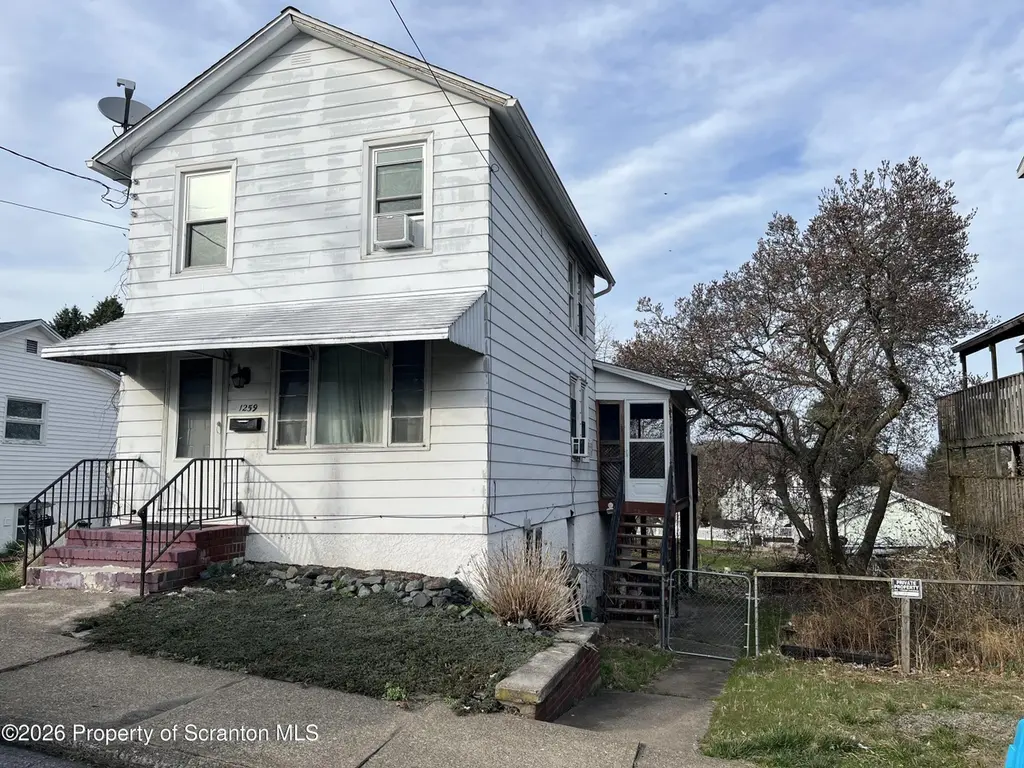
1259 Franklin St · Old Forge, PA
Flood risk 1/10 · Minimal
- FEMA flood zone
- X (unshaded)
- Chance of flooding over 30 yrs
- 0.0%
- Est. flood insurance / yr
- $473 – $860
Fire risk 4/10 · Minor
- Est. fire insurance / yr
- $511 – $949
Heat risk 3/10 · Minor
- Hot days now (above 96°F)
- 7 days/yr
- Hot days in 30 yrs
- 15 days/yr
Wind risk 3/10 · Minor
- Chance of severe wind over 30 yrs
- 4.0%
Air-quality risk 2/10 · Minimal
- Unhealthy air days now
- 0 days/yr
- Unhealthy air days in 30 yrs
- 1 days/yr
Risk factors via First Street. Map © Google.
Why this score? — see what drove the B grade
The composite is a weighted blend of 9 inputs, each scored 0–100. Each bar is that input's sub-score; the figure is the points it added to the 100-point composite (weight × sub-score).
- Cash flow +24.8/30.0
- ARV discount +15.0/15.0
- DSCR +8.1/10.0
- Appreciation +7.6/10.0
- 1% rule +6.4/10.0
- Livability +3.9/5.0
- Schools +3.1/10.0
- Rent growth +2.5/5.0
- Condition / age +2.5/5.0
$160,000
🖨 Deal sheet 📄 Offer letter ✓ Due diligence
Listing remarks MLS
Welcome to this well maintained and inviting starter home located in the ''Pizza Capitol of the World'' , Old Forge, PA. Featuring 2 spacious bedrooms and 2 bathrooms, this home is ideal for first time buyers, downsizers, or anyone looking for a manageable yet functional space. It has newer windows, and the potential to make more living space in the basement. Step outside to a huge back yard, perfect for entertaining, gardening, or simply relaxing. This property also includes a shed with electric, offering excellent space for storage, hobbies, or a workshop. Additional highlights include off street parking. Don't miss your opportunity to own a great home in a desirable location. Schedule your private showing today! All information is approximate and not guaranteed or warranted.
Key facts
- Off street parking
- Shed with electric
- Newer windows
Tags
Neighborhood map
What this means for you Summary
Snapshot
- This is a 2-bed/2.0-bath single-family listed at $160k.
Deal economics
- At list price, monthly cash flow is $341 ($4k/yr) — positive.
- The deal already cash-flows at list — no discount required.
- Meets the 1% rule at list price ($2k rent vs $160k).
- Recommended offer: $155k (3.0% below list) — sets the bar for market timing.
- Cap rate 8.8% vs local median 6.1% in Old Forge — top-decile yield for the area; either an underpriced asset or a hidden risk that comps aren't pricing in. Stress-test before assuming the spread holds.
Location & tenants
- Location reads 78/100 on livability (#287 in PA, #2,531 nationally) — a middle-class / working-renter tenant base. Strengths: crime A+, cost of living A+, housing A+; Watch: employment C-, amenities F, commute F.
- Old Forge SD (suburban): math 22% / reading 49% proficiency, ranked #409 of 539 in PA (top 76%) — families likely to look elsewhere, expect single-tenant / working-renter base with shorter leases.
- Market conditions: 39 active listings in the ZIP; 7 comparable units currently listed for rent nearby; rentals leasing fast (median 14d on market — plan ~1-2 weeks tenant-placement turnaround); 251 units permitted in Lackawanna County in 2024 (0 in 5+ unit buildings).
Forward outlook
- In year one you build about $9k of equity ($1k loan paydown + $8k appreciation (5.2% local appreciation)).
- Lackawanna County population projected to shrink 4% by 2050 — rents likely to lag national; underwrite the cash flow, not the appreciation.
- At projected returns (5.2% appreciation + 3.0% rent growth), your $45k cash investment doubles in ~4 years — after that, you're playing with house money.
- By year 4, paydown + projected appreciation supports a ~$32k cash-out refi (75% LTV) — recoverable capital for the next deal without selling this one.
Negotiation context
- It's been on market 50 days — a 3% lower offer ($155k) is reasonable based on typical stale-listing flexibility.
- Current owner paid $82k; list at $160k implies a 96% gain — meaningful room to come down on a strong offer.
Risks & watch-outs
- Watch-outs: built in 1940 — expect roof / HVAC / electrical / plumbing capex.
Questions for the listing agent
- It's been on market 50 days. Have you received any prior offers? Is the seller open to a 3% concession, seller financing, or rate buy-down credit?
- Built in 1940 — when were the roof, HVAC, electrical panel, plumbing, and water heater last replaced?
- Is there a deadline driving the sale (1031 exchange, divorce, estate, relocation)? That informs how much negotiation room exists.
- Schools are B-rated — typically a magnet for longer-tenancy family renters. What's the average tenant stay here, and is there a school-zone premium baked into asking?
- What's the average days-on-market for RENTAL listings here right now (not sales)? A rising rental-DOM trend means longer vacancies and softer asking-rent achievability than the comps imply.
- What's the recent tenant-quality profile in this submarket — average credit score on applications, eviction rate, late-payment / NSF rate, and stable-employment percentage? A property-management company in the area should have these aggregated.
- How much new for-sale + rental construction is in the pipeline within 1–3 miles? Heavy new supply typically softens prices + rents 12–24 months out; constrained supply supports both.
Investment metrics
- 1% rule
- 1.14% ✓
- Cap rate
- 8.85%
- Cash-on-cash
- 9.12%
- DSCR
- 1.41
- GRM
- 7.3
CMA / ARV
- ARV (median comp)
- $195,009
- List price
- $160,000
- Delta
- -17.95%
- Verdict
- UNDERPRICED
- Comps
- 20 within 1.0 mi
Show comp detail 12 sales within ~0.75 mi
| Address | Dist | Beds/Ba | Sqft | Sold | Price | $/sf | Match |
|---|---|---|---|---|---|---|---|
| 1259 Franklin St | 0.00mi | 2/2.0 | 1,260 (0%) | 1mo | $164,500 | $131 | 99 |
| 1227 Bennett St | 0.12mi | 2/1.5 | 1,210 (-4%) | 3mo | $200,009 | $165 | 83 |
| 1158 Franklin St | 0.22mi | 2/2.0 | 1,281 (+2%) | 6mo | $197,809 | $154 | 82 |
| 1213 Franklin St | 0.14mi | 3/1.0 (+1) | 1,252 (-1%) | 22mo | $192,000 | $153 | 65 |
| 1214 Mine St | 0.17mi | 2/1.0 | 1,104 (-12%) | 8mo | $175,000 | $159 | 61 |
| 1150 Franklin St | 0.24mi | 3/1.5 (+1) | 1,400 (+11%) | 5mo | $65,000 | $46 | 59 |
| 1238 Mine St | 0.10mi | 3/1.5 (+1) | 1,410 (+12%) | 19mo | $236,500 | $168 | 53 |
| 405 Milwaukee Ave | 0.45mi | 3/1.0 (+1) | 1,405 (+12%) | 2mo | $131,000 | $93 | 49 |
| 129 Casper St | 0.35mi | 2/1.0 | 1,100 (-13%) | 11mo | $153,000 | $139 | 49 |
| 710 Maple St | 0.63mi | 2/1.0 | 1,152 (-9%) | 5mo | $165,000 | $143 | 48 |
| 98 Rose Ln | 0.70mi | 3/2.0 (+1) | 1,176 (-7%) | 10mo | $180,000 | $153 | 43 |
| 115 Thomas St | 0.63mi | 2/1.0 | 1,131 (-10%) | 16mo | $95,720 | $85 | 36 |
Match score weights: distance 35% · size 25% · config 20% · recency 20%. Top-matched comps best support the ARV.
Projected returns pro-forma
5.15% appreciation · 3.0% rent growth · sell at horizon
- IRR
- 21.0%
- Equity multiple
- 2.34×
- Total profit
- $59,936
- Equity at exit
- $92,095
- IRR
- 20.6%
- Equity multiple
- 4.61×
- Total profit
- $161,901
- Equity at exit
- $160,133
Cash invested: $44,800 (down + closing). Projections, not guarantees.
Landlord ↔ Tenant lean methodology
- Overall (STATE)
- 62 Landlord-Friendly
- State Pennsylvania
- 62 Landlord-Friendly · EVEN
- County
- — inherits STATE
- City
- — inherits STATE
ZIP-level market 18518
- Home prices YoY
- 2.2%
- Active inventory
- 39
- Price-to-rent
- 7.3×
Monthly cashflow live
- Estimated rent
- $1,831 high interval (Pro) →
- Mortgage (P&I)
- −$839
- Tax est. 1.5%
- −$200 /mo · $2,400/yr
- Insurance
- −$67
- HOA
- −$0
- Vacancy / Maint / Mgmt
- −$384
- Net cashflow
- $341
Break-even live
UW: 25.0% down · 7.5% · 30yr · 1.5% tax · 5.0% vac · 8.0% maint · 8.0% mgmt
Financing live
Cash to close
- Down payment
- $40,000
- Closing costs
- $4,800
- Reserves months
- —
- Total cash needed
- —
Loan-product check · same deal, 3 products live
Conventional
25% down · 7.5% · 30yr
- Down + closing
- —
- Monthly P&I
- —
- Monthly cashflow
- —
- DSCR
- —
- Eligible?
- —
Personal DTI + credit; lowest rate.
DSCR
20% down · 8.5% · 30yr
- Down + closing
- —
- Monthly P&I
- —
- Monthly cashflow
- —
- DSCR
- —
- Eligible?
- —
No personal income docs; deal must DSCR.
Hard money
10% down · 12.0% · 12mo
- Down + closing
- —
- Monthly P&I
- —
- Monthly cashflow
- —
- DSCR
- —
- Eligible?
- —
Short-term bridge; refi at stabilization.
Rent comps 7 comps
| Address | Beds | Baths | Sqft | Rent | $/sqft | DOM | Units | Dist |
|---|---|---|---|---|---|---|---|---|
| 304 Vine St Unit 304 Old Forge, PA | 2.0 | 1.0 | 1000 | $1,400 | $1.40 | 43d | 1 | 0.88mi |
| 200 Oak St Unit 2 Old Forge, PA | 3.0 | 1.5 | 1500 | $1,800 | $1.20 | 43d | 1 | 0.96mi |
| 75 Marimar Dr Old Forge, PA | 2.0 | 2.0 | 1300 | $2,500 | $1.92 | 13d | 1 | 1.10mi |
| 163 Bianca Way Old Forge, PA | 2.0 | 2.0 | 1194 | $2,500 | $2.09 | 13d | 1 | 1.16mi |
| 128-130 Henderson St Old Forge, PA | 1.0 | 1.0 | 900 | $1,195 | $1.33 | 21d | 1 | 1.17mi |
| 152 Drakes Ln Old Forge, PA | 2.0 | 1.0 | 979 | $1,700 | $1.74 | 13d | 1 | 1.29mi |
| 864 S Main St #3 Old Forge, PA | 2.0 | 1.0 | 965 | $1,350 | $1.40 | 13d | 1 | 1.43mi |
Listing history 3 events
-
2026-04-03$160,000 Active 788-char remark
Show marketing remark (788 chars)
Welcome to this well maintained and inviting starter home located in the ''Pizza Capitol of the World'' , Old Forge, PA. Featuring 2 spacious bedrooms and 2 bathrooms, this home is ideal for first time buyers, downsizers, or anyone looking for a manageable yet functional space. It has newer windows, and the potential to make more living space in the basement. Step outside to a huge back yard, perfect for entertaining, gardening, or simply relaxing. This property also includes a shed with electric, offering excellent space for storage, hobbies, or a workshop. Additional highlights include off street parking. Don't miss your opportunity to own a great home in a desirable location. Schedule your private showing today! All information is approximate and not guaranteed or warranted.
-
2019-05-24soldstatus $81,500
-
2008-02-21soldstatus $50,000
ⓘ Source: listings_history table (triggers on properties + properties_extension) + one-shot
backfill from property_details.listing_events for pre-trigger history.
Climate risk First Street
- Flood 1/10 Low FEMA zone X (unshaded) · 0% chance over 30 yrs
- Wildfire 4/10 Moderate
- Heat 3/10 Moderate 7 d/yr ≥96°F today · 15 d/yr by 30 yrs out
- Wind 3/10 Moderate 4% chance of damaging wind over 30 yrs
- Air quality 2/10 Low 0 unhealthy d/yr today · 1 by 30 yrs out
Nearby sold comps map
Loading sold comps map…
Walkable amenities ~0.75 mi
Loading nearby amenities…
Taxation est. · year 1
- Rental income
- $21,969
- − Mortgage interest
- −$8,962
- − Property taxes
- −$2,400
- − Insurance
- −$800
- − Repairs & maintenance
- −$1,758
- − Management
- −$1,758
- − Depreciation
- −$4,655
- Taxable income
- $1,637
- Est. tax owed @ 24.0%
- −$393
- After-tax cash flow
- $3,694/yr
For passive investors: Depreciation is non-cash, so a rental often shows a tax loss while cash-flowing — sheltering income. Rental losses are passive: they offset passive income freely, and up to $25,000/yr can offset ordinary (W-2) income if you actively participate and your MAGI is under $100k (phasing out to $0 by $150k); unused losses carry forward. On sale, claimed depreciation is recaptured at up to 25%, and gains may owe capital-gains tax (a 1031 exchange can defer both). Figures are a year-1 estimate at your 24.0% rate — not tax advice; consult a CPA.
Schools (NCES district)
- District
- Old Forge SD
- NCES district ID
- 4218120
- Math proficiency
- 22% ▼ -19.00%
- Reading proficiency
- 49% ▼ -17.00%
- Median HH income
- $49,409
- Composite
- 30.6/100
- National rank
- #6196
- State rank
- #409 of 539 in PA
Livability — Old Forge
- Score
- 78/100
- State rank
- #287
- US rank
- #2531
Category grades
Schools grade is shown separately in the Schools card above.
Census & demographics
- Census place
- Old Forge, PA
- City population
- 8,533
- Population (ZIP)
- 8,533
Population outlook (Lackawanna County) Hauer SSP2
- Today (2025)
- 210,652 people
- By 2030
- 208,623 · -1.0%
- By 2040
- 203,980 · -3.2%
- By 2050
- 201,069 · -4.5%
- By 2075
- 205,026 · -2.7%
- By 2100
- 210,851 · +0.1%
Race, ethnicity, and origin ACS 2023
- Neighborhood character
- Predominantly White (84%)
- Race & ethnicity
- White 84% Two or more races 13% Hispanic / Latino 9% Asian 1%
- Hispanic origin (detail)
- Puerto Rican 9%
- Common ancestry
- Romanian 17% Scotch-Irish 4% Subsaharan African 2%
- Foreign-born
- 2% · Canada
- Languages at home
- 95% English-only · Spanish 3% Other Indo-European 1% Other Asian/Pacific 1%
Political lean MEDSL · Lackawanna
- 2024 margin
- Toss-up / Even · D 51.0% · R 48.3%
- 2008→2024 swing
- -23.2pp toward R · 2008: 26.0pp · 2024: 2.8pp
- All cycles
- 2024: D+2.8 2020: D+8.4 2016: D+3.4 2012: D+27.4 2008: D+26.0
Not yet ingested
- Civics
- —
Market trends
- HPI YoY
- ▲ 5.15%
- Current HPI
- 242.2839
- Rent YoY
- —
- Metro
- —
- State GDP YoY
- ▲ 1.68%
- F500 in state
- 34
Industry mix (Fortune 500 HQ in PA)
| Industry | F500 HQs | Revenue |
|---|---|---|
| Healthcare | 2 | $309B |
|
||
| Insurance | 2 | $27B |
|
||
| Telecommunications / Media | 1 | $124B |
|
||
| Industrial Distribution | 1 | $22B |
|
||
| Financial Services | 1 | $20B |
|
||
| Chemicals / Materials | 1 | $18B |
|
||
Price history
+220.0% since first listed3 events — show timeline
- 2026-04-03 Listed $160,000 GSBR as distributed by MLS GRID
- 2019-05-24 Sold (Public Records) $81,500 Public Records
- 2008-02-21 Sold (Public Records) $50,000 Public Records
Property tax history
+35.3%/yrLatest (2026): $33,386 · +2247.4% YoY. Source: county tax records.
Cash-flow waterfall
monthlySold comps — $/sqft
last 12 mo · ≤1 miLoading sold comps…