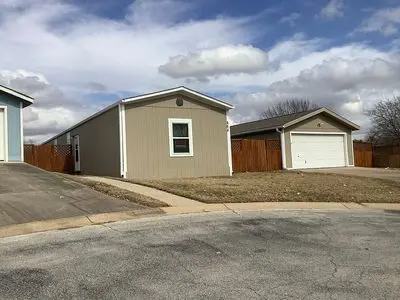
12609 Dessau Rd · Austin, TX
Flood risk 1/10 · Minimal
- FEMA flood zone
- X (unshaded)
- Chance of flooding over 30 yrs
- 0.0%
- Est. flood insurance / yr
- $507 – $1,088
Fire risk 3/10 · Minor
- Est. fire insurance / yr
- $1,222 – $2,270
Heat risk 8/10 · Major
- Hot days now (above 108°F)
- 7 days/yr
- Hot days in 30 yrs
- 24 days/yr
Wind risk 8/10 · Major
- Chance of severe wind over 30 yrs
- 80.0%
Air-quality risk 2/10 · Minimal
- Unhealthy air days now
- 1 days/yr
- Unhealthy air days in 30 yrs
- 1 days/yr
Risk factors via First Street. Map © Google.
Why this score? — see what drove the B- grade
The composite is a weighted blend of 9 inputs, each scored 0–100. Each bar is that input's sub-score; the figure is the points it added to the 100-point composite (weight × sub-score).
- Cash flow +30.0/30.0
- DSCR +10.0/10.0
- 1% rule +9.8/10.0
- ARV discount +7.5/15.0
- Livability +4.1/5.0
- Condition / age +4.0/5.0
- Schools +3.4/10.0
- Rent growth +0.9/5.0
- Appreciation +0.0/10.0
$115,000
🖨 Deal sheet 📄 Offer letter ✓ Due diligence
Listing remarks MLS
Needs TLC and some fixing, but very good condition Sale price for the house only new owner will be responsible for a lot rent to the community
Key facts
- 20x30 garage
- New carpet
- New skirting
Tags
Property features AI
Exterior
- Home design: Built in 2013
- Construction: Living area of 1,292 (living space)
- Exterior features: Located in the River Ranch subdivision
Neighborhood map
What this means for you Summary
Snapshot
- This is a 3-bed/2.0-bath manufactured listed at $115k. Condition is rated good.
Deal economics
- At list price, monthly cash flow is $671 ($8k/yr) — positive.
- The deal already cash-flows at list — no discount required.
- Meets the 1% rule at list price ($2k rent vs $115k).
- Recommended offer: $112k (3.0% below list) — sets the bar for market timing.
- Cap rate 13.3% vs local median 1.8% in Austin — top-decile yield for the area; either an underpriced asset or a hidden risk that comps aren't pricing in. Stress-test before assuming the spread holds.
Location & tenants
- Location reads 82/100 on livability (#16 in TX, #1,208 nationally) — a professional / high-income tenant draw. Strengths: amenities A+, commute A+, employment A+; Watch: cost of living D, crime F.
- Pflugerville ISD (suburban): math 33% / reading 42% proficiency, ranked #421 of 826 in TX (top 51%) — families likely to look elsewhere, expect single-tenant / working-renter base with shorter leases.
- Market conditions: Rents falling (-6.4%/yr); 184 active listings in the ZIP; 40 comparable units currently listed for rent nearby; rentals leasing fast (median 3d on market — plan ~1-2 weeks tenant-placement turnaround); solid renter incomes; 17,121 units permitted in Travis County in 2024 (11,963 in 5+ unit buildings).
Forward outlook
- Local home prices are declining (-3.0%/yr); year-one equity from $795 of loan paydown is wiped out by about $3k of value loss. Plan a longer hold.
- Travis County population projected at +60% by 2050 — long-run rental-demand tailwind backs the buy-and-hold thesis.
- At projected returns (-3.0% appreciation + 0.0% rent growth), your $32k cash investment doubles in ~6 years — after that, you're playing with house money.
Negotiation context
- It's been on market 37 days — a 3% lower offer ($112k) is reasonable based on typical stale-listing flexibility.
- 4 sale attempts; this cycle's ask is 64% above the opening price — seller raised mid-cycle; expect resistance to lowballs.
Risks & watch-outs
- Climate carrying-cost: severe wind risk, 80% chance of damaging wind over 30y; extreme-heat days projected 7→24/yr by 2055 (HVAC capex compounding) — expect insurance premiums to compound above CPI over the hold.
Questions for the listing agent
- It's been on market 37 days. Have you received any prior offers? Is the seller open to a 3% concession, seller financing, or rate buy-down credit?
- Is there a deadline driving the sale (1031 exchange, divorce, estate, relocation)? That informs how much negotiation room exists.
- Crime grade is F in this area — have there been break-ins, vandalism, or insurance claims at this property in the last 3 years? What carrier currently insures it and at what premium?
- What's the average days-on-market for RENTAL listings here right now (not sales)? A rising rental-DOM trend means longer vacancies and softer asking-rent achievability than the comps imply.
- What's the recent tenant-quality profile in this submarket — average credit score on applications, eviction rate, late-payment / NSF rate, and stable-employment percentage? A property-management company in the area should have these aggregated.
- How much new for-sale + rental construction is in the pipeline within 1–3 miles? Heavy new supply typically softens prices + rents 12–24 months out; constrained supply supports both.
Investment metrics
- 1% rule
- 1.48% ✓
- Cap rate
- 13.29%
- Cash-on-cash
- 24.99%
- DSCR
- 2.11
- GRM
- 5.6
CMA / ARV
No comps found within radius.
Projected returns pro-forma
-3.0% appreciation · 0.0% rent growth · sell at horizon
- IRR
- 15.3%
- Equity multiple
- 1.59×
- Total profit
- $19,027
- Equity at exit
- $17,147
- IRR
- 21.8%
- Equity multiple
- 2.62×
- Total profit
- $52,055
- Equity at exit
- $9,943
Cash invested: $32,200 (down + closing). Projections, not guarantees.
Landlord ↔ Tenant lean methodology
- Overall (STATE)
- 87 Strongly Landlord-Friendly
- State Texas
- 87 Strongly Landlord-Friendly · R+5
- County
- — inherits STATE
- City
- — inherits STATE
ZIP-level market 78754
- Home prices YoY
- -32.1%
- Rents YoY
- -6.4%
- Active inventory
- 184
- Price-to-rent
- 5.6×
Monthly cashflow live
- Estimated rent
- $1,706 high interval (Pro) →
- Mortgage (P&I)
- −$603
- Tax from tax record
- −$26 /mo · $310/yr
- Insurance
- −$48
- HOA
- −$0
- Vacancy / Maint / Mgmt
- −$358
- Net cashflow
- $671
Break-even live
UW: 25.0% down · 7.5% · 30yr · 1.5% tax · 5.0% vac · 8.0% maint · 8.0% mgmt
Financing live
Cash to close
- Down payment
- $28,750
- Closing costs
- $3,450
- Reserves months
- —
- Total cash needed
- —
Loan-product check · same deal, 3 products live
Conventional
25% down · 7.5% · 30yr
- Down + closing
- —
- Monthly P&I
- —
- Monthly cashflow
- —
- DSCR
- —
- Eligible?
- —
Personal DTI + credit; lowest rate.
DSCR
20% down · 8.5% · 30yr
- Down + closing
- —
- Monthly P&I
- —
- Monthly cashflow
- —
- DSCR
- —
- Eligible?
- —
No personal income docs; deal must DSCR.
Hard money
10% down · 12.0% · 12mo
- Down + closing
- —
- Monthly P&I
- —
- Monthly cashflow
- —
- DSCR
- —
- Eligible?
- —
Short-term bridge; refi at stabilization.
Rent comps 40 comps
| Address | Beds | Baths | Sqft | Rent | $/sqft | DOM | Units | Dist |
|---|---|---|---|---|---|---|---|---|
| 12609 Linford Dr Austin, TX | 3.0 | 2.5 | 1393 | $2,100 | $1.51 | 43d | 1 | 0.23mi |
| 12435 Dessau Rd Austin, TX | 1.0–3.0 | 1.0–2.0 | 908 | $1,300 | $1.43 | 1d | 9 | 0.43mi |
| 12441 Dessau Rd Austin, TX | 3.0 | 2.0 | 1116 | $1,421 | $1.27 | 43d | 1 | 0.44mi |
| 13021 Dessau Rd #231 Austin, TX | 3.0 | 2.0 | 1456 | $1,700 | $1.17 | 19d | 1 | 0.44mi |
| 12408 Dessau Rd Austin, TX | 1.0–3.0 | 1.0–2.0 | 1077 | $2,145 | $1.99 | 2d | 28 | 0.47mi |
| 12435 Dessau Rd Apt 712 Austin, TX | 3.0 | 2.0 | 1116 | $1,314 | $1.18 | 10d | 1 | 0.47mi |
| 12435 Dessau Rd Unit 12468 Austin, TX | 3.0 | 2.0 | 1116 | $1,375 | $1.23 | 12d | 1 | 0.47mi |
| 12435 Dessau Rd Apt 612 Austin, TX | 2.0 | 2.0 | 1012 | $1,064 | $1.05 | 10d | 1 | 0.47mi |
| 12435 Dessau Rd Unit 12492 Austin, TX | 2.0 | 2.0 | 1012 | $1,115 | $1.10 | 12d | 1 | 0.47mi |
| 12309 Dessau Rd Austin, TX | 2.0 | 2.0 | 1064 | $1,825 | $1.72 | 43d | 1 | 0.57mi |
| 13301 Dessau Rd Austin, TX | 1.0–2.0 | 1.0–2.0 | 887 | $1,443 | $1.63 | 1d | 10 | 0.57mi |
| 1500 E Parmer Ln Austin, TX | 1.0–3.0 | 1.0–2.0 | 977 | $1,310 | $1.34 | 43d | 1 | 0.61mi |
| 1500 E Parmer Ln Austin, TX | 1.0–3.0 | 1.0–2.0 | 977 | $1,310 | $1.34 | 2d | 22 | 0.61mi |
| 1900 E Parmer Ln Unit 10-2214 Austin, TX | 2.0 | 2.0 | 1070 | $1,495 | $1.40 | 3d | 1 | 0.62mi |
| 1900 E Parmer Ln Unit 1256 Austin, TX | 2.0 | 2.0 | 1065 | $1,499 | $1.41 | 3d | 1 | 0.62mi |
| 1900 E Parmer Ln Unit 611 Austin, TX | 2.0 | 2.0 | 1064 | $1,629 | $1.53 | 2d | 1 | 0.62mi |
| 1127 Pearl Retreat Ln Austin, TX | 1.0–3.0 | 1.0–2.0 | 1005 | $1,890 | $1.88 | 1d | 36 | 0.65mi |
| 1507 E Howard Ln Austin, TX | 2.0 | 2.0 | 919 | $1,210 | $1.32 | 43d | 1 | 0.69mi |
| 1200 E Parmer Ln Austin, TX | 3.0 | 1.0–2.0 | 963 | $1,874 | $1.95 | 1d | 39 | 0.70mi |
| 1501 E Howard Ln Austin, TX | 1.0–4.0 | 1.0–2.0 | 1054 | $1,316 | $1.25 | 14d | 1 | 0.72mi |
| 2500 E Howard Ln Unit 2523 Pflugerville, TX | 2.0 | 2.0 | 1034 | $1,839 | $1.78 | 2d | 1 | 0.73mi |
| 13510 Lazyridge Dr Unit 1 Pflugerville, TX | 2.0 | 2.0 | 1046 | $1,810 | $1.73 | 23d | 1 | 0.78mi |
| 13510 Lazyridge Dr Pflugerville, TX | 2.0 | 2.0 | 1046 | $1,810 | $1.73 | 43d | 1 | 0.78mi |
| 12201 Dessau Rd Austin, TX | 3.0 | 1.0–2.0 | 1027 | $2,023 | $1.97 | 1d | 31 | 0.78mi |
| 12129 Dessau Rd Austin, TX | 3.0 | 2.0 | 1311 | $1,565 | $1.19 | 43d | 1 | 0.82mi |
| 2500 E Howard Ln Manor, TX | 3.0 | 1.0–3.5 | 1245 | $3,166 | $2.54 | 1d | 50 | 0.83mi |
| 2606 Totley Rd Pflugerville, TX | 3.0 | 2.0 | 1234 | $2,190 | $1.77 | 1d | 1 | 0.84mi |
| 13309 Riding Dr Pflugerville, TX | 4.0 | 2.0 | 1468 | $2,195 | $1.50 | 17d | 1 | 0.84mi |
| 13527 Harrisglenn Dr Pflugerville, TX | 1.0–2.0 | 1.0–2.0 | 961 | $1,199 | $1.25 | 1d | 21 | 0.88mi |
| 12113 Dessau Rd Unit 12146 Austin, TX | 3.0 | 2.0 | 1311 | $1,870 | $1.43 | 2d | 1 | 0.89mi |
| 12113 Dessau Rd Unit 12170 Austin, TX | 2.0 | 2.0 | 1065 | $1,292 | $1.21 | 2d | 1 | 0.89mi |
| 12800 Harrisglenn Dr Unit 12833 Austin, TX | 3.0 | 2.0 | 1395 | $1,727 | $1.24 | 2d | 1 | 0.89mi |
| 12800 Harrisglenn Dr Unit 12857 Austin, TX | 2.0 | 2.0 | 1043 | $1,182 | $1.13 | 2d | 1 | 0.89mi |
| 13624 Dessau Rd Pflugerville, TX | 1.0–3.0 | 1.0–2.0 | 919 | $2,095 | $2.28 | 3d | 24 | 0.89mi |
| 1308 Hazleton Cv Austin, TX | 3.0 | 2.0 | 1205 | $2,100 | $1.74 | 4d | 1 | 0.90mi |
| 2700 E Howard Ln Manor, TX | 2.0 | 1.0–2.0 | 890 | $1,819 | $2.04 | 1d | 52 | 0.90mi |
| 1601 Scottsdale Ln Austin, TX | 1.0–2.0 | 1.0–2.0 | 960 | $2,074 | $2.16 | 43d | 128 | 0.92mi |
| 2805 Totley Rd Pflugerville, TX | 3.0 | 2.0 | 1450 | $2,099 | $1.45 | 43d | 1 | 0.94mi |
| 2702 Paragon Fox Dr Pflugerville, TX | 2.0 | 2.0 | 1320 | $1,900 | $1.44 | 43d | 1 | 0.94mi |
| 2615 Derwent Dr Pflugerville, TX | 4.0 | 2.0 | 1468 | $2,195 | $1.50 | 1d | 1 | 0.98mi |
Listing history 19 events
-
2026-06-18days on market $115,000 Active 37 DOM
-
2026-06-17days on market $115,000 Active 36 DOM
-
2026-06-16days on market $115,000 Active 35 DOM
Show marketing remark (143 chars)
Needs TLC and some fixing, but very good condition Sale price for the house only new owner will be responsible for a lot rent to the community
-
2026-06-15days on market $115,000 Active 34 DOM
-
2026-06-13days on market $115,000 Active 32 DOM
-
2026-06-09days on market $115,000 Active 28 DOM
Show marketing remark (143 chars)
Needs TLC and some fixing, but very good condition Sale price for the house only new owner will be responsible for a lot rent to the community
-
2026-06-08days on market $115,000 Active 27 DOM
-
2026-06-07days on market $115,000 Active 26 DOM
-
2026-06-05days on market $115,000 Active 23 DOM
-
2026-06-03days on market $115,000 Active 22 DOM
-
2026-06-02days on market $115,000 Active 21 DOM
-
2026-06-01days on market $115,000 Active 20 DOM
-
2026-05-31days on market $115,000 Active 19 DOM
-
2026-05-12$115,000 Active 1187-char remark
-
2026-01-29status Pending
-
2025-11-13status Active
-
2025-11-07historical Active Option Contract
-
2025-10-16price $125,000
-
2025-07-20$128,000 Active
ⓘ Source: listings_history table (triggers on properties + properties_extension) + one-shot
backfill from property_details.listing_events for pre-trigger history.
Tax reassessment forecast TX · Resets to sale price
- Current annual tax
- $310 · $26/mo
- Projected year-2 tax
- $2,104 · $175/mo
- Expected delta
- +$1,794/yr (+$150/mo · 578.4%)
ⓘ Screening estimate from a state-policy table — verify with the county assessor before closing.
Climate risk First Street
- Flood 1/10 Low FEMA zone X (unshaded) · 0% chance over 30 yrs
- Wildfire 3/10 Moderate
- Heat 8/10 Severe 7 d/yr ≥108°F today · 24 d/yr by 30 yrs out
- Wind 8/10 Severe 80% chance of damaging wind over 30 yrs
- Air quality 2/10 Low 1 unhealthy d/yr today · 1 by 30 yrs out
Nearby sold comps map
Loading sold comps map…
Walkable amenities ~0.75 mi
Loading nearby amenities…
Taxation est. · year 1
- Rental income
- $20,467
- − Mortgage interest
- −$6,442
- − Property taxes
- −$310
- − Insurance
- −$575
- − Repairs & maintenance
- −$1,637
- − Management
- −$1,637
- − Depreciation
- −$3,345
- Taxable income
- $6,519
- Est. tax owed @ 24.0%
- −$1,565
- After-tax cash flow
- $6,482/yr
For passive investors: Depreciation is non-cash, so a rental often shows a tax loss while cash-flowing — sheltering income. Rental losses are passive: they offset passive income freely, and up to $25,000/yr can offset ordinary (W-2) income if you actively participate and your MAGI is under $100k (phasing out to $0 by $150k); unused losses carry forward. On sale, claimed depreciation is recaptured at up to 25%, and gains may owe capital-gains tax (a 1031 exchange can defer both). Figures are a year-1 estimate at your 24.0% rate — not tax advice; consult a CPA.
Condition & rehab AI · 2 photos
This move-in ready manufactured home is in good condition with recent upgrades, making it a solid investment opportunity.
Value-add opportunities
- Both Paint exterior — Enhances curb appeal and resale value
- Both Trim and mulch landscaping — Improves curb appeal and rental value
Renovation cost estimate screening
Value-add ROI direction
- Both Paint exterior — Enhances curb appeal and resale value ↑
- Both Trim and mulch landscaping — Improves curb appeal and rental value ↑
ⓘ Cost ranges are severity-bucket heuristics (US national rule-of-thumb). Get contractor quotes + a written scope before underwriting a rehab budget.
Schools (NCES district)
- District
- Pflugerville ISD
- NCES district ID
- 4834830
- Math proficiency
- 33% ▼ -16.00%
- Reading proficiency
- 42% ▼ -7.00%
- Median HH income
- $66,723
- Composite
- 33.99/100
- National rank
- #5321
- State rank
- #421 of 826 in TX
Livability — Austin
- Score
- 82/100
- State rank
- #16
- US rank
- #1208
Category grades
Schools grade is shown separately in the Schools card above.
Census & demographics
- County
- Travis County · 1,299,254 people
- City population
- 1,066,854
- Metro
- Austin-Round Rock-Georgetown, TX
- Population (ZIP)
- 32,690
- Household income
- $90,121
- Rent vs Own
- Severe rent burden
- 1520.0
Population outlook (Travis County) Hauer SSP2
- Today (2025)
- 1,545,133 people
- By 2030
- 1,729,269 · +11.9%
- By 2040
- 2,097,596 · +35.8%
- By 2050
- 2,463,890 · +59.5%
- By 2075
- 3,249,374 · +110.3%
- By 2100
- 3,801,868 · +146.1%
Race, ethnicity, and origin ACS 2023
- Neighborhood character
- Highly diverse neighborhood (Simpson 0.74)
- Race & ethnicity
- Hispanic / Latino 37% White 28% Black 16% Asian 14% Two or more races 12% Native American 2%
- Hispanic origin (detail)
- Mexican 26%
- Common ancestry
- Romanian 1% Arab 1% German 1%
- Foreign-born
- 30% · Canada, Vietnam, China
- Languages at home
- 53% English-only · Spanish 28% Vietnamese 10% Other Asian/Pacific 2%
Political lean MEDSL · Travis
- 2024 margin
- Solid D (+39.3) · D 68.8% · R 29.4% · Other 1.8%
- 2008→2024 swing
- +9.9pp toward D · 2008: 29.4pp · 2024: 39.3pp
- All cycles
- 2024: D+39.3 2020: D+45.0 2016: D+38.9 2012: D+23.9 2008: D+29.4
Not yet ingested
- Civics
- —
Market trends
- HPI YoY
- ▼ -107.76%
- Current HPI
- 228.2009
- Rent YoY
- ▼ -6.43%
- Metro
- Austin-Round Rock-Georgetown, TX
- State GDP YoY
- ▲ 3.95%
- F500 in state
- 110
Industry mix (Fortune 500 HQ in TX)
| Industry | F500 HQs | Revenue |
|---|---|---|
| Energy | 16 | $1,198B |
|
||
| Technology | 5 | $198B |
|
||
| Engineering / Construction | 4 | $72B |
|
||
| Energy Services | 3 | $60B |
|
||
| Utilities | 3 | $41B |
|
||
| Healthcare | 2 | $330B |
|
||
Price history
-60.9% since first listed8 events — show timeline
- 2026-06-16 Price Changed $50,000 ForSaleByOwner.com
- 2026-06-09 Listed $70,000 ForSaleByOwner.com
- 2026-05-12 Listed $115,000 FSBO.com
- 2026-01-29 Pending — NTREIS
- 2025-11-13 Relisted — NTREIS
- 2025-11-07 Contingent — NTREIS
- 2025-10-16 Price Changed $125,000 NTREIS
- 2025-07-20 Listed $128,000 NTREIS
Cash-flow waterfall
monthlySold comps — $/sqft
last 12 mo · ≤1 miLoading sold comps…