20 Church St · New York, NY
Flood risk 10/10 · Severe
- FEMA flood zone
- AE
- Chance of flooding over 30 yrs
- 0.99%
- Est. flood insurance / yr
- $1,737 – $8,500
Fire risk 2/10 · Minimal
- Est. fire insurance / yr
- $691 – $1,283
Heat risk 6/10 · Moderate
- Hot days now (above 98°F)
- 7 days/yr
- Hot days in 30 yrs
- 14 days/yr
Wind risk 6/10 · Moderate
- Chance of severe wind over 30 yrs
- 69.0%
Air-quality risk 4/10 · Minor
- Unhealthy air days now
- 6 days/yr
- Unhealthy air days in 30 yrs
- 6 days/yr
Risk factors via First Street. Map © Google.
Why this score? — see what drove the C- grade
The composite is a weighted blend of 9 inputs, each scored 0–100. Each bar is that input's sub-score; the figure is the points it added to the 100-point composite (weight × sub-score).
- Cash flow +19.6/30.0
- ARV discount +7.5/15.0
- DSCR +6.2/10.0
- 1% rule +5.1/10.0
- Schools +5.0/10.0
- Livability +3.8/5.0
- Rent growth +2.5/5.0
- Condition / age +2.5/5.0
- Appreciation +0.0/10.0
$385,000
🖨 Deal sheet (PDF) 📄 Offer letter ✓ Due diligence
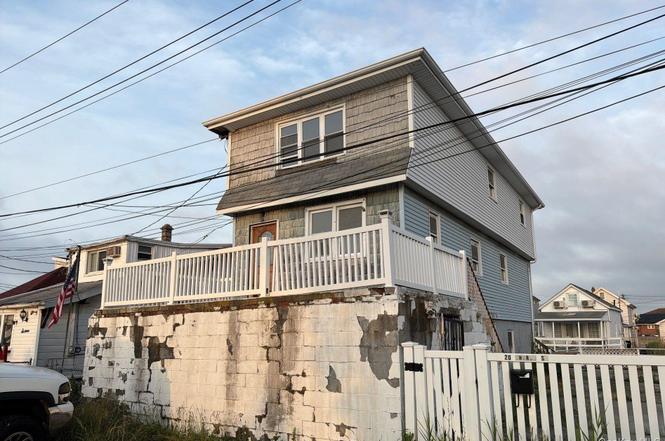
Listing remarks
2-Story free-standing single-unit property with a full above ground basement, waterfront location and an oversized parcel spanning three tax lots. This property has exceptional potential and presents an amazing opportunity.
Key facts
- Oversized parcel
- Waterfront location
- 3,778 sq ft lot
Tags
Property features AI
Exterior
- Parking: Driveway (off-street parking); No carport
- Utilities: Sewer: other; Utilities: See remarks
- Home design: Single family residence; Fixer condition
- Construction: Frame construction
- Exterior features: Back yard; Front yard; Cul-de-sac lot; Irregular lot; Waterfront
Interior
- Kitchen: Eat-in kitchen
- Bathrooms: 2 full bathrooms
- Heating & cooling: No central cooling; Other heating
- Interior features: Eat-in kitchen; Formal dining; Soaking tub; Washer/dryer hookup; Finished full basement; Two levels; 8 total rooms
- Laundry & utility: Laundry in basement; Washer/dryer hookup
Neighborhood map
What this means for you Summary
Snapshot
- This is a 4-bed/2.0-bath single-family listed at $385k.
Deal economics
- At list price, monthly cash flow is $18 ($219/yr) — positive.
- The deal already cash-flows at list — no discount required.
- Meets the 1% rule at list price ($4k rent vs $385k).
- Cap rate 7.7% vs local median 2.6% in New York — top-decile yield for the area; either an underpriced asset or a hidden risk that comps aren't pricing in. Stress-test before assuming the spread holds.
Location & tenants
- Location reads 75/100 on livability (#268 in NY, #4,188 nationally) — a middle-class / working-renter tenant base. Strengths: amenities A+, commute A+, health & safety A; Watch: crime F, cost of living F.
- Zoned schools: Elm Tree Elementary School (math 27% / reading 52%, grade F, #1,444 of 2,108 statewide, top 71%, 806 students, 94% FRL); Is 227 Louis Armstrong (math 52% / reading 69%, grade B+, #153 of 729 statewide, top 21%, 1,528 students, 68% FRL); Midwood High School (math 94% / reading 96%, grade A+, #83 of 1,100 statewide, top 8%, 4,062 students, 73% FRL).
- Market conditions: 260 active listings in the ZIP; 1 comparable units currently listed for rent nearby; solid renter incomes; 5,302 units permitted in Queens County in 2024 (4,918 in 5+ unit buildings).
- At $3,874/mo this rent would consume 49% of the median local household income ($95k/yr) (locally 985% of renters already pay >50% of income on rent) — very limited rent-growth headroom before tenants either downsize or default.
Forward outlook
- Local home prices are declining (-3.0%/yr); year-one equity from $3k of loan paydown is wiped out by about $12k of value loss. Plan a longer hold.
- Queens County population projected at +16% by 2050 — long-run rental-demand tailwind backs the buy-and-hold thesis.
Negotiation context
- Only 10 days on market — expect competitive offers; lowballing is unlikely to land.
- 3 sale attempts since 12y ago with the ask held roughly flat each time — persistent listings suggest the price (not the market) is what's stuck; bring a comps-based counter.
- Current owner paid $100; list at $385k implies a 384900% gain — meaningful room to come down on a strong offer.
Risks & watch-outs
- Watch-outs: flood insurance adds $427/mo; built in 1930 — expect roof / HVAC / electrical / plumbing capex.
- Climate carrying-cost: in FEMA flood zone AE (mandatory federal flood insurance); major wind risk, 69% chance of damaging wind over 30y; extreme-heat days projected 7→14/yr by 2055 (HVAC capex compounding) — expect insurance premiums to compound above CPI over the hold.
Questions for the listing agent
- Built in 1930 — when were the roof, HVAC, electrical panel, plumbing, and water heater last replaced?
- What's the actual annual flood-insurance premium (NFIP or private), and is the property in a SFHA with mandatory coverage?
- Is there a deadline driving the sale (1031 exchange, divorce, estate, relocation)? That informs how much negotiation room exists.
- Schools are B-rated — typically a magnet for longer-tenancy family renters. What's the average tenant stay here, and is there a school-zone premium baked into asking?
- Crime grade is F in this area — have there been break-ins, vandalism, or insurance claims at this property in the last 3 years? What carrier currently insures it and at what premium?
- What's the average days-on-market for RENTAL listings here right now (not sales)? A rising rental-DOM trend means longer vacancies and softer asking-rent achievability than the comps imply.
- What's the recent tenant-quality profile in this submarket — average credit score on applications, eviction rate, late-payment / NSF rate, and stable-employment percentage? A property-management company in the area should have these aggregated.
- How much new for-sale + rental construction is in the pipeline within 1–3 miles? Heavy new supply typically softens prices + rents 12–24 months out; constrained supply supports both.
Investment metrics
- 1% rule
- 1.01% ✓
- Cap rate
- 7.68%
- Cash-on-cash
- 4.95%
- DSCR
- 1.22
- GRM
- 8.3
CMA / ARV
- ARV (on-the-fly)
- $919,080
- Comps found
- 12
Show comp detail 12 sales within ~0.75 mi
| Address | Dist | Beds/Ba | Sqft | Sold | Price | $/sf | Match |
|---|---|---|---|---|---|---|---|
| 161-40 99th St | 0.11mi | 4/2.0 | 1,890 (-9%) | 5mo | $885,000 | $468 | 76 |
| 100-19 160th Ave | 0.14mi | 5/2.0 (+1) | 1,934 (-7%) | 3mo | $873,000 | $451 | 75 |
| 163-30 91st St | 0.56mi | 4/2.0 | 2,150 (+4%) | 6mo | $954,000 | $444 | 63 |
| 160-46 87th St | 0.68mi | 4/2.0 | 2,000 (-3%) | 2mo | $950,000 | $475 | 61 |
| 161-39 90th St | 0.51mi | 4/2.5 | 1,956 (-6%) | 6mo | $989,400 | $506 | 60 |
| 160-31 90th St | 0.51mi | 3/2.0 (-1) | 2,000 (-3%) | 7mo | $855,000 | $428 | 59 |
| 90-04 159th Ave | 0.56mi | 3/2.5 (-1) | 2,116 (+2%) | 6mo | $850,000 | $402 | 58 |
| 159-15 89th St | 0.59mi | 3/2.0 (-1) | 2,177 (+5%) | 2mo | $825,000 | $379 | 57 |
| 160-14 86th St | 0.74mi | 4/2.5 | 2,000 (-3%) | 4mo | $750,111 | $375 | 54 |
| 160-39 91st St | 0.46mi | 4/3.0 | 2,366 (+14%) | 8mo | $1,100,000 | $465 | 44 |
| 158-35 91 St | 0.54mi | 5/3.0 (+1) | 2,300 (+11%) | 5mo | $998,000 | $434 | 43 |
| 161-08 86th St | 0.73mi | 4/4.0 | 2,366 (+14%) | 2mo | $1,025,000 | $433 | 32 |
Match score weights: distance 35% · size 25% · config 20% · recency 20%. Top-matched comps best support the ARV.
Projected returns pro-forma
-3.0% appreciation · 3.0% rent growth · sell at horizon
- IRR
- -15.9%
- Equity multiple
- 0.43×
- Total profit
- $-60,931
- Equity at exit
- $57,405
- IRR
- -7.3%
- Equity multiple
- 0.53×
- Total profit
- $-50,372
- Equity at exit
- $33,288
Cash invested: $107,800 (down + closing). Projections, not guarantees.
Landlord ↔ Tenant lean methodology
- Overall (CITY)
- 0 Strongly Tenant-Friendly
- State New York
- 15 Strongly Tenant-Friendly · D+10
- County
- — inherits STATE
- City New York
- 0 Strongly Tenant-Friendly · D+34
ZIP-level market 11414
- Active inventory
- 260
- Price-to-rent
- 8.3×
Monthly cashflow live
- Estimated rent
- $3,874 medium interval (Pro) →
- Mortgage (P&I)
- −$2,019
- Tax from tax record
- −$436 /mo · $5,231/yr
- Insurance
- −$160
- Flood insurance flood zone
- −$427 /mo · $5,118/yr
- HOA
- −$0
- Vacancy / Maint / Mgmt
- −$813
- Net cashflow
- $18
Break-even live
Sensitivity live
| Price | -10% $236 | -5% $127 | +0% $18 | +5% $-91 | +10% $-200 |
|---|---|---|---|---|---|
| Rent | -10% $-288 | -5% $-135 | +0% $18 | +5% $171 | +10% $324 |
| Rate | -1.0pp $212 | -0.5pp $116 | base $18 | +0.5pp $-82 | +1.0pp $-183 |
UW: 25.0% down · 7.5% · 30yr · 1.5% tax · 5.0% vac · 8.0% maint · 8.0% mgmt
Financing live
Cash to close
- Down payment
- $96,250
- Closing costs
- $11,550
- Reserves months
- —
- Total cash needed
- —
Loan-product check · same deal, 3 products live
Conventional
25% down · 7.5% · 30yr
- Down + closing
- —
- Monthly P&I
- —
- Monthly cashflow
- —
- DSCR
- —
- Eligible?
- —
Personal DTI + credit; lowest rate.
DSCR
20% down · 8.5% · 30yr
- Down + closing
- —
- Monthly P&I
- —
- Monthly cashflow
- —
- DSCR
- —
- Eligible?
- —
No personal income docs; deal must DSCR.
Hard money
10% down · 12.0% · 12mo
- Down + closing
- —
- Monthly P&I
- —
- Monthly cashflow
- —
- DSCR
- —
- Eligible?
- —
Short-term bridge; refi at stabilization.
Rent comps 1 comps
| Address | Beds | Baths | Sqft | Rent | $/sqft | DOM | Units | Dist |
|---|---|---|---|---|---|---|---|---|
| 155-69 99th St Unit 2nd Floor Jamaica, NY | 3.0 | 1.5 | 1500 | $3,200 | $2.13 | 22d | 1 | 0.51mi |
Listing history 7 events
-
2026-06-21days on market $385,000 Active 10 DOM
-
2026-06-18days on market $385,000 Active 7 DOM
-
2026-06-17days on market $385,000 Active 6 DOM
-
2026-06-16days on market $385,000 Active 5 DOM
-
2026-06-15days on market $385,000 Active 4 DOM
-
2026-06-13remarks 223-char remark
-
2026-06-13$385,000 Active 2 DOM
ⓘ Source: listings_history table (triggers on properties + properties_extension) + one-shot
backfill from property_details.listing_events for pre-trigger history.
Tax reassessment forecast NY · Partial reset (capped growth)
- Current annual tax
- $5,231 · $436/mo
- Projected year-2 tax
- $5,869 · $489/mo
- Expected delta
- +$638/yr (+$53/mo · 12.2%)
ⓘ Screening estimate from a state-policy table — verify with the county assessor before closing.
Climate risk First Street
- Flood 10/10 Extreme FEMA zone AE · 99% chance over 30 yrs
- Wildfire 2/10 Low
- Heat 6/10 Major 7 d/yr ≥98°F today · 14 d/yr by 30 yrs out
- Wind 6/10 Major 69% chance of damaging wind over 30 yrs
- Air quality 4/10 Moderate 6 unhealthy d/yr today · 6 by 30 yrs out
Nearby sold comps map
Loading sold comps map…
Walkable amenities ~0.75 mi
Loading nearby amenities…
Taxation est. · year 1
- Rental income
- $46,483
- − Mortgage interest
- −$21,566
- − Property taxes
- −$5,231
- − Insurance
- −$7,044
- − Repairs & maintenance
- −$3,719
- − Management
- −$3,719
- − Depreciation
- −$11,200
- Taxable loss
- −$5,995
- Est. tax savings @ 24.0%
- +$1,439
- After-tax cash flow
- $1,658/yr
For passive investors: Depreciation is non-cash, so a rental often shows a tax loss while cash-flowing — sheltering income. Rental losses are passive: they offset passive income freely, and up to $25,000/yr can offset ordinary (W-2) income if you actively participate and your MAGI is under $100k (phasing out to $0 by $150k); unused losses carry forward. On sale, claimed depreciation is recaptured at up to 25%, and gains may owe capital-gains tax (a 1031 exchange can defer both). Figures are a year-1 estimate at your 24.0% rate — not tax advice; consult a CPA.
Schools (NCES district)
No district data.
Livability — New York
- Score
- 75/100
- State rank
- #268
- US rank
- #4188
Category grades
Schools grade is shown separately in the Schools card above.
Census & demographics
- Census place
- New York, NY
- County
- Queens County · 1,914,869 people
- City population
- 7,731,280
- Metro
- New York-Newark-Jersey City, NY-NJ-PA
- Population (ZIP)
- 31,308
- Household income
- $95,051
- Rent vs Own
- Severe rent burden
- 985.0
Population outlook (Queens County) Hauer SSP2
- Today (2025)
- 2,546,320 people
- By 2030
- 2,643,059 · +3.8%
- By 2040
- 2,815,563 · +10.6%
- By 2050
- 2,944,423 · +15.6%
- By 2075
- 3,123,338 · +22.7%
- By 2100
- 3,098,688 · +21.7%
Race, ethnicity, and origin ACS 2023
- Neighborhood character
- Diverse neighborhood (Simpson 0.56)
- Race & ethnicity
- White 61% Hispanic / Latino 25% Two or more races 13% Black 5% Asian 5%
- Hispanic origin (detail)
- Puerto Rican 11% Dominican 6%
- Common ancestry
- Romanian 4% Scotch-Irish 1%
- Foreign-born
- 20% · Canada, Jamaica, China
- Languages at home
- 63% English-only · Spanish 17% Other Indo-European 14% Russian/Polish/Slavic 2%
Political lean MEDSL · Queens
- 2024 margin
- Strong D (+24.6) · D 62.3% · R 37.7%
- 2008→2024 swing
- -26.2pp toward R · 2008: 50.8pp · 2024: 24.6pp
- All cycles
- 2024: D+24.6 2020: D+45.2 2016: D+53.4 2012: D+58.5 2008: D+50.8
Not yet ingested
- Civics
- —
Market trends
- HPI YoY
- ▼ -227.02%
- Current HPI
- 206.6334
- Rent YoY
- —
- Metro
- New York-Newark-Jersey City, NY-NJ-PA
- State GDP YoY
- ▲ 2.60%
- F500 in state
- 92
Industry mix (Fortune 500 HQ in NY)
| Industry | F500 HQs | Revenue |
|---|---|---|
| Financial Services | 10 | $950B |
|
||
| Consumer Goods | 9 | $162B |
|
||
| Insurance | 4 | $225B |
|
||
| Telecommunications | 2 | $144B |
|
||
| Pharmaceuticals | 2 | $112B |
|
||
| Media / Entertainment | 2 | $69B |
|
||
Price history
+120.0% since first listed9 events — show timeline
- 2026-06-10 Listed $385,000 OneKey® MLS as Distributed by MLS Grid
- 2026-04-21 Sold (Public Records) $100 Public Records
- 2016-09-08 Listing Removed — OneKey® MLS as Distributed by MLS Grid
- 2016-06-27 Listed $450,000 OneKey® MLS as Distributed by MLS Grid
- 2014-10-10 Listing Removed — OneKey® MLS as Distributed by MLS Grid
- 2014-05-03 Listed $389,000 OneKey® MLS as Distributed by MLS Grid
- 2012-12-27 Sold (Public Records) $290,000 Public Records
- 2010-10-25 Sold (Public Records) $290,000 Public Records
- 1995-05-08 Sold (Public Records) $175,000 Public Records
Property tax history
+6.1%/yrLatest (2025): $5,231 · +3.6% YoY. Source: county tax records.
Cash-flow waterfall
monthlySold comps — $/sqft
last 12 mo · ≤1 miLoading sold comps…