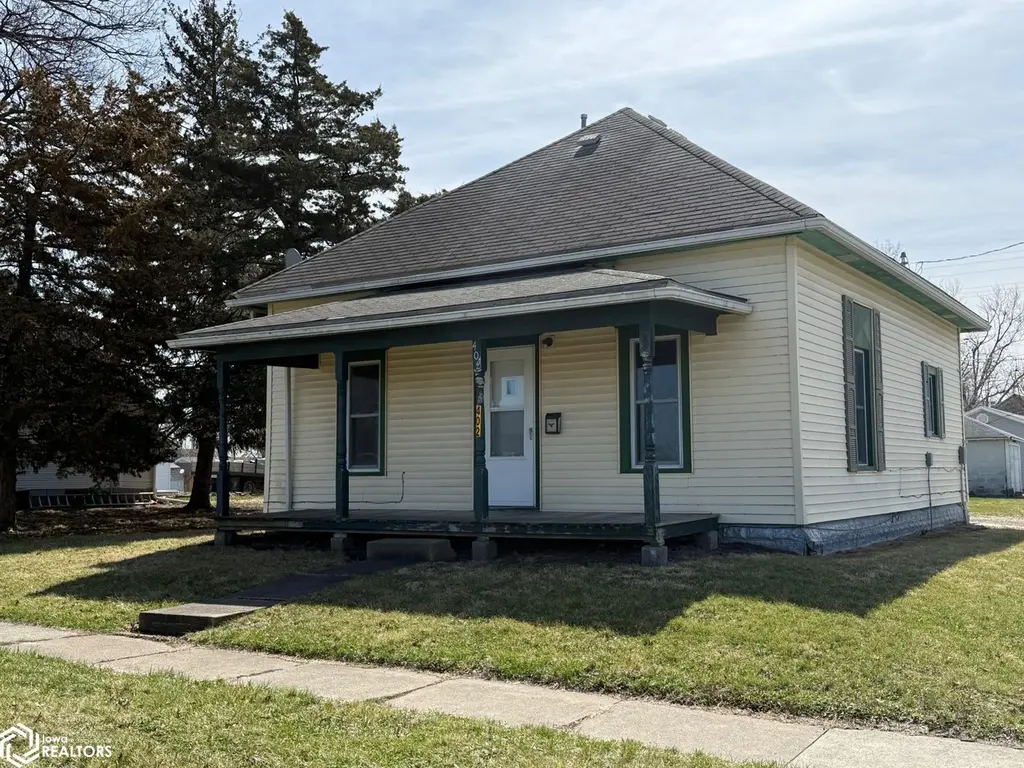
402 E Franklin St · Bloomfield, IA
Flood risk 1/10 · Minimal
- FEMA flood zone
- X (unshaded)
- Chance of flooding over 30 yrs
- 0.0%
- Est. flood insurance / yr
- $507 – $1,088
Fire risk 4/10 · Minor
- Est. fire insurance / yr
- $902 – $1,676
Heat risk 3/10 · Minor
- Hot days now (above 105°F)
- 7 days/yr
- Hot days in 30 yrs
- 15 days/yr
Wind risk 2/10 · Minimal
- Chance of severe wind over 30 yrs
- —
Air-quality risk 2/10 · Minimal
- Unhealthy air days now
- 1 days/yr
- Unhealthy air days in 30 yrs
- 1 days/yr
Risk factors via First Street. Map © Google.
Why this score? — see what drove the C- grade
The composite is a weighted blend of 9 inputs, each scored 0–100. Each bar is that input's sub-score; the figure is the points it added to the 100-point composite (weight × sub-score).
- ARV discount +15.0/15.0
- Cash flow +14.9/30.0
- Schools +5.2/10.0
- DSCR +4.6/10.0
- Livability +3.9/5.0
- 1% rule +3.8/10.0
- Rent growth +2.5/5.0
- Condition / age +2.5/5.0
- Appreciation +0.0/10.0
$74,000
🖨 Deal sheet 📄 Offer letter ✓ Due diligence
Listing remarks MLS
2 bedroom 1 bath home with newer updates. This property is agent owned.
Key facts
- 5,227 sq ft lot
- Built 1906
- Listed 49 days
Neighborhood map
What this means for you Summary
Snapshot
- This is a 2-bed/1.5-bath single-family listed at $74k.
Deal economics
- At list price, monthly cash flow is $21 ($257/yr) — positive.
- The deal already cash-flows at list — no discount required.
- To meet the 1% rule (rent ≥ 1% of price), the offer needs to be $65k (12.2% below list).
- Recommended offer: $65k (12.2% below list) — sets the bar for 1% rule.
- Cap rate 6.6% vs local median 2.8% in Bloomfield — top-decile yield for the area; either an underpriced asset or a hidden risk that comps aren't pricing in. Stress-test before assuming the spread holds.
Location & tenants
- Location reads 77/100 on livability (#159 in IA, #2,887 nationally) — a middle-class / working-renter tenant base. Strengths: crime A+, cost of living A+, housing A+; Watch: employment D+, amenities F, commute F.
- Davis County Community School District (rural): math 59% / reading 63% proficiency, ranked #236 of 289 in IA (top 82%) — acceptable for families but not a draw, mixed tenant base, ~2y average lease.
- Market conditions: 43 active listings in the ZIP; 1 comparable units currently listed for rent nearby; 2 units permitted in Davis County in 2024 (0 in 5+ unit buildings).
Forward outlook
- Local home prices are declining (-3.0%/yr); year-one equity from $512 of loan paydown is wiped out by about $2k of value loss. Plan a longer hold.
- Davis County population projected to shrink 9% by 2050 — rents likely to lag national; underwrite the cash flow, not the appreciation.
Negotiation context
- It's been on market 49 days — a 3% lower offer ($72k) is reasonable based on typical stale-listing flexibility.
- 2 sale attempts since 2y ago; this cycle's ask has dropped $11k (13%) from the opening price — seller is motivated, your offer sets the floor, not the list.
- Current owner paid $35k; list at $74k implies a 111% gain — meaningful room to come down on a strong offer.
Risks & watch-outs
- Watch-outs: built in 1906 — expect roof / HVAC / electrical / plumbing capex.
Questions for the listing agent
- It's been on market 49 days. Have you received any prior offers? Is the seller open to a 12% concession, seller financing, or rate buy-down credit?
- Built in 1906 — when were the roof, HVAC, electrical panel, plumbing, and water heater last replaced?
- Is there a deadline driving the sale (1031 exchange, divorce, estate, relocation)? That informs how much negotiation room exists.
- Schools are B-rated — typically a magnet for longer-tenancy family renters. What's the average tenant stay here, and is there a school-zone premium baked into asking?
- What's the average days-on-market for RENTAL listings here right now (not sales)? A rising rental-DOM trend means longer vacancies and softer asking-rent achievability than the comps imply.
- What's the recent tenant-quality profile in this submarket — average credit score on applications, eviction rate, late-payment / NSF rate, and stable-employment percentage? A property-management company in the area should have these aggregated.
- How much new for-sale + rental construction is in the pipeline within 1–3 miles? Heavy new supply typically softens prices + rents 12–24 months out; constrained supply supports both.
Investment metrics
- 1% rule
- 0.88% ✗
- Cap rate
- 6.64%
- Cash-on-cash
- 1.24%
- DSCR
- 1.06
- GRM
- 9.5
CMA / ARV
- ARV (median comp)
- $93,549
- List price
- $74,000
- Delta
- -20.90%
- Verdict
- UNDERPRICED
- Comps
- 20 within 1.0 mi
Show comp detail 7 sales within ~0.75 mi
| Address | Dist | Beds/Ba | Sqft | Sold | Price | $/sf | Match |
|---|---|---|---|---|---|---|---|
| 308 S Washington | 0.20mi | 2/1.0 | 832 (+7%) | 10mo | $140,750 | $169 | 70 |
| 603 W Walnut St | 0.61mi | 2/1.5 | 768 (-2%) | 2mo | $144,500 | $188 | 67 |
| 406 E Chestnut St | 0.14mi | 2/1.5 | 896 (+15%) | 3mo | $115,000 | $128 | 66 |
| 103 E Chestnut St | 0.22mi | 2/1.0 | 864 (+11%) | 9mo | $92,000 | $106 | 62 |
| 306 E Chestnut St | 0.15mi | 2/1.0 | 840 (+8%) | 22mo | $112,000 | $133 | 60 |
| 407 S West St | 0.44mi | 2/1.0 | 868 (+11%) | 8mo | $92,000 | $106 | 52 |
| 305 W Grant St | 0.57mi | 2/1.0 | 840 (+8%) | 15mo | $57,000 | $68 | 46 |
Match score weights: distance 35% · size 25% · config 20% · recency 20%. Top-matched comps best support the ARV.
Projected returns pro-forma
-3.0% appreciation · 3.0% rent growth · sell at horizon
- IRR
- -14.3%
- Equity multiple
- 0.49×
- Total profit
- $-10,628
- Equity at exit
- $11,034
- IRR
- -5.6%
- Equity multiple
- 0.64×
- Total profit
- $-7,505
- Equity at exit
- $6,398
Cash invested: $20,720 (down + closing). Projections, not guarantees.
Landlord ↔ Tenant lean methodology
- Overall (STATE)
- 83 Strongly Landlord-Friendly
- State Iowa
- 83 Strongly Landlord-Friendly · R+6
- County
- — inherits STATE
- City
- — inherits STATE
ZIP-level market 52537
- Home prices YoY
- -6.9%
- Active inventory
- 43
- Price-to-rent
- 9.5×
Monthly cashflow live
- Estimated rent
- $650 medium interval (Pro) →
- Mortgage (P&I)
- −$388
- Tax from tax record
- −$73 /mo · $878/yr
- Insurance
- −$31
- HOA
- −$0
- Vacancy / Maint / Mgmt
- −$136
- Net cashflow
- $21
Break-even live
UW: 25.0% down · 7.5% · 30yr · 1.5% tax · 5.0% vac · 8.0% maint · 8.0% mgmt
Financing live
Cash to close
- Down payment
- $18,500
- Closing costs
- $2,220
- Reserves months
- —
- Total cash needed
- —
Loan-product check · same deal, 3 products live
Conventional
25% down · 7.5% · 30yr
- Down + closing
- —
- Monthly P&I
- —
- Monthly cashflow
- —
- DSCR
- —
- Eligible?
- —
Personal DTI + credit; lowest rate.
DSCR
20% down · 8.5% · 30yr
- Down + closing
- —
- Monthly P&I
- —
- Monthly cashflow
- —
- DSCR
- —
- Eligible?
- —
No personal income docs; deal must DSCR.
Hard money
10% down · 12.0% · 12mo
- Down + closing
- —
- Monthly P&I
- —
- Monthly cashflow
- —
- DSCR
- —
- Eligible?
- —
Short-term bridge; refi at stabilization.
Rent comps 1 comps
| Address | Beds | Baths | Sqft | Rent | $/sqft | DOM | Units | Dist |
|---|---|---|---|---|---|---|---|---|
| 920 W Chestnut St Unit 2 Bloomfield, IA | 1.0 | 1.0 | 637 | $650 | $1.02 | 44d | 1 | 0.92mi |
Listing history 8 events
-
2026-05-18status Pending 71-char remark
Show marketing remark (71 chars)
2 bedroom 1 bath home with newer updates. This property is agent owned.
-
2026-05-11price $74,000 71-char remark
Show marketing remark (71 chars)
2 bedroom 1 bath home with newer updates. This property is agent owned.
-
2026-04-30price $79,000 71-char remark
Show marketing remark (71 chars)
2 bedroom 1 bath home with newer updates. This property is agent owned.
-
2026-03-30$85,000 Active 71-char remark
Show marketing remark (71 chars)
2 bedroom 1 bath home with newer updates. This property is agent owned.
-
2024-11-30historical $725
-
2024-11-20$725
-
2024-09-18soldstatus $35,000
-
2011-06-28soldstatus $25,000
ⓘ Source: listings_history table (triggers on properties + properties_extension) + one-shot
backfill from property_details.listing_events for pre-trigger history.
Tax reassessment forecast IA · Partial reset (capped growth)
- Current annual tax
- $878 · $73/mo
- Projected year-2 tax
- $1,020 · $85/mo
- Expected delta
- +$142/yr (+$12/mo · 16.2%)
ⓘ Screening estimate from a state-policy table — verify with the county assessor before closing.
Climate risk First Street
- Flood 1/10 Low FEMA zone X (unshaded) · 0% chance over 30 yrs
- Wildfire 4/10 Moderate
- Heat 3/10 Moderate 7 d/yr ≥105°F today · 15 d/yr by 30 yrs out
- Wind 2/10 Low
- Air quality 2/10 Low 1 unhealthy d/yr today · 1 by 30 yrs out
Nearby sold comps map
Loading sold comps map…
Walkable amenities ~0.75 mi
Loading nearby amenities…
Taxation est. · year 1
- Rental income
- $7,800
- − Mortgage interest
- −$4,145
- − Property taxes
- −$878
- − Insurance
- −$370
- − Repairs & maintenance
- −$624
- − Management
- −$624
- − Depreciation
- −$2,153
- Taxable loss
- −$994
- Est. tax savings @ 24.0%
- +$239
- After-tax cash flow
- $496/yr
For passive investors: Depreciation is non-cash, so a rental often shows a tax loss while cash-flowing — sheltering income. Rental losses are passive: they offset passive income freely, and up to $25,000/yr can offset ordinary (W-2) income if you actively participate and your MAGI is under $100k (phasing out to $0 by $150k); unused losses carry forward. On sale, claimed depreciation is recaptured at up to 25%, and gains may owe capital-gains tax (a 1031 exchange can defer both). Figures are a year-1 estimate at your 24.0% rate — not tax advice; consult a CPA.
Schools (NCES district)
- District
- Davis County Community School District
- NCES district ID
- 1908610
- Math proficiency
- 59% ▼ -8.00%
- Reading proficiency
- 63% ▼ -5.00%
- Median HH income
- $48,810
- Composite
- 51.78/100
- National rank
- #1674
- State rank
- #236 of 289 in IA
Livability — Bloomfield
- Score
- 77/100
- State rank
- #159
- US rank
- #2887
Category grades
Schools grade is shown separately in the Schools card above.
Census & demographics
- Census place
- Bloomfield, IA
- Population (ZIP)
- 7,012
Population outlook (Davis County) Hauer SSP2
- Today (2025)
- 8,553 people
- By 2030
- 8,396 · -1.8%
- By 2040
- 8,139 · -4.8%
- By 2050
- 7,799 · -8.8%
- By 2075
- 6,614 · -22.7%
- By 2100
- 5,053 · -40.9%
Race, ethnicity, and origin ACS 2023
- Neighborhood character
- Predominantly White (94%)
- Race & ethnicity
- White 94% Two or more races 3% Hispanic / Latino 2%
- Common ancestry
- Polish 3% Iranian 2% Romanian 1%
- Foreign-born
- 2% · Canada
- Languages at home
- 79% English-only · German/W. Germanic 18% Spanish 3%
Political lean MEDSL · Davis
- 2024 margin
- Solid R (+54.4) · D 22.2% · R 76.6% · Other 1.1%
- 2008→2024 swing
- -45.3pp toward R · 2008: -9.1pp · 2024: -54.4pp
- All cycles
- 2024: R+54.4 2020: R+49.2 2016: R+45.2 2012: R+16.4 2008: R+9.1
Not yet ingested
- Civics
- —
Market trends
- HPI YoY
- ▼ -18.90%
- Current HPI
- 254.7291
- Rent YoY
- —
- Metro
- —
- State GDP YoY
- ▲ 2.48%
- F500 in state
- 4
Industry mix (Fortune 500 HQ in IA)
| Industry | F500 HQs | Revenue |
|---|---|---|
| Financial Services | 1 | $16B |
|
||
| Retail / Convenience | 1 | $15B |
|
||
Price history
+196.0% since first listed8 events — show timeline
- 2026-05-18 Pending — IAR
- 2026-05-11 Price Changed $74,000 IAR
- 2026-04-30 Price Changed $79,000 IAR
- 2026-03-30 Listed $85,000 IAR
- 2024-11-30 Rental Removed $725 APPFOLIO
- 2024-11-20 Listed for Rent $725 APPFOLIO
- 2024-09-18 Sold (Public Records) $35,000 Public Records
- 2011-06-28 Sold (Public Records) $25,000 Public Records
Property tax history
+3.6%/yrLatest (2025): $878 · +5.8% YoY. Source: county tax records.
Cash-flow waterfall
monthlySold comps — $/sqft
last 12 mo · ≤1 miLoading sold comps…