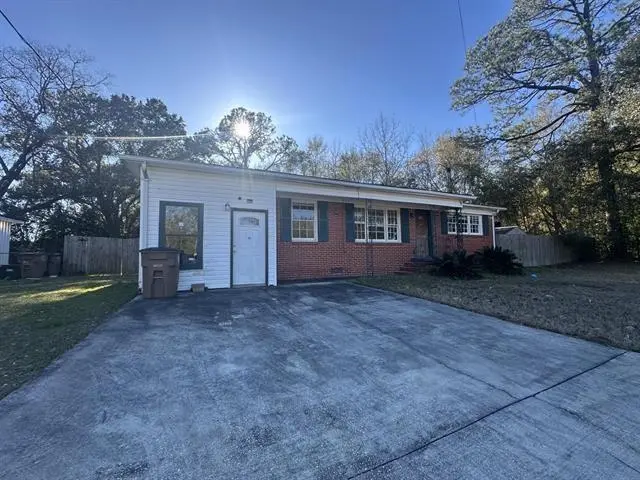
3157 Angus Dr · Mobile, AL
Flood risk 1/10 · Minimal
- FEMA flood zone
- X (unshaded)
- Chance of flooding over 30 yrs
- 0.0%
- Est. flood insurance / yr
- $507 – $1,088
Fire risk 1/10 · Minimal
- Est. fire insurance / yr
- $916 – $1,700
Heat risk 9/10 · Severe
- Hot days now (above 105°F)
- 7 days/yr
- Hot days in 30 yrs
- 20 days/yr
Wind risk 9/10 · Severe
- Chance of severe wind over 30 yrs
- 99.0%
Air-quality risk 2/10 · Minimal
- Unhealthy air days now
- 1 days/yr
- Unhealthy air days in 30 yrs
- 1 days/yr
Risk factors via First Street. Map © Google.
Why this score? — see what drove the C- grade
The composite is a weighted blend of 9 inputs, each scored 0–100. Each bar is that input's sub-score; the figure is the points it added to the 100-point composite (weight × sub-score).
- Cash flow +22.1/30.0
- DSCR +7.1/10.0
- ARV discount +6.1/15.0
- 1% rule +4.7/10.0
- Rent growth +3.8/5.0
- Livability +3.8/5.0
- Condition / age +2.5/5.0
- Schools +2.3/10.0
- Appreciation +0.0/10.0
$139,900
🖨 Deal sheet 📄 Offer letter ✓ Due diligence
Listing remarks MLS
Conveniently located and move-in ready! This 3-bedroom brick home offers comfortable living with updated features, hardwood and tile flooring, a spacious living area, separate dining room, and a large, fenced backyard perfect for outdoor enjoyment. Tucked away on a cul-de-sac lot while still being just minutes from shopping, restaurants, Costco, Target, and McGowin Park. Easy access to Airport Boulevard makes commuting simple while still enjoying the feel of an established neighborhood. A great opportunity for homeowners or investors looking for value and convenience in Mobile. Calling all investors and first-time buyers.
Key facts
- Hardwood flooring
- Spacious living area
- Separate dining room
Tags
Property features AI
Exterior
- Utilities: Public sewer
- Home design: Single-family residential property
- Construction: Above-grade finished living area (1,256)
- Exterior features: Lot dimensions approximately 189.29' x 150' x 43.2' x 123.1'
Interior
- Bedrooms: 3 bedrooms on the main level
- Bathrooms: 1 full bathroom
- Interior features: 8 total rooms
Neighborhood map
What this means for you Summary
Snapshot
- This is a 3-bed/1.0-bath single-family listed at $140k.
Deal economics
- At list price, monthly cash flow is $225 ($3k/yr) — positive.
- The deal already cash-flows at list — no discount required.
- To meet the 1% rule (rent ≥ 1% of price), the offer needs to be $136k (2.8% below list).
- Recommended offer: $136k (2.8% below list) — sets the bar for 1% rule.
- Cap rate 8.2% vs local median 4.9% in Mobile — top-decile yield for the area; either an underpriced asset or a hidden risk that comps aren't pricing in. Stress-test before assuming the spread holds.
Location & tenants
- Location reads 75/100 on livability (#20 in AL, #4,262 nationally) — a middle-class / working-renter tenant base. Strengths: commute A+, cost of living A+, housing A+; Watch: schools D-, crime F, employment D-.
- Mobile County (urban): math 15% / reading 39% proficiency, ranked #81 of 129 in AL (top 63%) — low school quality limits family demand, transient renter base, plan for 1-2y turnover; 67% free/reduced lunch — lower-income household profile, screen leases tightly.
- Market conditions: Rents rising fast (+5.1%/yr); 174 active listings in the ZIP; 29 comparable units currently listed for rent nearby; rentals at typical pace (median 21d on market — plan ~3-4 weeks tenant-placement turnaround); 41% of comp listings sitting > 30 days — soft ceiling on asking rent; 1,678 units permitted in Mobile County in 2024 (264 in 5+ unit buildings).
- This rent runs 32% of the median local income ($51k/yr) — at the standard rent-burdened threshold; future hikes will face affordability resistance.
Forward outlook
- Local home prices are declining (-3.0%/yr); year-one equity from $967 of loan paydown is wiped out by about $4k of value loss. Plan a longer hold.
- Mobile County population projected to shrink 8% by 2050 — rents likely to lag national; underwrite the cash flow, not the appreciation.
Negotiation context
- It's been on market 26 days — a 2% lower offer ($138k) is reasonable based on typical stale-listing flexibility.
- 5 sale attempts since 16y ago with the ask held roughly flat each time — persistent listings suggest the price (not the market) is what's stuck; bring a comps-based counter.
- Current owner paid $32k; list at $140k implies a 333% gain — meaningful room to come down on a strong offer.
Risks & watch-outs
- Climate carrying-cost: severe wind risk, 99% chance of damaging wind over 30y; extreme-heat days projected 7→20/yr by 2055 (HVAC capex compounding) — expect insurance premiums to compound above CPI over the hold.
Questions for the listing agent
- Built in 1979 — when were the roof, HVAC, electrical panel, plumbing, and water heater last replaced?
- Is there a deadline driving the sale (1031 exchange, divorce, estate, relocation)? That informs how much negotiation room exists.
- Schools are D-rated, which usually means shorter tenancies and higher turnover. Who's the typical renter profile here, and what's been the actual vacancy rate?
- Crime grade is F in this area — have there been break-ins, vandalism, or insurance claims at this property in the last 3 years? What carrier currently insures it and at what premium?
- What's the average days-on-market for RENTAL listings here right now (not sales)? A rising rental-DOM trend means longer vacancies and softer asking-rent achievability than the comps imply.
- What's the recent tenant-quality profile in this submarket — average credit score on applications, eviction rate, late-payment / NSF rate, and stable-employment percentage? A property-management company in the area should have these aggregated.
- How much new for-sale + rental construction is in the pipeline within 1–3 miles? Heavy new supply typically softens prices + rents 12–24 months out; constrained supply supports both.
Investment metrics
- 1% rule
- 0.97% ✗
- Cap rate
- 8.22%
- Cash-on-cash
- 6.89%
- DSCR
- 1.31
- GRM
- 8.6
CMA / ARV
- ARV (on-the-fly)
- $135,648
- Comps found
- 12
Show comp detail 12 sales within ~0.75 mi
| Address | Dist | Beds/Ba | Sqft | Sold | Price | $/sf | Match |
|---|---|---|---|---|---|---|---|
| 3011 Westgate St | 0.26mi | 3/1.0 | 1,279 (+2%) | 3mo | $53,000 | $41 | 82 |
| 805 Platt Ave | 0.23mi | 3/2.0 | 1,296 (+3%) | 4mo | $91,000 | $70 | 76 |
| 3161 Joann Ct | 0.25mi | 3/1.5 | 1,249 (-1%) | 13mo | $147,000 | $118 | 75 |
| 960 San Ed Dr | 0.47mi | 3/1.0 | 1,248 (-1%) | 3mo | $75,000 | $60 | 75 |
| 3018 Louise Dr N | 0.33mi | 3/1.0 | 1,253 (-0%) | 12mo | $134,000 | $107 | 74 |
| 604 Janwood Dr | 0.12mi | 3/1.0 | 1,158 (-8%) | 14mo | $167,000 | $144 | 69 |
| 3063 Cottage Hill Rd | 0.32mi | 3/1.0 | 1,150 (-8%) | 5mo | $135,000 | $117 | 67 |
| 3051 Angus Dr S | 0.18mi | 2/1.0 (-1) | 1,075 (-14%) | 3mo | $121,000 | $113 | 60 |
| 3019 Cottage Hill Rd | 0.36mi | 4/2.0 (+1) | 1,225 (-2%) | 12mo | $50,000 | $41 | 60 |
| 966 Delmar Dr | 0.34mi | 4/2.0 (+1) | 1,360 (+8%) | 12mo | $147,000 | $108 | 51 |
| 2904 Cottage Hill Rd | 0.64mi | 3/2.0 | 1,392 (+11%) | 0mo | $124,500 | $89 | 48 |
| 450 Magnolia Rd | 0.70mi | 3/2.0 | 1,440 (+15%) | 9mo | $219,000 | $152 | 32 |
Match score weights: distance 35% · size 25% · config 20% · recency 20%. Top-matched comps best support the ARV.
Projected returns pro-forma
-3.0% appreciation · 5.06% rent growth · sell at horizon
- IRR
- -3.7%
- Equity multiple
- 0.86×
- Total profit
- $-5,522
- Equity at exit
- $20,860
- IRR
- 8.0%
- Equity multiple
- 1.66×
- Total profit
- $25,735
- Equity at exit
- $12,096
Cash invested: $39,172 (down + closing). Projections, not guarantees.
Landlord ↔ Tenant lean methodology
- Overall (STATE)
- 90 Strongly Landlord-Friendly
- State Alabama
- 90 Strongly Landlord-Friendly · R+15
- County
- — inherits STATE
- City
- — inherits STATE
ZIP-level market 36606
- Rents YoY
- 5.1%
- Active inventory
- 174
- Price-to-rent
- 8.6×
Monthly cashflow live
- Estimated rent
- $1,360 high interval (Pro) →
- Mortgage (P&I)
- −$734
- Tax from tax record
- −$57 /mo · $688/yr
- Insurance
- −$58
- HOA
- −$0
- Vacancy / Maint / Mgmt
- −$286
- Net cashflow
- $225
Break-even live
UW: 25.0% down · 7.5% · 30yr · 1.5% tax · 5.0% vac · 8.0% maint · 8.0% mgmt
Financing live
Cash to close
- Down payment
- $34,975
- Closing costs
- $4,197
- Reserves months
- —
- Total cash needed
- —
Loan-product check · same deal, 3 products live
Conventional
25% down · 7.5% · 30yr
- Down + closing
- —
- Monthly P&I
- —
- Monthly cashflow
- —
- DSCR
- —
- Eligible?
- —
Personal DTI + credit; lowest rate.
DSCR
20% down · 8.5% · 30yr
- Down + closing
- —
- Monthly P&I
- —
- Monthly cashflow
- —
- DSCR
- —
- Eligible?
- —
No personal income docs; deal must DSCR.
Hard money
10% down · 12.0% · 12mo
- Down + closing
- —
- Monthly P&I
- —
- Monthly cashflow
- —
- DSCR
- —
- Eligible?
- —
Short-term bridge; refi at stabilization.
Rent comps 29 comps
| Address | Beds | Baths | Sqft | Rent | $/sqft | DOM | Units | Dist |
|---|---|---|---|---|---|---|---|---|
| 3171 Pleasant Valley Rd Mobile, AL | 2.0 | 1.0 | 875 | $800 | $0.91 | 44d | 1 | 0.19mi |
| 916 Delmar Dr Mobile, AL | 3.0 | 1.0 | 1100 | $1,400 | $1.27 | 14d | 1 | 0.27mi |
| 751 Farnell Ln Mobile, AL | 2.0 | 1.0 | 1100 | $1,400 | $1.27 | 44d | 1 | 0.28mi |
| 505 Bel Air Blvd Mobile, AL | 1.0–2.0 | 1.0–2.0 | 976 | $1,274 | $1.30 | 14d | 16 | 0.44mi |
| 461 Magnolia Rd Unit A Mobile, AL | 2.0 | 1.0 | 989 | $825 | $0.83 | 44d | 1 | 0.67mi |
| 3661 Airport Blvd Mobile, AL | 1.0–3.0 | 1.0–2.5 | 1187 | $1,621 | $1.37 | 14d | 24 | 0.84mi |
| 955 Cloverdale Dr Mobile, AL | 3.0 | 1.5 | 1128 | $1,125 | $1.00 | 44d | 1 | 0.92mi |
| 315 Hadrian St Mobile, AL | 3.0 | 2.0 | 1843 | $1,800 | $0.98 | 44d | 1 | 0.94mi |
| 418 Durande Dr Mobile, AL | 3.0 | 2.0 | 1456 | $1,350 | $0.93 | 14d | 1 | 1.00mi |
| 2859 Brierwood Dr Mobile, AL | 3.0 | 1.0 | 1057 | $1,500 | $1.42 | 14d | 1 | 1.06mi |
| 1030 Montlimar Dr Mobile, AL | 1.0–3.0 | 1.0–2.0 | 997 | $1,509 | $1.51 | 14d | 17 | 1.07mi |
| 713 Iris Ave Mobile, AL | 3.0 | 1.0 | 1617 | $1,300 | $0.80 | 21d | 1 | 1.16mi |
| 900 Courtney St Mobile, AL | 2.0 | 1.0 | 1020 | $1,200 | $1.18 | 44d | 1 | 1.17mi |
| 2861 Ralston Rd Mobile, AL | 3.0 | 2.0 | 1617 | $1,650 | $1.02 | 44d | 1 | 1.18mi |
| 2861 Potter Dr Unit 1043844P Mobile, AL | 3.0 | 2.0 | 1496 | $2,492 | $1.67 | 21d | 1 | 1.24mi |
| 2863 Potter Dr Unit 1043693P Mobile, AL | 4.0 | 2.0 | 1496 | $3,049 | $2.04 | 14d | 1 | 1.24mi |
| 2855 Potter Dr Mobile, AL | 2.0 | 1.0 | 1127 | $1,050 | $0.93 | 44d | 1 | 1.24mi |
| 2425 Nortons Ln Unit C Mobile, AL | 2.0 | 1.0 | 1050 | $1,200 | $1.14 | 44d | 1 | 1.31mi |
| 2425 Nortons Ln Unit D Mobile, AL | 2.0 | 1.0 | 1050 | $1,100 | $1.05 | 14d | 1 | 1.31mi |
| 561 Village Green Dr E Mobile, AL | 2.0 | 1.0 | 880 | $1,000 | $1.14 | 14d | 4 | 1.32mi |
| 817 Hawkins St Mobile, AL | 3.0 | 1.0 | 1217 | $1,200 | $0.99 | 44d | 1 | 1.33mi |
| 3060 Emogene St Mobile, AL | 3.0 | 1.0 | 1200 | $1,400 | $1.17 | 14d | 1 | 1.34mi |
| 168 W Collins St Mobile, AL | 3.0 | 1.0 | 968 | $725 | $0.75 | 21d | 1 | 1.35mi |
| 2656 Pathway Pl Mobile, AL | 2.0–3.0 | 1.0 | 778 | $1,261 | $1.62 | 14d | 9 | 1.38mi |
| 120 Paris Ave Mobile, AL | 2.0 | 1.0 | 1054 | $1,150 | $1.09 | 21d | 1 | 1.40mi |
| 150 Dunn Ave Mobile, AL | 3.0 | 2.0 | 1455 | $1,250 | $0.86 | 21d | 1 | 1.41mi |
| 3252 Orleans St Mobile, AL | 2.0 | 1.0 | 900 | $850 | $0.94 | 44d | 1 | 1.44mi |
| 506 Seville Dr Mobile, AL | 3.0 | 1.5 | 1200 | $1,350 | $1.12 | 14d | 1 | 1.46mi |
| 1411 Greenbrier Dr Mobile, AL | 3.0 | 1.0 | 1069 | $995 | $0.93 | 44d | 1 | 1.47mi |
Listing history 27 events
-
2026-06-18days on market $139,900 Active 26 DOM
-
2026-06-17days on market $139,900 Active 25 DOM
-
2026-06-16days on market $139,900 Active 24 DOM
-
2026-06-15days on market $139,900 Active 23 DOM
-
2026-06-14days on market $139,900 Active 21 DOM
-
2026-06-13days on market $139,900 Active 20 DOM
-
2026-06-10days on market $139,900 Active 18 DOM
-
2026-06-09days on market $139,900 Active 17 DOM
-
2026-06-08days on market $139,900 Active 16 DOM
-
2026-06-07days on market $139,900 Active 15 DOM
-
2026-06-05days on market $139,900 Active 12 DOM
-
2026-06-03days on market $139,900 Active 11 DOM
-
2026-06-02days on market $139,900 Active 10 DOM
-
2026-06-01days on market $139,900 Active 9 DOM
-
2026-05-31days on market $139,900 Active 8 DOM
-
2026-05-30days on market $139,900 Active 7 DOM
-
2026-05-21$139,900 Active 629-char remark
Show marketing remark (629 chars)
Conveniently located and move-in ready! This 3-bedroom brick home offers comfortable living with updated features, hardwood and tile flooring, a spacious living area, separate dining room, and a large, fenced backyard perfect for outdoor enjoyment. Tucked away on a cul-de-sac lot while still being just minutes from shopping, restaurants, Costco, Target, and McGowin Park. Easy access to Airport Boulevard makes commuting simple while still enjoying the feel of an established neighborhood. A great opportunity for homeowners or investors looking for value and convenience in Mobile. Calling all investors and first-time buyers.
-
2026-05-19$139,900 Active
-
2025-04-04historical $1,200
-
2025-03-29$1,200
-
2024-03-13historical $1,100
-
2024-03-05price $1,100
-
2024-02-18$1,000
-
2011-04-27soldstatus $32,300 176-char remark
Show marketing remark (176 chars)
This property is located in a convenient area. This three bedroom all brick home is situated on a large lot located on a cul-de-sac. Alabama Right of Redemption Laws may apply.
-
2010-12-29$35,000 176-char remark
Show marketing remark (176 chars)
This property is located in a convenient area. This three bedroom all brick home is situated on a large lot located on a cul-de-sac. Alabama Right of Redemption Laws may apply.
-
2005-02-02soldstatus $79,358
-
2004-10-07soldstatus $115,500
ⓘ Source: listings_history table (triggers on properties + properties_extension) + one-shot
backfill from property_details.listing_events for pre-trigger history.
Tax reassessment forecast AL · Resets to sale price
- Current annual tax
- $688 · $57/mo
- Projected year-2 tax
- $688 · $57/mo
- Expected delta
- $0/yr ($0/mo · 0.0%)
ⓘ Screening estimate from a state-policy table — verify with the county assessor before closing.
Climate risk First Street
- Flood 1/10 Low FEMA zone X (unshaded) · 0% chance over 30 yrs
- Wildfire 1/10 Low
- Heat 9/10 Extreme 7 d/yr ≥105°F today · 20 d/yr by 30 yrs out
- Wind 9/10 Extreme 99% chance of damaging wind over 30 yrs
- Air quality 2/10 Low 1 unhealthy d/yr today · 1 by 30 yrs out
Nearby sold comps map
Loading sold comps map…
Walkable amenities ~0.75 mi
Loading nearby amenities…
Taxation est. · year 1
- Rental income
- $16,317
- − Mortgage interest
- −$7,837
- − Property taxes
- −$688
- − Insurance
- −$700
- − Repairs & maintenance
- −$1,305
- − Management
- −$1,305
- − Depreciation
- −$4,070
- Taxable income
- $412
- Est. tax owed @ 24.0%
- −$99
- After-tax cash flow
- $2,600/yr
For passive investors: Depreciation is non-cash, so a rental often shows a tax loss while cash-flowing — sheltering income. Rental losses are passive: they offset passive income freely, and up to $25,000/yr can offset ordinary (W-2) income if you actively participate and your MAGI is under $100k (phasing out to $0 by $150k); unused losses carry forward. On sale, claimed depreciation is recaptured at up to 25%, and gains may owe capital-gains tax (a 1031 exchange can defer both). Figures are a year-1 estimate at your 24.0% rate — not tax advice; consult a CPA.
Schools (NCES district)
- District
- Mobile County
- NCES district ID
- 0102370
- Math proficiency
- 15% ▼ -28.00%
- Reading proficiency
- 39% ▬ 0.00%
- Median HH income
- $42,455
- Composite
- 22.9/100
- National rank
- #8002
- State rank
- #81 of 129 in AL
Livability — Mobile
- Score
- 75/100
- State rank
- #20
- US rank
- #4262
Category grades
Schools grade is shown separately in the Schools card above.
Census & demographics
- Census place
- Mobile, AL
- County
- Mobile County · 246,577 people
- City population
- 205,729
- Metro
- Mobile, AL
- Population (ZIP)
- 18,728
- Household income
- $51,303
- Rent vs Own
- Severe rent burden
- 999.0
Population outlook (Mobile County) Hauer SSP2
- Today (2025)
- 415,303 people
- By 2030
- 411,755 · -0.9%
- By 2040
- 399,670 · -3.8%
- By 2050
- 382,616 · -7.9%
- By 2075
- 337,353 · -18.8%
- By 2100
- 283,391 · -31.8%
Race, ethnicity, and origin ACS 2023
- Neighborhood character
- Majority Black (56%)
- Race & ethnicity
- Black 56% White 37% Two or more races 5% Hispanic / Latino 4%
- Common ancestry
- Italian 2% Scottish 2% Lithuanian 1%
- Foreign-born
- 3% · Canada
- Languages at home
- 96% English-only · Spanish 3%
Political lean MEDSL · Mobile
- 2024 margin
- R (+16.4) · D 41.3% · R 57.7%
- 2008→2024 swing
- -7.7pp toward R · 2008: -8.7pp · 2024: -16.4pp
- All cycles
- 2024: R+16.4 2020: R+11.9 2016: R+13.9 2012: R+9.3 2008: R+8.7
Not yet ingested
- Civics
- —
Market trends
- HPI YoY
- ▼ -232.19%
- Current HPI
- 145.9025
- Rent YoY
- ▲ 5.06%
- Metro
- Mobile, AL
- State GDP YoY
- ▲ 2.94%
- F500 in state
- 4
Industry mix (Fortune 500 HQ in AL)
| Industry | F500 HQs | Revenue |
|---|---|---|
| Financial Services | 1 | $8B |
|
||
| Healthcare | 1 | $5B |
|
||
Price history
+21.1% since first listed11 events — show timeline
- 2026-05-21 Listed $139,900 GCMLS AL
- 2026-05-19 Listed $139,900 SAARMLS
- 2025-04-04 Rental Removed $1,200 GCMLSAL
- 2025-03-29 Listed for Rent $1,200 GCMLSAL
- 2024-03-13 Rental Removed $1,100 GCMLSAL
- 2024-03-05 Price Changed $1,100 GCMLSAL
- 2024-02-18 Listed for Rent $1,000 GCMLSAL
- 2011-04-27 Sold (MLS) $32,300 BCAR
- 2010-12-29 Listed $35,000 BCAR
- 2005-02-02 Sold (Public Records) $79,358 Public Records
- 2004-10-07 Sold (Public Records) $115,500 Public Records
Property tax history
-1.0%/yrLatest (2025): $688 · +148.3% YoY. Source: county tax records.
Cash-flow waterfall
monthlySold comps — $/sqft
last 12 mo · ≤1 miLoading sold comps…