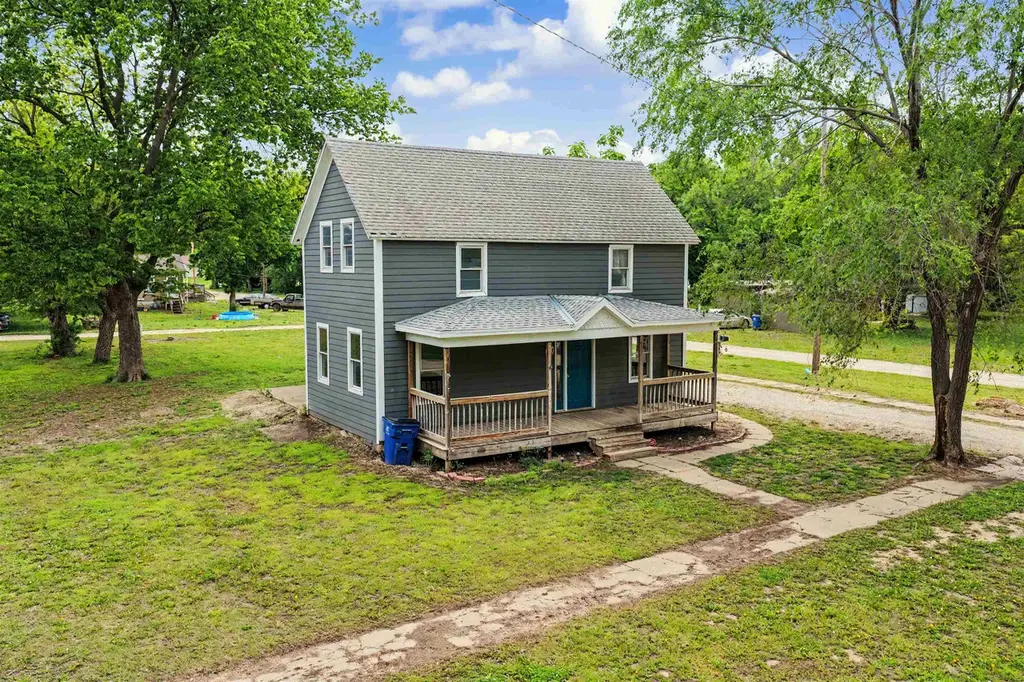
323 King St · Gypsum, KS
Flood risk 5/10 · Moderate
- FEMA flood zone
- X
- Chance of flooding over 30 yrs
- 0.24%
- Est. flood insurance / yr
- $473 – $860
Fire risk 1/10 · Minimal
- Est. fire insurance / yr
- $1,154 – $2,142
Heat risk 5/10 · Moderate
- Hot days now (above 106°F)
- 7 days/yr
- Hot days in 30 yrs
- 17 days/yr
Wind risk 2/10 · Minimal
- Chance of severe wind over 30 yrs
- —
Air-quality risk 2/10 · Minimal
- Unhealthy air days now
- 1 days/yr
- Unhealthy air days in 30 yrs
- 1 days/yr
Risk factors via First Street. Map © Google.
Why this score? — see what drove the D grade
The composite is a weighted blend of 9 inputs, each scored 0–100. Each bar is that input's sub-score; the figure is the points it added to the 100-point composite (weight × sub-score).
- Cash flow +11.4/30.0
- ARV discount +7.5/15.0
- Appreciation +6.5/10.0
- Schools +3.5/10.0
- DSCR +3.4/10.0
- Livability +3.4/5.0
- Rent growth +2.5/5.0
- Condition / age +2.5/5.0
- 1% rule +2.4/10.0
$148,000
🖨 Deal sheet (PDF) 📄 Offer letter ✓ Due diligence
Key facts
- Bonus living area
- Partial basement
- Dining area
Tags
Property features AI
Exterior
- Utilities: Public sewer available
- Home design: Single-family onsite-built home
- Construction: Partial foundation; Composition roof
- Exterior features: Two levels; Partial foundation with no basement windows; Composition roof
Interior
- Kitchen: Refrigerator; Range
- Flooring: Hardwood; Laminate
- Bathrooms: 1 full bathroom
- Heating & cooling: Central air (electric); Forced air heating (natural gas)
- Interior features: Refrigerator; Range
- Laundry & utility: Laundry on main floor
Neighborhood map
What this means for you Summary
Snapshot
- This is a 3-bed/1.0-bath single-family listed at $148k.
Deal economics
- At list price, monthly cash flow is $-50 ($-602/yr) — negative.
- To cash-flow at today's rent, offer at most $139k (6.0% below list).
- To meet the 1% rule (rent ≥ 1% of price), the offer needs to be $109k (26.3% below list).
- Recommended offer: $109k (26.3% below list) — sets the bar for 1% rule.
Location & tenants
- Location reads 67/100 on livability (#246 in KS) — a middle-class / working-renter tenant base. Strengths: cost of living A+, housing A+, health & safety A+; Watch: crime F, amenities F, commute F.
- Southeast Of Saline (rural): math 32% / reading 46% proficiency, ranked #30 of 169 in KS (top 18%) — families likely to look elsewhere, expect single-tenant / working-renter base with shorter leases; only 16% free/reduced lunch — higher-income household profile.
- Zoned schools: Southeast Saline Elem (math 32% / reading 52%, grade F, #273 of 684 statewide, top 45%, 352 students, 26% FRL); Southeast Saline High (math 32% / reading 37%, grade F, #32 of 327 statewide, top 13%, 339 students, 28% FRL).
- Market conditions: 8 active listings in the ZIP; 293 units permitted in Saline County in 2024 (186 in 5+ unit buildings).
Forward outlook
- In year one you build about $5k of equity ($1k loan paydown + $4k appreciation (3.0% local appreciation)).
- Saline County population projected to shrink 9% by 2050 — rents likely to lag national; underwrite the cash flow, not the appreciation.
- At projected returns (3.0% appreciation + 3.0% rent growth), your $41k cash investment doubles in ~7 years — after that, you're playing with house money.
- By year 7, paydown + projected appreciation supports a ~$34k cash-out refi (75% LTV) — recoverable capital for the next deal without selling this one.
Negotiation context
- It's been on market 42 days — a 3% lower offer ($144k) is reasonable based on typical stale-listing flexibility.
- 2 sale attempts with the ask held roughly flat each time — persistent listings suggest the price (not the market) is what's stuck; bring a comps-based counter.
- Current owner paid $60k; list at $148k implies a 147% gain — meaningful room to come down on a strong offer.
Risks & watch-outs
- Watch-outs: built in 1911 — expect roof / HVAC / electrical / plumbing capex.
- Climate carrying-cost: moderate flood risk; extreme-heat days projected 7→17/yr by 2055 (HVAC capex compounding) — expect insurance premiums to compound above CPI over the hold.
Questions for the listing agent
- What do current leases actually rent for vs. the listed asking? Can we see a recent rent roll and the last 12 months of T-12 income?
- It's been on market 42 days. Have you received any prior offers? Is the seller open to a 26% concession, seller financing, or rate buy-down credit?
- Built in 1911 — when were the roof, HVAC, electrical panel, plumbing, and water heater last replaced?
- Is there a deadline driving the sale (1031 exchange, divorce, estate, relocation)? That informs how much negotiation room exists.
- Schools are D-rated, which usually means shorter tenancies and higher turnover. Who's the typical renter profile here, and what's been the actual vacancy rate?
- Crime grade is F in this area — have there been break-ins, vandalism, or insurance claims at this property in the last 3 years? What carrier currently insures it and at what premium?
- The area grade is low — what's the realistic commute time and amenity access for the typical tenant pool here? Any planned neighborhood developments (good or bad) we should know about?
- What's the average days-on-market for RENTAL listings here right now (not sales)? A rising rental-DOM trend means longer vacancies and softer asking-rent achievability than the comps imply.
- What's the recent tenant-quality profile in this submarket — average credit score on applications, eviction rate, late-payment / NSF rate, and stable-employment percentage? A property-management company in the area should have these aggregated.
- How much new for-sale + rental construction is in the pipeline within 1–3 miles? Heavy new supply typically softens prices + rents 12–24 months out; constrained supply supports both.
Investment metrics
- 1% rule
- 0.74% ✗
- Cap rate
- 5.89%
- Cash-on-cash
- -1.45%
- DSCR
- 0.94
- GRM
- 11.3
CMA / ARV
No comps found within radius.
Projected returns pro-forma
2.96% appreciation · 3.0% rent growth · sell at horizon
- IRR
- 6.0%
- Equity multiple
- 1.34×
- Total profit
- $14,242
- Equity at exit
- $66,188
- IRR
- 8.9%
- Equity multiple
- 2.34×
- Total profit
- $55,553
- Equity at exit
- $101,725
Cash invested: $41,440 (down + closing). Projections, not guarantees.
Landlord ↔ Tenant lean methodology
- Overall (STATE)
- 83 Strongly Landlord-Friendly
- State Kansas
- 83 Strongly Landlord-Friendly · R+10
- County
- — inherits STATE
- City
- — inherits STATE
ZIP-level market 67448
- Home prices YoY
- 1.7%
- Active inventory
- 8
- Price-to-rent
- 11.3×
Monthly cashflow live
- Estimated rent
- $1,091 medium interval (Pro) →
- Mortgage (P&I)
- −$776
- Tax from tax record
- −$74 /mo · $889/yr
- Insurance
- −$62
- HOA
- −$0
- Vacancy / Maint / Mgmt
- −$229
- Net cashflow
- $-50
Break-even live
Sensitivity live
| Price | -10% $34 | -5% $-8 | +0% $-50 | +5% $-92 | +10% $-134 |
|---|---|---|---|---|---|
| Rent | -10% $-136 | -5% $-93 | +0% $-50 | +5% $-7 | +10% $36 |
| Rate | -1.0pp $24 | -0.5pp $-13 | base $-50 | +0.5pp $-89 | +1.0pp $-128 |
UW: 25.0% down · 7.5% · 30yr · 1.5% tax · 5.0% vac · 8.0% maint · 8.0% mgmt
Financing live
Cash to close
- Down payment
- $37,000
- Closing costs
- $4,440
- Reserves months
- —
- Total cash needed
- —
Loan-product check · same deal, 3 products live
Conventional
25% down · 7.5% · 30yr
- Down + closing
- —
- Monthly P&I
- —
- Monthly cashflow
- —
- DSCR
- —
- Eligible?
- —
Personal DTI + credit; lowest rate.
DSCR
20% down · 8.5% · 30yr
- Down + closing
- —
- Monthly P&I
- —
- Monthly cashflow
- —
- DSCR
- —
- Eligible?
- —
No personal income docs; deal must DSCR.
Hard money
10% down · 12.0% · 12mo
- Down + closing
- —
- Monthly P&I
- —
- Monthly cashflow
- —
- DSCR
- —
- Eligible?
- —
Short-term bridge; refi at stabilization.
Listing history 23 events
-
2026-06-22days on market $148,000 Active 42 DOM
-
2026-06-21days on market $148,000 Active 41 DOM
-
2026-06-19days on market $148,000 Active 39 DOM
-
2026-06-18days on market $148,000 Active 38 DOM
-
2026-06-17days on market $148,000 Active 37 DOM
-
2026-06-16days on market $148,000 Active 36 DOM
-
2026-06-15days on market $148,000 Active 35 DOM
-
2026-06-14days on market $148,000 Active 33 DOM
-
2026-06-12days on market $148,000 Active 32 DOM
-
2026-06-09days on market $148,000 Active 29 DOM
-
2026-06-08days on market $148,000 Active 28 DOM
-
2026-06-07days on market $148,000 Active 27 DOM
-
2026-06-05days on market $148,000 Active 24 DOM
-
2026-06-02days on market $148,000 Active 22 DOM
-
2026-06-01days on market $148,000 Active 21 DOM
-
2026-05-31days on market $148,000 Active 20 DOM
-
2026-05-30days on market $148,000 Active 19 DOM
-
2026-05-08$148,000 Active
-
2026-05-06historical
-
2026-04-14$148,000 Active
-
2018-12-06soldstatus $60,000
-
2014-12-10soldstatus $28,400
-
2002-05-01soldstatus $11,500
ⓘ Source: listings_history table (triggers on properties + properties_extension) + one-shot
backfill from property_details.listing_events for pre-trigger history.
Tax reassessment forecast KS · Resets to sale price
- Current annual tax
- $889 · $74/mo
- Projected year-2 tax
- $2,087 · $174/mo
- Expected delta
- +$1,198/yr (+$100/mo · 134.9%)
ⓘ Screening estimate from a state-policy table — verify with the county assessor before closing.
Climate risk First Street
- Flood 5/10 Major FEMA zone X · 24% chance over 30 yrs
- Wildfire 1/10 Low
- Heat 5/10 Major 7 d/yr ≥106°F today · 17 d/yr by 30 yrs out
- Wind 2/10 Low
- Air quality 2/10 Low 1 unhealthy d/yr today · 1 by 30 yrs out
Nearby sold comps map
Loading sold comps map…
Walkable amenities ~0.75 mi
Loading nearby amenities…
Taxation est. · year 1
- Rental income
- $13,088
- − Mortgage interest
- −$8,290
- − Property taxes
- −$889
- − Insurance
- −$740
- − Repairs & maintenance
- −$1,047
- − Management
- −$1,047
- − Depreciation
- −$4,305
- Taxable loss
- −$3,230
- Est. tax savings @ 24.0%
- +$775
- After-tax cash flow
- $173/yr
For passive investors: Depreciation is non-cash, so a rental often shows a tax loss while cash-flowing — sheltering income. Rental losses are passive: they offset passive income freely, and up to $25,000/yr can offset ordinary (W-2) income if you actively participate and your MAGI is under $100k (phasing out to $0 by $150k); unused losses carry forward. On sale, claimed depreciation is recaptured at up to 25%, and gains may owe capital-gains tax (a 1031 exchange can defer both). Figures are a year-1 estimate at your 24.0% rate — not tax advice; consult a CPA.
Schools (NCES district)
- District
- Southeast Of Saline
- NCES district ID
- 2000001
- Math proficiency
- 32% ▬ 0.00%
- Reading proficiency
- 46% ▲ 8.00%
- Median HH income
- $60,069
- Composite
- 34.57/100
- National rank
- #5168
- State rank
- #30 of 169 in KS
Livability — Gypsum
- Score
- 67/100
- State rank
- #246
- US rank
- #10961
Category grades
Schools grade is shown separately in the Schools card above.
Census & demographics
- Census place
- Gypsum, KS
- Population (ZIP)
- 1,123
Population outlook (Saline County) Hauer SSP2
- Today (2025)
- 55,099 people
- By 2030
- 54,446 · -1.2%
- By 2040
- 52,572 · -4.6%
- By 2050
- 50,362 · -8.6%
- By 2075
- 45,522 · -17.4%
- By 2100
- 40,059 · -27.3%
Race, ethnicity, and origin ACS 2023
- Neighborhood character
- Predominantly White (92%)
- Race & ethnicity
- White 92% Two or more races 6% Hispanic / Latino 4%
- Common ancestry
- Portuguese 3% Slovak 3% Lithuanian 2%
- Foreign-born
- 0%
Political lean MEDSL · Saline
- 2024 margin
- Solid R (+31.6) · D 33.3% · R 64.9% · Other 1.8%
- 2008→2024 swing
- -5.3pp toward R · 2008: -26.2pp · 2024: -31.6pp
- All cycles
- 2024: R+31.6 2020: R+30.5 2016: R+34.3 2012: R+32.2 2008: R+26.2
Not yet ingested
- Civics
- —
Market trends
- HPI YoY
- ▲ 2.96%
- Current HPI
- 178.4887
- Rent YoY
- —
- Metro
- —
- State GDP YoY
- —
- F500 in state
- 0
Price history
+1187.0% since first listed6 events — show timeline
- 2026-05-08 Listed $148,000 SCKMLS as Distributed by MLS Grid
- 2026-05-06 Listing Removed — SCKMLS as Distributed by MLS Grid
- 2026-04-14 Listed $148,000 SCKMLS as Distributed by MLS Grid
- 2018-12-06 Sold (Public Records) $60,000 Public Records
- 2014-12-10 Sold (Public Records) $28,400 Public Records
- 2002-05-01 Sold (Public Records) $11,500 Public Records
Property tax history
+9.5%/yrLatest (2025): $889 · +8.6% YoY. Source: county tax records.
Cash-flow waterfall
monthlySold comps — $/sqft
last 12 mo · ≤1 miLoading sold comps…