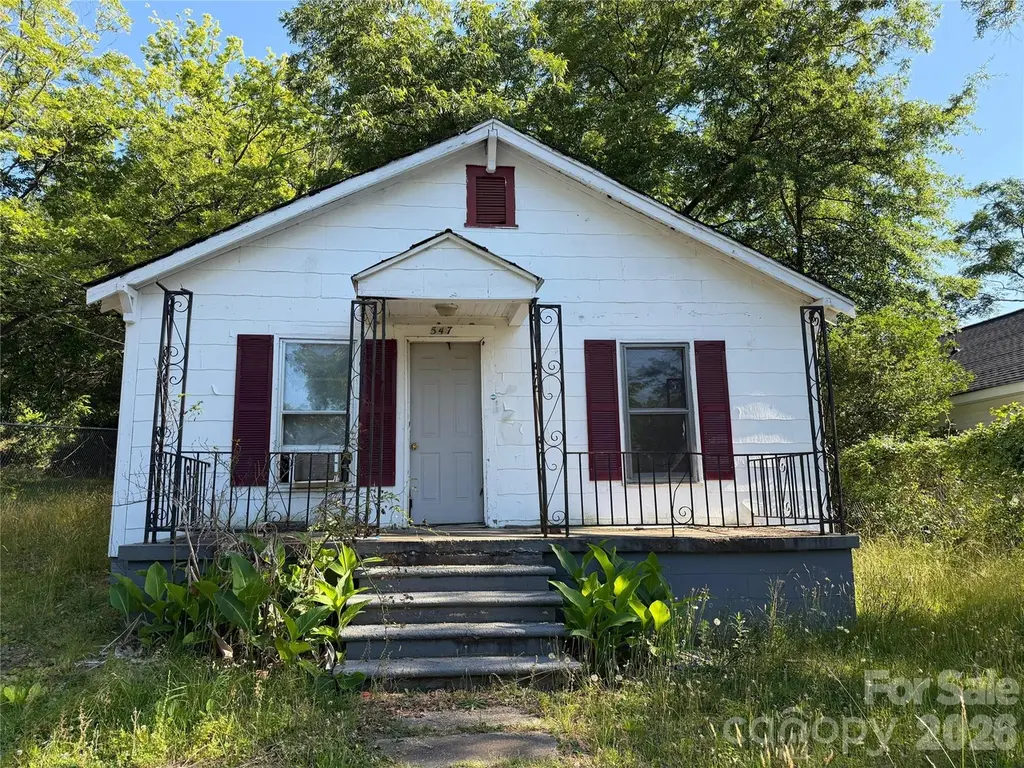
547 S Center St · Spartanburg, SC
Flood risk 1/10 · Minimal
- FEMA flood zone
- X (unshaded)
- Chance of flooding over 30 yrs
- 0.0%
- Est. flood insurance / yr
- $507 – $1,088
Fire risk 1/10 · Minimal
- Est. fire insurance / yr
- $783 – $1,453
Heat risk 5/10 · Moderate
- Hot days now (above 105°F)
- 7 days/yr
- Hot days in 30 yrs
- 15 days/yr
Wind risk 2/10 · Minimal
- Chance of severe wind over 30 yrs
- 2.0%
Air-quality risk 4/10 · Minor
- Unhealthy air days now
- 4 days/yr
- Unhealthy air days in 30 yrs
- 4 days/yr
Risk factors via First Street. Map © Google.
Why this score? — see what drove the B- grade
The composite is a weighted blend of 9 inputs, each scored 0–100. Each bar is that input's sub-score; the figure is the points it added to the 100-point composite (weight × sub-score).
- Cash flow +30.0/30.0
- 1% rule +10.0/10.0
- DSCR +10.0/10.0
- ARV discount +7.5/15.0
- Livability +3.8/5.0
- Schools +3.1/10.0
- Condition / age +2.5/5.0
- Rent growth +1.8/5.0
- Appreciation +0.0/10.0
$39,900
🖨 Deal sheet 📄 Offer letter ✓ Due diligence
Listing remarks
PLEASE SUBMIT BEST AND HIGHEST OFFER BY MONDAY, JUNE 15!!!! Investor special with strong potential in Spartanburg! This property is being sold strictly as-is, where-is, and offers an excellent opportunity for investors, renovators, or buyers looking for a value-add project. Conveniently located near downtown Spartanburg, local shopping, dining, schools, and major roadways. The home and property will require repairs, cleanup, and improvements, allowing the next owner to customize it according to their vision. Seller will not make repairs or provide concessions. Buyers and agents should perform all inspections and due diligence prior to submitting an offer. Bring your ideas and take advantag
Key facts
- 6,098 sq ft lot
- Built 1920
- Listed 11 days
Property features AI
Finance
- Other: Zoning: 6RGR
- HOA & community: No HOA
Exterior
- Parking: Driveway
- Utilities: City water; Public sewer
- Home design: Single-family residence; One level (single story); Site-built construction
- Construction: Vinyl and wood exterior materials; Asbestos shingle roof; Crawl space foundation; Built on-site (site built)
- Exterior features: Gravel and paved road access; Publicly maintained road
Interior
- Kitchen: No appliances listed
- Bedrooms: 1 bedroom on the main level
- Bathrooms: 1 full bathroom on the main level
- Heating & cooling: Wall furnace heating; Window unit(s) for cooling
- Interior features: Two total rooms; No built-in appliances listed
- Laundry & utility: No laundry facilities listed
Neighborhood map
What this means for you Summary
Snapshot
- This is a 3-bed/1.0-bath single-family listed at $40k.
Deal economics
- At list price, monthly cash flow is $802 ($10k/yr) — positive.
- The deal already cash-flows at list — no discount required.
- Meets the 1% rule at list price ($1k rent vs $40k).
- Cap rate 30.4% vs local median 3.9% in Spartanburg — top-decile yield for the area; either an underpriced asset or a hidden risk that comps aren't pricing in. Stress-test before assuming the spread holds.
Location & tenants
- Location reads 76/100 on livability (#24 in SC, #3,679 nationally) — a middle-class / working-renter tenant base. Strengths: amenities A+, commute A+, cost of living A+; Watch: crime F, employment F.
- Spartanburg 07 (urban): math 34% / reading 41% proficiency, ranked #39 of 80 in SC (top 49%) — families likely to look elsewhere, expect single-tenant / working-renter base with shorter leases; 62% free/reduced lunch — lower-income household profile, screen leases tightly.
- Zoned schools: Spartanburg High (math 67% / reading 79%, grade B+, #44 of 196 statewide, top 23%, 2,056 students, 85% FRL) — zoned schools average 85% FRL vs 62% district-wide (24 pts higher); higher-poverty schools than district average — tighter screening recommended.
- Zoned-school proficiency averages 73% at this address vs 38% district-wide (+36 pts) — the actual schools serving this property are materially stronger than the Spartanburg 07 average implies; a family-tenant draw the district grade alone would hide.
- Market conditions: Rents soft (-2.6%/yr); 466 active listings in the ZIP; 17 comparable units currently listed for rent nearby; rentals at typical pace (median 21d on market — plan ~3-4 weeks tenant-placement turnaround); 3,129 units permitted in Spartanburg County in 2024 (40 in 5+ unit buildings).
Forward outlook
- Local home prices are declining (-3.0%/yr); year-one equity from $276 of loan paydown is wiped out by about $1k of value loss. Plan a longer hold.
- Spartanburg County population projected at +18% by 2050 — long-run rental-demand tailwind backs the buy-and-hold thesis.
- At projected returns (-3.0% appreciation + 0.0% rent growth), your $11k cash investment doubles in ~2 years — after that, you're playing with house money.
Negotiation context
- Only 11 days on market — expect competitive offers; lowballing is unlikely to land.
- Current owner paid $6k; list at $40k implies a 565% gain — meaningful room to come down on a strong offer.
Risks & watch-outs
- Watch-outs: built in 1920 — expect roof / HVAC / electrical / plumbing capex.
- Climate carrying-cost: extreme-heat days projected 7→15/yr by 2055 (HVAC capex compounding) — expect insurance premiums to compound above CPI over the hold.
Questions for the listing agent
- Built in 1920 — when were the roof, HVAC, electrical panel, plumbing, and water heater last replaced?
- Is there a deadline driving the sale (1031 exchange, divorce, estate, relocation)? That informs how much negotiation room exists.
- Schools are D-rated, which usually means shorter tenancies and higher turnover. Who's the typical renter profile here, and what's been the actual vacancy rate?
- Crime grade is F in this area — have there been break-ins, vandalism, or insurance claims at this property in the last 3 years? What carrier currently insures it and at what premium?
- What's the average days-on-market for RENTAL listings here right now (not sales)? A rising rental-DOM trend means longer vacancies and softer asking-rent achievability than the comps imply.
- What's the recent tenant-quality profile in this submarket — average credit score on applications, eviction rate, late-payment / NSF rate, and stable-employment percentage? A property-management company in the area should have these aggregated.
- How much new for-sale + rental construction is in the pipeline within 1–3 miles? Heavy new supply typically softens prices + rents 12–24 months out; constrained supply supports both.
Investment metrics
- 1% rule
- 3.46% ✓
- Cap rate
- 30.42%
- Cash-on-cash
- 86.16%
- DSCR
- 4.83
- GRM
- 2.4
CMA / ARV
- ARV (on-the-fly)
- $174,525
- Comps found
- 12
Show comp detail 12 sales within ~0.75 mi
| Address | Dist | Beds/Ba | Sqft | Sold | Price | $/sf | Match |
|---|---|---|---|---|---|---|---|
| 656 S Center St | 0.31mi | 3/1.0 | 975 (0%) | 0mo | $60,000 | $62 | 85 |
| 105 Westmoreland St | 0.65mi | 3/1.0 | 988 (+1%) | 2mo | $177,000 | $179 | 66 |
| 318 Austin St | 0.22mi | 2/2.0 (-1) | 1,026 (+5%) | 12mo | $145,000 | $141 | 62 |
| 103 Anderson St | 0.63mi | 3/2.0 | 1,000 (+3%) | 5mo | $208,000 | $208 | 58 |
| 438 Arch St | 0.11mi | 3/2.0 | 1,100 (+13%) | 15mo | $200,000 | $182 | 57 |
| 211 Edenbridge Ln | 0.62mi | 3/1.0 | 1,050 (+8%) | 2mo | $189,000 | $180 | 57 |
| 437 Arch St | 0.13mi | 3/2.0 | 1,100 (+13%) | 14mo | $211,000 | $192 | 57 |
| 776 Wofford St | 0.35mi | 3/1.0 | 850 (-13%) | 7mo | $95,000 | $112 | 56 |
| 760 Wofford St | 0.31mi | 3/1.0 | 840 (-14%) | 12mo | $154,500 | $184 | 52 |
| 3 Jordan St | 0.74mi | 3/1.0 | 955 (-2%) | 13mo | $100,000 | $105 | 51 |
| 784 Wofford St | 0.37mi | 3/1.0 | 840 (-14%) | 13mo | $98,500 | $117 | 49 |
| 779 Saxon Ave | 0.52mi | 2/1.0 (-1) | 1,111 (+14%) | 3mo | $115,000 | $104 | 45 |
Match score weights: distance 35% · size 25% · config 20% · recency 20%. Top-matched comps best support the ARV.
Projected returns pro-forma
-3.0% appreciation · 0.0% rent growth · sell at horizon
- IRR
- 83.2%
- Equity multiple
- 4.63×
- Total profit
- $40,602
- Equity at exit
- $5,949
- IRR
- 85.8%
- Equity multiple
- 8.66×
- Total profit
- $85,604
- Equity at exit
- $3,450
Cash invested: $11,172 (down + closing). Projections, not guarantees.
Landlord ↔ Tenant lean methodology
- Overall (STATE)
- 90 Strongly Landlord-Friendly
- State South Carolina
- 90 Strongly Landlord-Friendly · R+6
- County
- — inherits STATE
- City
- — inherits STATE
ZIP-level market 29301
- Home prices YoY
- -25.3%
- Rents YoY
- -2.6%
- Active inventory
- 466
- Price-to-rent
- 2.4×
Monthly cashflow live
- Estimated rent
- $1,383 high interval (Pro) →
- Mortgage (P&I)
- −$209
- Tax from tax record
- −$64 /mo · $770/yr
- Insurance
- −$17
- HOA
- −$0
- Vacancy / Maint / Mgmt
- −$290
- Net cashflow
- $802
Break-even live
UW: 25.0% down · 7.5% · 30yr · 1.5% tax · 5.0% vac · 8.0% maint · 8.0% mgmt
Financing live
Cash to close
- Down payment
- $9,975
- Closing costs
- $1,197
- Reserves months
- —
- Total cash needed
- —
Loan-product check · same deal, 3 products live
Conventional
25% down · 7.5% · 30yr
- Down + closing
- —
- Monthly P&I
- —
- Monthly cashflow
- —
- DSCR
- —
- Eligible?
- —
Personal DTI + credit; lowest rate.
DSCR
20% down · 8.5% · 30yr
- Down + closing
- —
- Monthly P&I
- —
- Monthly cashflow
- —
- DSCR
- —
- Eligible?
- —
No personal income docs; deal must DSCR.
Hard money
10% down · 12.0% · 12mo
- Down + closing
- —
- Monthly P&I
- —
- Monthly cashflow
- —
- DSCR
- —
- Eligible?
- —
Short-term bridge; refi at stabilization.
Rent comps 17 comps
| Address | Beds | Baths | Sqft | Rent | $/sqft | DOM | Units | Dist |
|---|---|---|---|---|---|---|---|---|
| 694 Saxon Ave Spartanburg, SC | 3.0 | 1.0 | 1014 | $1,300 | $1.28 | 21d | 1 | 0.51mi |
| 500 Howard St Spartanburg, SC | 1.0–3.0 | 1.0–2.0 | 999 | $1,650 | $1.65 | 13d | 1 | 0.55mi |
| 560 Magnolia St Spartanburg, SC | 2.0 | 1.0 | 965 | $1,113 | $1.15 | 21d | 1 | 0.70mi |
| 131 College St Spartanburg, SC | 2.0 | 1.0 | 700 | $1,195 | $1.71 | 21d | 1 | 0.74mi |
| 321 Southstar St Spartanburg, SC | 2.0 | 1.0 | 895 | $849 | $0.95 | 21d | 1 | 0.88mi |
| 100 Vanderbilt Ln Spartanburg, SC | 1.0–2.0 | 1.0–2.0 | 787 | $1,195 | $1.52 | 21d | 1 | 0.88mi |
| 317 Southstar St Spartanburg, SC | 2.0 | 1.0 | 895 | $849 | $0.95 | 21d | 1 | 0.88mi |
| 142 Magnolia St Unit 301 Spartanburg, SC | 2.0 | 2.0 | 937 | $1,850 | $1.97 | 21d | 1 | 0.92mi |
| 334 W Hampton Ave Unit 1 Spartanburg, SC | 2.0 | 1.0 | 895 | $1,100 | $1.23 | 21d | 1 | 1.12mi |
| 201 N Liberty St Spartanburg, SC | 3.0 | 1.0–2.0 | 1153 | $2,330 | $2.02 | 13d | 32 | 1.13mi |
| 111 Timothy St Spartanburg, SC | 2.0 | 1.0 | 1100 | $1,600 | $1.45 | 21d | 1 | 1.16mi |
| 174 E Main St Spartanburg, SC | 1.0–2.0 | 1.0–2.0 | 760 | $2,295 | $3.02 | 13d | 8 | 1.18mi |
| 408 Abner Rd Spartanburg, SC | 2.0–3.0 | 2.0 | 996 | $1,515 | $1.52 | 21d | 6 | 1.30mi |
| 118 Morningside Dr Spartanburg, SC | 2.0 | 1.0 | 800 | $850 | $1.06 | 21d | 1 | 1.39mi |
| 116 Morningside Dr Spartanburg, SC | 2.0 | 1.0 | 800 | $850 | $1.06 | 21d | 1 | 1.40mi |
| 300 Amherst Dr Spartanburg, SC | 2.0 | 1.0 | 763 | $975 | $1.28 | 13d | 1 | 1.49mi |
| 327 E Kennedy St Spartanburg, SC | 1.0–2.0 | 1.0–2.0 | 806 | $1,654 | $2.05 | 13d | 7 | 1.50mi |
Listing history 10 events
-
2026-06-16status $39,900 Pending 11 DOM
-
2026-06-16days on market $39,900 Active 11 DOM
-
2026-06-15days on market $39,900 Active 10 DOM
-
2026-06-14days on market $39,900 Active 8 DOM
-
2026-06-13days on market $39,900 Active 7 DOM
-
2026-06-10days on market $39,900 Active 5 DOM
-
2026-06-09days on market $39,900 Active 4 DOM
-
2026-06-08days on market $39,900 Active 3 DOM
-
2026-06-07remarks 699-char remark
-
2026-06-07$39,900 Active 2 DOM
ⓘ Source: listings_history table (triggers on properties + properties_extension) + one-shot
backfill from property_details.listing_events for pre-trigger history.
Tax reassessment forecast SC · Resets to sale price
- Current annual tax
- $770 · $64/mo
- Projected year-2 tax
- $770 · $64/mo
- Expected delta
- $0/yr ($0/mo · 0.0%)
ⓘ Screening estimate from a state-policy table — verify with the county assessor before closing.
Climate risk First Street
- Flood 1/10 Low FEMA zone X (unshaded) · 0% chance over 30 yrs
- Wildfire 1/10 Low
- Heat 5/10 Major 7 d/yr ≥105°F today · 15 d/yr by 30 yrs out
- Wind 2/10 Low 2% chance of damaging wind over 30 yrs
- Air quality 4/10 Moderate 4 unhealthy d/yr today · 4 by 30 yrs out
Nearby sold comps map
Loading sold comps map…
Walkable amenities ~0.75 mi
Loading nearby amenities…
Taxation est. · year 1
- Rental income
- $16,590
- − Mortgage interest
- −$2,235
- − Property taxes
- −$770
- − Insurance
- −$200
- − Repairs & maintenance
- −$1,327
- − Management
- −$1,327
- − Depreciation
- −$1,161
- Taxable income
- $9,571
- Est. tax owed @ 24.0%
- −$2,297
- After-tax cash flow
- $7,329/yr
For passive investors: Depreciation is non-cash, so a rental often shows a tax loss while cash-flowing — sheltering income. Rental losses are passive: they offset passive income freely, and up to $25,000/yr can offset ordinary (W-2) income if you actively participate and your MAGI is under $100k (phasing out to $0 by $150k); unused losses carry forward. On sale, claimed depreciation is recaptured at up to 25%, and gains may owe capital-gains tax (a 1031 exchange can defer both). Figures are a year-1 estimate at your 24.0% rate — not tax advice; consult a CPA.
Schools (NCES district)
- District
- Spartanburg 07
- NCES district ID
- 4503660
- Math proficiency
- 34% ▼ -1.00%
- Reading proficiency
- 41% ▼ -1.00%
- Median HH income
- $35,825
- Composite
- 31.04/100
- National rank
- #6087
- State rank
- #39 of 80 in SC
Livability — Spartanburg
- Score
- 76/100
- State rank
- #24
- US rank
- #3679
Category grades
Schools grade is shown separately in the Schools card above.
Census & demographics
- Census place
- Spartanburg, SC
- County
- Spartanburg County · 258,607 people
- City population
- 120,406
- Metro
- Spartanburg, SC
- Population (ZIP)
- 36,278
- Household income
- $57,805
- Rent vs Own
- Severe rent burden
- 1331.0
Population outlook (Spartanburg County) Hauer SSP2
- Today (2025)
- 325,495 people
- By 2030
- 338,800 · +4.1%
- By 2040
- 363,471 · +11.7%
- By 2050
- 384,156 · +18.0%
- By 2075
- 430,137 · +32.1%
- By 2100
- 442,733 · +36.0%
Race, ethnicity, and origin ACS 2023
- Neighborhood character
- Diverse neighborhood (Simpson 0.67)
- Race & ethnicity
- White 45% Black 32% Hispanic / Latino 13% Two or more races 9% Asian 5%
- Hispanic origin (detail)
- Mexican 7% Puerto Rican 2%
- Common ancestry
- Slovak 2% Lithuanian 1% Italian 1%
- Foreign-born
- 12% · Canada, China, Vietnam
- Languages at home
- 83% English-only · Spanish 10% Other Indo-European 3% Other Asian/Pacific 1%
Political lean MEDSL · Spartanburg
- 2024 margin
- Solid R (+33.6) · D 32.6% · R 66.2% · Other 1.2%
- 2008→2024 swing
- -12.0pp toward R · 2008: -21.6pp · 2024: -33.6pp
- All cycles
- 2024: R+33.6 2020: R+27.3 2016: R+30.0 2012: R+23.1 2008: R+21.6
Not yet ingested
- Civics
- —
Market trends
- HPI YoY
- ▼ -77.19%
- Current HPI
- 228.4172
- Rent YoY
- ▼ -2.64%
- Metro
- Spartanburg, SC
- State GDP YoY
- ▲ 4.51%
- F500 in state
- 2
Industry mix (Fortune 500 HQ in SC)
| Industry | F500 HQs | Revenue |
|---|---|---|
| Packaging | 1 | $7B |
|
||
Price history
+565.0% since first listed2 events — show timeline
- 2026-06-05 Listed $39,900 CANOPYMLS as Distributed by MLS Grid
- 1995-11-01 Sold (Public Records) $6,000 Public Records
Property tax history
+2.2%/yrLatest (2025): $770 · +1.5% YoY. Source: county tax records.
Cash-flow waterfall
monthlySold comps — $/sqft
last 12 mo · ≤1 miLoading sold comps…