134 Plumeria Dr · Mustang Ridge, TX
Flood risk 1/10 · Minimal
- FEMA flood zone
- X (unshaded)
- Chance of flooding over 30 yrs
- 0.0%
- Est. flood insurance / yr
- $507 – $1,088
Fire risk 5/10 · Moderate
- Est. fire insurance / yr
- $1,222 – $2,270
Heat risk 8/10 · Major
- Hot days now (above 108°F)
- 7 days/yr
- Hot days in 30 yrs
- 20 days/yr
Wind risk 8/10 · Major
- Chance of severe wind over 30 yrs
- 80.0%
Air-quality risk 1/10 · Minimal
- Unhealthy air days now
- 0 days/yr
- Unhealthy air days in 30 yrs
- 0 days/yr
Risk factors via First Street. Map © Google.
Why this score? — see what drove the D+ grade
The composite is a weighted blend of 9 inputs, each scored 0–100. Each bar is that input's sub-score; the figure is the points it added to the 100-point composite (weight × sub-score).
- ARV discount +15.0/15.0
- Appreciation +10.0/10.0
- Cash flow +7.9/30.0
- Livability +3.2/5.0
- Rent growth +2.5/5.0
- Condition / age +2.5/5.0
- Schools +2.4/10.0
- 1% rule +2.3/10.0
- DSCR +2.0/10.0
$264,900
🖨 Deal sheet 📄 Offer letter ✓ Due diligence
Listing remarks MLS
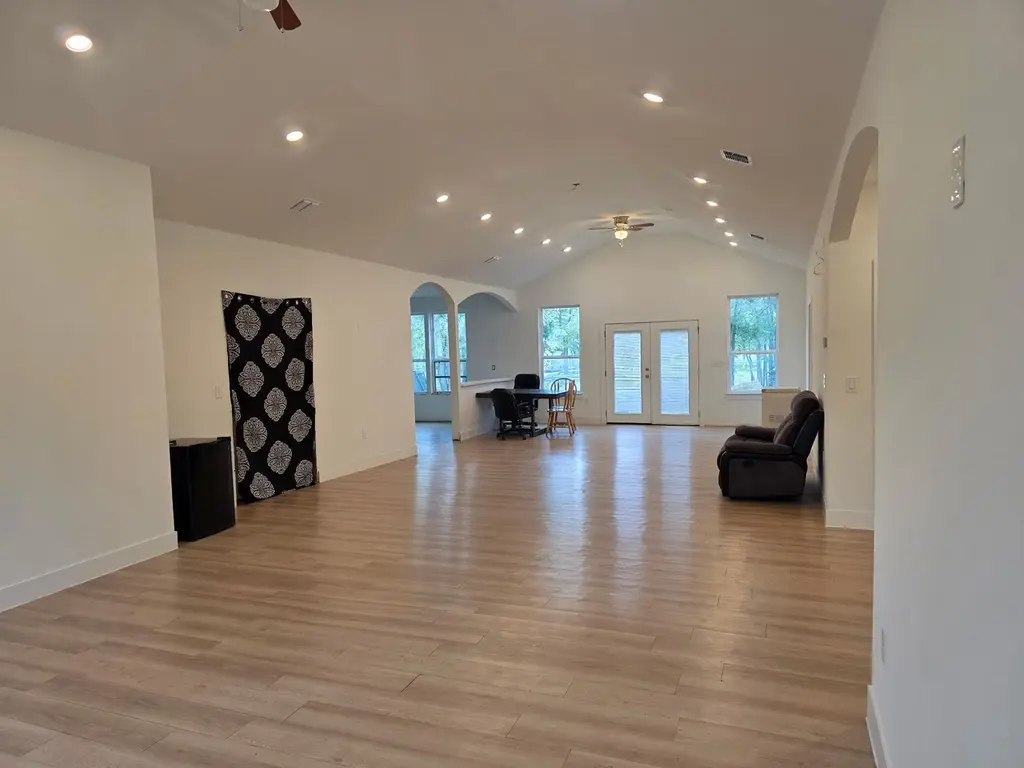
Endless Potential in a Welcoming Community Nestled in the inviting residential neighborhood of 134 Plumeria Dr, Dale, TX 78616, this 2023-built home offers a rare opportunity to create something truly special. Featuring four spacious bedrooms and two full bathrooms, the layout is designed with comfort and livability in mind. While the home is not yet fully complete, its prime location and solid foundation provide the perfect canvas for customization. Whether you're a visionary homeowner or an investor with an eye for potential, this property is ready to become a place where lasting memories are made. Price was adjusted due to more complete home, ad lighting, exterior paint and faucets
Key facts
- Solid foundation
- 0.33 acre lot
- 7 parking spots
Tags
Neighborhood map
What this means for you Summary
Snapshot
- This is a 4-bed/2.0-bath single-family listed at $265k.
Deal economics
- At list price, monthly cash flow is $-277 ($-3k/yr) — negative.
- To cash-flow at today's rent, offer at most $216k (18.5% below list).
- To meet the 1% rule (rent ≥ 1% of price), the offer needs to be $194k (26.6% below list).
- Recommended offer: $194k (26.6% below list) — sets the bar for 1% rule.
Location & tenants
- Location reads 63/100 on livability (#854 in TX) — a middle-class / working-renter tenant base. Strengths: crime A+, employment A+, cost of living A+; Watch: schools F, amenities F, commute F.
- Bastrop ISD (rural): math 25% / reading 28% proficiency, ranked #670 of 826 in TX (top 81%) — low school quality limits family demand, transient renter base, plan for 1-2y turnover; 62% free/reduced lunch — lower-income household profile, screen leases tightly.
- Market conditions: 203 active listings in the ZIP; 2 comparable units currently listed for rent nearby; 1,841 units permitted in Bastrop County in 2024 (150 in 5+ unit buildings).
Forward outlook
- In year one you build about $28k of equity ($2k loan paydown + $26k appreciation (10.0% local appreciation)).
- Bastrop County population projected at +37% by 2050 — long-run rental-demand tailwind backs the buy-and-hold thesis.
- By year 2, paydown + projected appreciation supports a ~$46k cash-out refi (75% LTV) — recoverable capital for the next deal without selling this one.
Negotiation context
- It's been on market 308 days — a 12% lower offer ($233k) is reasonable based on typical stale-listing flexibility.
- 6 sale attempts since 3y ago; this cycle's ask is 8% above the opening price — seller raised mid-cycle; expect resistance to lowballs.
Risks & watch-outs
- Climate carrying-cost: severe wind risk, 80% chance of damaging wind over 30y; moderate wildfire risk; extreme-heat days projected 7→20/yr by 2055 (HVAC capex compounding) — expect insurance premiums to compound above CPI over the hold.
Questions for the listing agent
- What do current leases actually rent for vs. the listed asking? Can we see a recent rent roll and the last 12 months of T-12 income?
- It's been on market 308 days. Have you received any prior offers? Is the seller open to a 27% concession, seller financing, or rate buy-down credit?
- Why hasn't it sold? Are there any deal-killer items the seller is aware of (foundation, flood, title, zoning, code violations)?
- Is there a deadline driving the sale (1031 exchange, divorce, estate, relocation)? That informs how much negotiation room exists.
- Schools are F-rated, which usually means shorter tenancies and higher turnover. Who's the typical renter profile here, and what's been the actual vacancy rate?
- The area grade is low — what's the realistic commute time and amenity access for the typical tenant pool here? Any planned neighborhood developments (good or bad) we should know about?
- What's the average days-on-market for RENTAL listings here right now (not sales)? A rising rental-DOM trend means longer vacancies and softer asking-rent achievability than the comps imply.
- What's the recent tenant-quality profile in this submarket — average credit score on applications, eviction rate, late-payment / NSF rate, and stable-employment percentage? A property-management company in the area should have these aggregated.
- How much new for-sale + rental construction is in the pipeline within 1–3 miles? Heavy new supply typically softens prices + rents 12–24 months out; constrained supply supports both.
Investment metrics
- 1% rule
- 0.73% ✗
- Cap rate
- 5.04%
- Cash-on-cash
- -4.48%
- DSCR
- 0.80
- GRM
- 11.4
CMA / ARV
- ARV (median comp)
- $440,630
- List price
- $264,900
- Delta
- -39.88%
- Verdict
- UNDERPRICED
- Comps
- 20 within 1.0 mi
Show comp detail 4 sales within ~0.75 mi
| Address | Dist | Beds/Ba | Sqft | Sold | Price | $/sf | Match |
|---|---|---|---|---|---|---|---|
| 120 Plumeria Dr | 0.06mi | 4/2.5 | 2,284 (+8%) | 5mo | $359,000 | $157 | 78 |
| 108 Sunflower Rd | 0.15mi | 3/2.5 (-1) | 2,171 (+3%) | 11mo | $369,000 | $170 | 73 |
| 128 Passion Vine Rd | 0.17mi | 3/2.5 (-1) | 2,300 (+9%) | 3mo | $325,000 | $141 | 68 |
| 114 Pineapple Sage Cv | 0.62mi | 5/2.0 (+1) | 2,040 (-4%) | 10mo | $320,599 | $157 | 52 |
Match score weights: distance 35% · size 25% · config 20% · recency 20%. Top-matched comps best support the ARV.
Projected returns pro-forma
10.0% appreciation · 3.0% rent growth · sell at horizon
- IRR
- 21.1%
- Equity multiple
- 2.71×
- Total profit
- $126,650
- Equity at exit
- $238,643
- IRR
- 19.1%
- Equity multiple
- 6.22×
- Total profit
- $386,872
- Equity at exit
- $514,642
Cash invested: $74,172 (down + closing). Projections, not guarantees.
Landlord ↔ Tenant lean methodology
- Overall (STATE)
- 87 Strongly Landlord-Friendly
- State Texas
- 87 Strongly Landlord-Friendly · R+5
- County
- — inherits STATE
- City
- — inherits STATE
ZIP-level market 78616
- Home prices YoY
- 4.8%
- Active inventory
- 203
- Price-to-rent
- 11.4×
Monthly cashflow live
- Estimated rent
- $1,945 medium interval (Pro) →
- Mortgage (P&I)
- −$1,389
- Tax from tax record
- −$314 /mo · $3,764/yr
- Insurance
- −$110
- HOA
- −$0
- Vacancy / Maint / Mgmt
- −$408
- Net cashflow
- $-277
Break-even live
UW: 25.0% down · 7.5% · 30yr · 1.5% tax · 5.0% vac · 8.0% maint · 8.0% mgmt
Financing live
Cash to close
- Down payment
- $66,225
- Closing costs
- $7,947
- Reserves months
- —
- Total cash needed
- —
Loan-product check · same deal, 3 products live
Conventional
25% down · 7.5% · 30yr
- Down + closing
- —
- Monthly P&I
- —
- Monthly cashflow
- —
- DSCR
- —
- Eligible?
- —
Personal DTI + credit; lowest rate.
DSCR
20% down · 8.5% · 30yr
- Down + closing
- —
- Monthly P&I
- —
- Monthly cashflow
- —
- DSCR
- —
- Eligible?
- —
No personal income docs; deal must DSCR.
Hard money
10% down · 12.0% · 12mo
- Down + closing
- —
- Monthly P&I
- —
- Monthly cashflow
- —
- DSCR
- —
- Eligible?
- —
Short-term bridge; refi at stabilization.
Rent comps 2 comps
| Address | Beds | Baths | Sqft | Rent | $/sqft | DOM | Units | Dist |
|---|---|---|---|---|---|---|---|---|
| 183 Mimosa Rd Dale, TX | 3.0 | 1.5 | 2400 | $1,700 | $0.71 | 11d | 1 | 0.31mi |
| 105 Pineapple Sage Cv Dale, TX | 4.0 | 3.0 | 2789 | $2,500 | $0.90 | 11d | 1 | 0.60mi |
Listing history 27 events
-
2026-06-18days on market $264,900 Active 308 DOM
-
2026-06-17price $264,900 Active 307 DOM
-
2026-06-17days on market $274,900 Active 307 DOM
-
2026-06-16days on market $274,900 Active 306 DOM
-
2026-06-15days on market $274,900 Active 305 DOM
-
2026-06-13days on market $274,900 Active 303 DOM
-
2026-06-09days on market $274,900 Active 299 DOM
-
2026-06-08days on market $274,900 Active 298 DOM
-
2026-06-07days on market $274,900 Active 297 DOM
-
2026-06-04days on market $274,900 Active 294 DOM
-
2026-06-03days on market $274,900 Active 293 DOM
-
2026-06-02days on market $274,900 Active 292 DOM
-
2026-06-01days on market $274,900 Active 291 DOM
-
2026-05-31days on market $274,900 Active 290 DOM
-
2026-04-16price $274,900 693-char remark
Show marketing remark (693 chars)
Endless Potential in a Welcoming Community Nestled in the inviting residential neighborhood of 134 Plumeria Dr, Dale, TX 78616, this 2023-built home offers a rare opportunity to create something truly special. Featuring four spacious bedrooms and two full bathrooms, the layout is designed with comfort and livability in mind. While the home is not yet fully complete, its prime location and solid foundation provide the perfect canvas for customization. Whether you're a visionary homeowner or an investor with an eye for potential, this property is ready to become a place where lasting memories are made. Price was adjusted due to more complete home, ad lighting, exterior paint and faucets
-
2025-08-27price $279,900 693-char remark
Show marketing remark (693 chars)
Endless Potential in a Welcoming Community Nestled in the inviting residential neighborhood of 134 Plumeria Dr, Dale, TX 78616, this 2023-built home offers a rare opportunity to create something truly special. Featuring four spacious bedrooms and two full bathrooms, the layout is designed with comfort and livability in mind. While the home is not yet fully complete, its prime location and solid foundation provide the perfect canvas for customization. Whether you're a visionary homeowner or an investor with an eye for potential, this property is ready to become a place where lasting memories are made. Price was adjusted due to more complete home, ad lighting, exterior paint and faucets
-
2025-08-14$244,900 Active 693-char remark
Show marketing remark (693 chars)
Endless Potential in a Welcoming Community Nestled in the inviting residential neighborhood of 134 Plumeria Dr, Dale, TX 78616, this 2023-built home offers a rare opportunity to create something truly special. Featuring four spacious bedrooms and two full bathrooms, the layout is designed with comfort and livability in mind. While the home is not yet fully complete, its prime location and solid foundation provide the perfect canvas for customization. Whether you're a visionary homeowner or an investor with an eye for potential, this property is ready to become a place where lasting memories are made. Price was adjusted due to more complete home, ad lighting, exterior paint and faucets
-
2025-01-03Active
-
2024-10-11status Active
-
2024-10-08historical Active Under Contract
-
2024-09-30Active
-
2024-06-30price
-
2024-06-11price
-
2024-05-23Active
-
2024-03-22price
-
2024-02-26price
-
2023-12-20Active
ⓘ Source: listings_history table (triggers on properties + properties_extension) + one-shot
backfill from property_details.listing_events for pre-trigger history.
Tax reassessment forecast TX · Resets to sale price
- Current annual tax
- $3,764 · $314/mo
- Projected year-2 tax
- $4,848 · $404/mo
- Expected delta
- +$1,084/yr (+$90/mo · 28.8%)
ⓘ Screening estimate from a state-policy table — verify with the county assessor before closing.
Climate risk First Street
- Flood 1/10 Low FEMA zone X (unshaded) · 0% chance over 30 yrs
- Wildfire 5/10 Major
- Heat 8/10 Severe 7 d/yr ≥108°F today · 20 d/yr by 30 yrs out
- Wind 8/10 Severe 80% chance of damaging wind over 30 yrs
- Air quality 1/10 Low 0 unhealthy d/yr today · 0 by 30 yrs out
Nearby sold comps map
Loading sold comps map…
Walkable amenities ~0.75 mi
Loading nearby amenities…
Taxation est. · year 1
- Rental income
- $23,335
- − Mortgage interest
- −$14,839
- − Property taxes
- −$3,764
- − Insurance
- −$1,324
- − Repairs & maintenance
- −$1,867
- − Management
- −$1,867
- − Depreciation
- −$7,706
- Taxable loss
- −$8,032
- Est. tax savings @ 24.0%
- +$1,928
- After-tax cash flow
- $-1,396/yr
For passive investors: Depreciation is non-cash, so a rental often shows a tax loss while cash-flowing — sheltering income. Rental losses are passive: they offset passive income freely, and up to $25,000/yr can offset ordinary (W-2) income if you actively participate and your MAGI is under $100k (phasing out to $0 by $150k); unused losses carry forward. On sale, claimed depreciation is recaptured at up to 25%, and gains may owe capital-gains tax (a 1031 exchange can defer both). Figures are a year-1 estimate at your 24.0% rate — not tax advice; consult a CPA.
Schools (NCES district)
- District
- Bastrop ISD
- NCES district ID
- 4809570
- Math proficiency
- 25% ▼ -13.00%
- Reading proficiency
- 28% ▼ -4.00%
- Median HH income
- $56,010
- Composite
- 23.87/100
- National rank
- #7799
- State rank
- #670 of 826 in TX
Livability — Mustang Ridge
- Score
- 63/100
- State rank
- #854
- US rank
- #15380
Category grades
Schools grade is shown separately in the Schools card above.
Census & demographics
- Population (ZIP)
- 10,008
Population outlook (Bastrop County) Hauer SSP2
- Today (2025)
- 94,260 people
- By 2030
- 101,355 · +7.5%
- By 2040
- 115,578 · +22.6%
- By 2050
- 129,464 · +37.3%
- By 2075
- 168,068 · +78.3%
- By 2100
- 194,857 · +106.7%
Race, ethnicity, and origin ACS 2023
- Neighborhood character
- Predominantly Hispanic (77%)
- Race & ethnicity
- Hispanic / Latino 77% Two or more races 48% White 17% Native American 2% Black 1%
- Hispanic origin (detail)
- Mexican 72%
- Common ancestry
- Iranian 1% Romanian 1% Lithuanian 1%
- Foreign-born
- 24% · Canada
- Languages at home
- 48% English-only · Spanish 51% German/W. Germanic 1%
Political lean MEDSL · Bastrop
- 2024 margin
- R (+18.4) · D 40.2% · R 58.6% · Other 1.2%
- 2008→2024 swing
- -10.2pp toward R · 2008: -8.2pp · 2024: -18.4pp
- All cycles
- 2024: R+18.4 2020: R+13.8 2016: R+20.4 2012: R+17.0 2008: R+8.2
Not yet ingested
- Civics
- —
Market trends
- HPI YoY
- ▲ 14.00%
- Current HPI
- 308.45
- Rent YoY
- —
- Metro
- —
- State GDP YoY
- ▲ 3.95%
- F500 in state
- 110
Industry mix (Fortune 500 HQ in TX)
| Industry | F500 HQs | Revenue |
|---|---|---|
| Energy | 16 | $1,198B |
|
||
| Technology | 5 | $198B |
|
||
| Engineering / Construction | 4 | $72B |
|
||
| Energy Services | 3 | $60B |
|
||
| Utilities | 3 | $41B |
|
||
| Healthcare | 2 | $330B |
|
||
Price history
+12.2% since first listed13 events — show timeline
- 2026-04-16 Price Changed $274,900 Unlock MLS
- 2025-08-27 Price Changed $279,900 Unlock MLS
- 2025-08-14 Listed $244,900 Unlock MLS
- 2025-01-03 Listed — Unlock MLS
- 2024-10-11 Relisted — Unlock MLS
- 2024-10-08 Contingent — Unlock MLS
- 2024-09-30 Listed — Unlock MLS
- 2024-06-30 Price Changed — Unlock MLS
- 2024-06-11 Price Changed — Unlock MLS
- 2024-05-23 Listed — Unlock MLS
- 2024-03-22 Price Changed — Unlock MLS
- 2024-02-26 Price Changed — Unlock MLS
- 2023-12-20 Listed — Unlock MLS
Property tax history
+60.6%/yrLatest (2025): $3,764 · +21.0% YoY. Source: county tax records.
Cash-flow waterfall
monthlySold comps — $/sqft
last 12 mo · ≤1 miLoading sold comps…