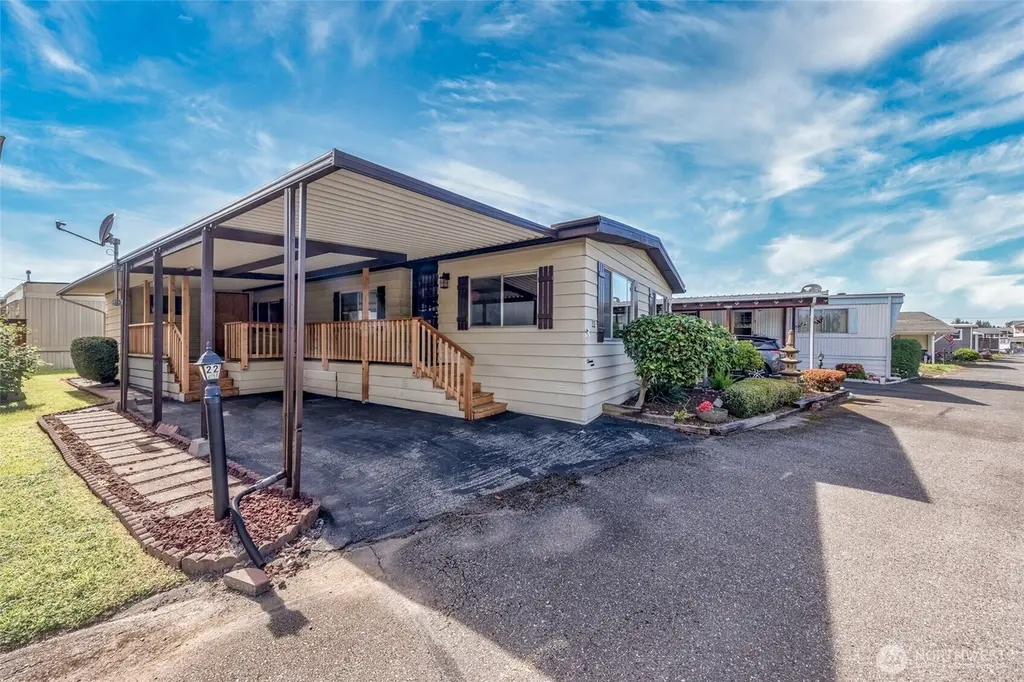
18501 52nd Ave W #22 · Lynnwood, WA
Flood risk No data
- FEMA flood zone
- —
- Chance of flooding over 30 yrs
- —
- Est. flood insurance / yr
- —
Fire risk No data
- Est. fire insurance / yr
- —
Heat risk No data
- Hot days now (above threshold)
- —
- Hot days in 30 yrs
- —
Wind risk No data
- Chance of severe wind over 30 yrs
- —
Air-quality risk No data
- Unhealthy air days now
- —
- Unhealthy air days in 30 yrs
- —
Risk factors via First Street. Map © Google.
Why this score? — see what drove the B+ grade
The composite is a weighted blend of 9 inputs, each scored 0–100. Each bar is that input's sub-score; the figure is the points it added to the 100-point composite (weight × sub-score).
- Cash flow +30.0/30.0
- ARV discount +12.2/15.0
- 1% rule +10.0/10.0
- DSCR +10.0/10.0
- Schools +5.4/10.0
- Livability +3.9/5.0
- Rent growth +2.8/5.0
- Condition / age +2.5/5.0
- Appreciation +0.0/10.0
$119,500
🖨 Deal sheet 📄 Offer letter ✓ Due diligence
Listing remarks
Beautifully maintained and spacious home located in a quiet gated 55+ community. This move-in ready home features new carpet and vinyl flooring, professionally re-leveled floors, a new dishwasher, new hot water heater, updated lighting throughout (except kitchen). Vaulted ceilings and an open floor plan create a bright and inviting living space. Enjoy meals in the built-in breakfast nook or formal dining room. Relax in the large primary suite with adjoining en-suite bath and soaker tub. The walk-in utility room includes washer/dryer and abundant cabinet storage. Outside, the large covered area offers parking, a powered workshop, and a deck perfect for outdoor enjoyment. The community clubho
Key facts
- Gated community
- New carpet
- New hot water heater
Tags
Property features AI
Finance
- Other: Energy-efficient double pane windows
- Financial info: Land lease: $1,350; Listing terms: Cash or Conventional
- HOA & community: Located in Royalwood Estates manufactured home park; Park approved for sale; Clubhouse, common area, exercise room, recreational area; High-speed internet available; Security gate; 89 homes in the park
Exterior
- Parking: Carport; RV parking (park amenity)
- Security: Security gate
- Utilities: Public water (billed by park); Sewer billed by park; Electric and natural gas available; Electric water heater located in guest bedroom closet; Cable: Xfinity; Internet: Xfinity; Power service: Snohomish County PUD
- Home design: Manufactured home (double wide); One level; Good condition; Model: SOMERSET (GOLDENWEST); Mobile home remains; Skirted with metal
- Construction: Metal/vinyl and wood construction materials; Torch down roof; Pillar/post/pier foundation
- Exterior features: Patio/porch/deck; Awnings; Landscaped; Metal/vinyl and wood exterior
Interior
- Kitchen: Dishwasher; Garbage disposal; Refrigerator; Stove/Range
- Bedrooms: 2 bedrooms
- Flooring: Vinyl; Carpet
- Bathrooms: 1 full bath; 1 three-quarter bath; 2 bathtubs; 1 shower
- Heating & cooling: Forced air heating
- Interior features: Water heater; Jetted/soaking tub; Vaulted ceilings; Drapes; Dining room, entry, family room, living room, utility room, and kitchen with eating space
- Laundry & utility: Washer; Dryer; Utility room
Neighborhood map
What this means for you Summary
Snapshot
- This is a 2-bed/2.0-bath manufactured listed at $120k.
Deal economics
- At list price, monthly cash flow is $989 ($12k/yr) — positive.
- The deal already cash-flows at list — no discount required.
- Meets the 1% rule at list price ($2k rent vs $120k).
- Recommended offer: $118k (1.5% below list) — sets the bar for market timing.
- Cap rate 16.2% vs local median 2.2% in Lynnwood — top-decile yield for the area; either an underpriced asset or a hidden risk that comps aren't pricing in. Stress-test before assuming the spread holds.
Location & tenants
- Location reads 77/100 on livability (#150 in WA, #3,226 nationally) — a middle-class / working-renter tenant base. Strengths: commute A+, health & safety A+, employment A; Watch: crime F, cost of living F.
- Edmonds School District (suburban): math 54% / reading 65% proficiency, ranked #53 of 291 in WA (top 18%) — acceptable for families but not a draw, mixed tenant base, ~2y average lease.
- Market conditions: Rents rising (+1.4%/yr); 173 active listings in the ZIP; 40 comparable units currently listed for rent nearby; rentals leasing fast (median 5d on market — plan ~1-2 weeks tenant-placement turnaround); solid renter incomes; 3,982 units permitted in Snohomish County in 2024 (1,492 in 5+ unit buildings).
Forward outlook
- Local home prices are declining (-3.0%/yr); year-one equity from $826 of loan paydown is wiped out by about $4k of value loss. Plan a longer hold.
- Snohomish County population projected at +30% by 2050 — long-run rental-demand tailwind backs the buy-and-hold thesis.
- At projected returns (-3.0% appreciation + 1.4% rent growth), your $33k cash investment doubles in ~4 years — after that, you're playing with house money.
Negotiation context
- It's been on market 20 days — a 2% lower offer ($118k) is reasonable based on typical stale-listing flexibility.
- 2 sale attempts since 16y ago with the ask held roughly flat each time — persistent listings suggest the price (not the market) is what's stuck; bring a comps-based counter.
- Current owner paid $20k; list at $120k implies a 497% gain — meaningful room to come down on a strong offer.
Questions for the listing agent
- Is there a deadline driving the sale (1031 exchange, divorce, estate, relocation)? That informs how much negotiation room exists.
- Crime grade is F in this area — have there been break-ins, vandalism, or insurance claims at this property in the last 3 years? What carrier currently insures it and at what premium?
- What's the average days-on-market for RENTAL listings here right now (not sales)? A rising rental-DOM trend means longer vacancies and softer asking-rent achievability than the comps imply.
- What's the recent tenant-quality profile in this submarket — average credit score on applications, eviction rate, late-payment / NSF rate, and stable-employment percentage? A property-management company in the area should have these aggregated.
- How much new for-sale + rental construction is in the pipeline within 1–3 miles? Heavy new supply typically softens prices + rents 12–24 months out; constrained supply supports both.
Investment metrics
- 1% rule
- 1.84% ✓
- Cap rate
- 16.22%
- Cash-on-cash
- 35.46%
- DSCR
- 2.58
- GRM
- 4.5
CMA / ARV
- ARV (on-the-fly)
- $133,536
- Comps found
- 8
Show comp detail 8 sales within ~0.75 mi
| Address | Dist | Beds/Ba | Sqft | Sold | Price | $/sf | Match |
|---|---|---|---|---|---|---|---|
| 18501 52nd Ave W #83 | 0.08mi | 2/2.0 | 1,260 (+1%) | 10mo | $135,000 | $107 | 87 |
| 18501 52nd Ave W #54 | 0.00mi | 2/2.0 | 1,096 (-12%) | 0mo | $145,000 | $132 | 80 |
| 5220 176th St SW #12 | 0.45mi | 2/1.5 | 1,200 (-4%) | 12mo | $95,000 | $79 | 61 |
| 5220 176th St SW #9 | 0.45mi | 2/2.0 | 1,336 (+7%) | 12mo | $73,800 | $55 | 57 |
| 5220 176th St SW #14 | 0.45mi | 2/2.0 | 1,330 (+7%) | 15mo | $83,500 | $63 | 56 |
| 5220 176th St SW #50 | 0.45mi | 2/2.0 | 1,200 (-4%) | 22mo | $99,900 | $83 | 54 |
| 4515 176th St SW #33 | 0.66mi | 3/2.0 (+1) | 1,248 (0%) | 14mo | $157,000 | $126 | 52 |
| 17408 44th Ave W #32 | 0.73mi | 3/2.0 (+1) | 1,188 (-5%) | 11mo | $225,000 | $189 | 44 |
Match score weights: distance 35% · size 25% · config 20% · recency 20%. Top-matched comps best support the ARV.
Projected returns pro-forma
-3.0% appreciation · 1.37% rent growth · sell at horizon
- IRR
- 29.3%
- Equity multiple
- 2.20×
- Total profit
- $40,043
- Equity at exit
- $17,818
- IRR
- 35.7%
- Equity multiple
- 4.04×
- Total profit
- $101,785
- Equity at exit
- $10,332
Cash invested: $33,460 (down + closing). Projections, not guarantees.
Landlord ↔ Tenant lean methodology
- Overall (STATE)
- 28 Tenant-Leaning
- State Washington
- 28 Tenant-Leaning · D+8
- County
- — inherits STATE
- City
- — inherits STATE
ZIP-level market 98037
- Rents YoY
- 1.4%
- Active inventory
- 173
- Price-to-rent
- 4.5×
Monthly cashflow live
- Estimated rent
- $2,205 high interval (Pro) →
- Mortgage (P&I)
- −$627
- Tax from tax record
- −$76 /mo · $916/yr
- Insurance
- −$50
- HOA
- −$0
- Vacancy / Maint / Mgmt
- −$463
- Net cashflow
- $989
Break-even live
UW: 25.0% down · 7.5% · 30yr · 1.5% tax · 5.0% vac · 8.0% maint · 8.0% mgmt
Financing live
Cash to close
- Down payment
- $29,875
- Closing costs
- $3,585
- Reserves months
- —
- Total cash needed
- —
Loan-product check · same deal, 3 products live
Conventional
25% down · 7.5% · 30yr
- Down + closing
- —
- Monthly P&I
- —
- Monthly cashflow
- —
- DSCR
- —
- Eligible?
- —
Personal DTI + credit; lowest rate.
DSCR
20% down · 8.5% · 30yr
- Down + closing
- —
- Monthly P&I
- —
- Monthly cashflow
- —
- DSCR
- —
- Eligible?
- —
No personal income docs; deal must DSCR.
Hard money
10% down · 12.0% · 12mo
- Down + closing
- —
- Monthly P&I
- —
- Monthly cashflow
- —
- DSCR
- —
- Eligible?
- —
Short-term bridge; refi at stabilization.
Rent comps 40 comps
| Address | Beds | Baths | Sqft | Rent | $/sqft | DOM | Units | Dist |
|---|---|---|---|---|---|---|---|---|
| 18400 52nd Ave W Lynnwood, WA | 2.0 | 1.0 | 1092 | $1,995 | $1.83 | 43d | 1 | 0.10mi |
| 18534 52nd Ave W Lynnwood, WA | 2.0 | 2.0 | 1100 | $2,295 | $2.09 | 2d | 1 | 0.18mi |
| 18606 52nd Ave W Lynnwood, WA | 2.0 | 2.0 | 1204 | $2,325 | $1.93 | 5d | 1 | 0.22mi |
| 5311 188th St SW Lynnwood, WA | 2.0 | 1.5 | 1004 | $2,500 | $2.49 | 43d | 1 | 0.27mi |
| 5620 183rd St SW Lynnwood, WA | 1.0–2.0 | 1.0 | 787 | $2,075 | $2.63 | 2d | 2 | 0.38mi |
| 5707 186th Pl SW Unit 4-PLEX 1 Lynnwood, WA | 2.0 | 2.0 | 1000 | $2,135 | $2.13 | 24d | 1 | 0.40mi |
| 5624 183rd St SW Lynnwood, WA | 1.0–2.0 | 1.0 | 787 | $2,100 | $2.67 | 5d | 2 | 0.41mi |
| 4516 188th St SW Lynnwood, WA | 3.0 | 1.0 | 1500 | $2,895 | $1.93 | 24d | 1 | 0.44mi |
| 4816 176th St SW Lynnwood, WA | 1.0–2.0 | 1.0–1.5 | 802 | $1,970 | $2.45 | 3d | 6 | 0.48mi |
| 4702 176th St SW Lynnwood, WA | 1.0–2.0 | 1.0 | 886 | $1,925 | $2.17 | 2d | 8 | 0.49mi |
| 4502 176th St SW Unit 2 Lynnwood, WA | 2.0 | 2.0 | 1004 | $2,195 | $2.19 | 43d | 1 | 0.50mi |
| 17828 44th Ave W Unit 2 Lynnwood, WA | 2.0 | 2.0 | 750 | $2,100 | $2.80 | 43d | 1 | 0.52mi |
| 4432 176th St SW Unit 2 Lynnwood, WA | 2.0 | 2.0 | 1004 | $2,195 | $2.19 | 24d | 1 | 0.55mi |
| 4432 176th St SW Unit 3 Lynnwood, WA | 2.0 | 2.0 | 1004 | $2,195 | $2.19 | 43d | 1 | 0.55mi |
| 4428 176th St SW Unit 4 Lynnwood, WA | 2.0 | 2.0 | 1004 | $2,195 | $2.19 | 24d | 1 | 0.56mi |
| 17422 52nd Ave W Lynnwood, WA | 2.0 | 1.5 | 850 | $1,960 | $2.31 | 24d | 1 | 0.58mi |
| 4410 176th St SW Lynnwood, WA | 1.0–2.0 | 1.0 | 770 | $1,850 | $2.40 | 5d | 3 | 0.62mi |
| 17529 44th Ave W Lynnwood, WA | 2.0 | 1.0 | 1000 | $2,395 | $2.40 | 3d | 1 | 0.68mi |
| 18020 40th Ave W Lynnwood, WA | 1.0 | 1.0 | 1350 | $2,350 | $1.74 | 43d | 1 | 0.70mi |
| 5419 172nd Pl SW Lynnwood, WA | 3.0 | 2.0 | 980 | $2,895 | $2.95 | 24d | 1 | 0.76mi |
| 17314 44th Ave W Unit C Lynnwood, WA | 2.0 | 1.5 | 1000 | $2,200 | $2.20 | 18d | 1 | 0.78mi |
| 17619 62nd Pl W Lynnwood, WA | 3.0 | 1.0 | 1400 | $2,695 | $1.93 | 43d | 1 | 0.85mi |
| 19801 50th Ave W Lynnwood, WA | 1.0–2.0 | 1.0 | 825 | $1,925 | $2.33 | 5d | 5 | 0.86mi |
| 19800 50th Ave W Lynnwood, WA | 2.0 | 1.0 | 854 | $1,790 | $2.10 | 2d | 4 | 0.90mi |
| 19309 40th Ave W Lynnwood, WA | 2.0 | 1.0–1.5 | 707 | $2,580 | $3.65 | 43d | 3 | 0.92mi |
| 18124 36th Ave W Lynnwood, WA | 1.0–2.0 | 1.0–2.0 | 821 | $2,155 | $2.62 | 3d | 8 | 0.93mi |
| 5618 198th St SW Unit 202 Lynnwood, WA | 2.0 | 1.0 | 817 | $1,750 | $2.14 | 3d | 1 | 0.96mi |
| 18505 36th Ave W Lynnwood, WA | 1.0–2.0 | 1.0–2.0 | 776 | $2,356 | $3.04 | 2d | 9 | 0.99mi |
| 18031 36th Ave W Lynnwood, WA | 1.0–2.0 | 1.0–2.0 | 760 | $2,186 | $2.88 | 2d | 6 | 0.99mi |
| 4807 200th St SW Lynnwood, WA | 2.0–3.0 | 1.0 | 935 | $1,550 | $1.66 | 2d | 12 | 0.99mi |
| 19501 40th Ave W Lynnwood, WA | 1.0–2.0 | 1.0 | 662 | $2,346 | $3.54 | 3d | 25 | 1.00mi |
| 4727 200th St SW Lynnwood, WA | 1.0–2.0 | 1.0–1.5 | 875 | $2,558 | $2.92 | 1d | 12 | 1.00mi |
| 5725 200th St SW Lynnwood, WA | 2.0 | 1.0 | 800 | $2,000 | $2.50 | 16d | 1 | 1.05mi |
| 4800 200th St SW Unit E201 Lynnwood, WA | 2.0 | 2.0 | 971 | $2,300 | $2.37 | 5d | 1 | 1.06mi |
| 4001 198th St SW Lynnwood, WA | 3.0 | 1.0–2.0 | 905 | $3,115 | $3.44 | 3d | 242 | 1.08mi |
| 16604 48th Ave W Lynnwood, WA | 1.0–3.0 | 1.0–2.0 | 890 | $2,162 | $2.43 | 3d | 9 | 1.11mi |
| 19301 36th Ave W Lynnwood, WA | 2.0 | 1.5 | 1080 | $2,250 | $2.08 | 24d | 1 | 1.11mi |
| 19301 36th Ave W Unit 37 Lynnwood, WA | 2.0 | 1.5 | 1080 | $2,250 | $2.08 | 11d | 1 | 1.13mi |
| 5812 200th St SW Unit B Lynnwood, WA | 2.0 | 2.0 | 942 | $2,300 | $2.44 | 43d | 1 | 1.13mi |
| 19888 40th Ave W Lynnwood, WA | 1.0 | 1.0 | 572 | $2,565 | $4.48 | 2d | 8 | 1.15mi |
Listing history 14 events
-
2026-06-18days on market $119,500 Active 20 DOM
-
2026-06-17days on market $119,500 Active 19 DOM
-
2026-06-16days on market $119,500 Active 18 DOM
-
2026-06-15days on market $119,500 Active 17 DOM
-
2026-06-13days on market $119,500 Active 15 DOM
-
2026-06-13days on market $119,500 Active 14 DOM
-
2026-06-09days on market $119,500 Active 11 DOM
-
2026-06-08days on market $119,500 Active 10 DOM
-
2026-06-07days on market $119,500 Active 9 DOM
-
2026-06-04days on market $119,500 Active 6 DOM
-
2026-06-03days on market $119,500 Active 5 DOM
-
2026-06-02days on market $119,500 Active 4 DOM
-
2026-06-01days on market $119,500 Active 3 DOM
-
2026-05-31days on market $119,500 Active 2 DOM
ⓘ Source: listings_history table (triggers on properties + properties_extension) + one-shot
backfill from property_details.listing_events for pre-trigger history.
Tax reassessment forecast WA · Resets to sale price
- Current annual tax
- $916 · $76/mo
- Projected year-2 tax
- $1,171 · $98/mo
- Expected delta
- +$255/yr (+$21/mo · 27.9%)
ⓘ Screening estimate from a state-policy table — verify with the county assessor before closing.
Nearby sold comps map
Loading sold comps map…
Walkable amenities ~0.75 mi
Loading nearby amenities…
Taxation est. · year 1
- Rental income
- $26,454
- − Mortgage interest
- −$6,694
- − Property taxes
- −$916
- − Insurance
- −$598
- − Repairs & maintenance
- −$2,116
- − Management
- −$2,116
- − Depreciation
- −$3,476
- Taxable income
- $10,538
- Est. tax owed @ 24.0%
- −$2,529
- After-tax cash flow
- $9,336/yr
For passive investors: Depreciation is non-cash, so a rental often shows a tax loss while cash-flowing — sheltering income. Rental losses are passive: they offset passive income freely, and up to $25,000/yr can offset ordinary (W-2) income if you actively participate and your MAGI is under $100k (phasing out to $0 by $150k); unused losses carry forward. On sale, claimed depreciation is recaptured at up to 25%, and gains may owe capital-gains tax (a 1031 exchange can defer both). Figures are a year-1 estimate at your 24.0% rate — not tax advice; consult a CPA.
Schools (NCES district)
- District
- Edmonds School District
- NCES district ID
- 5302400
- Math proficiency
- 54% ▼ -1.00%
- Reading proficiency
- 65% ▬ 0.00%
- Median HH income
- $67,451
- Composite
- 53.94/100
- National rank
- #3026
- State rank
- #53 of 291 in WA
Livability — Lynnwood
- Score
- 77/100
- State rank
- #150
- US rank
- #3226
Category grades
Schools grade is shown separately in the Schools card above.
Census & demographics
- Census place
- Lynnwood, WA
- County
- Snohomish County · 786,756 people
- City population
- 152,865
- Metro
- Seattle-Tacoma-Bellevue, WA
- Population (ZIP)
- 29,723
- Household income
- $107,281
- Rent vs Own
- Severe rent burden
- 1090.0
Population outlook (Snohomish County) Hauer SSP2
- Today (2025)
- 899,800 people
- By 2030
- 960,975 · +6.8%
- By 2040
- 1,074,447 · +19.4%
- By 2050
- 1,171,954 · +30.2%
- By 2075
- 1,384,849 · +53.9%
- By 2100
- 1,497,296 · +66.4%
Race, ethnicity, and origin ACS 2023
- Neighborhood character
- Diverse neighborhood (Simpson 0.69)
- Race & ethnicity
- White 48% Asian 23% Hispanic / Latino 15% Two or more races 12% Black 6%
- Hispanic origin (detail)
- Mexican 11%
- Common ancestry
- Portuguese 3% Italian 3% Slovak 2%
- Foreign-born
- 28% · Canada, China, South Korea
- Languages at home
- 65% English-only · Spanish 10% Chinese 4% Korean 4%
Political lean MEDSL · Snohomish
- 2024 margin
- D (+19.0) · D 57.8% · R 38.9% · Other 3.3%
- 2008→2024 swing
- +0.1pp no change · 2008: 18.9pp · 2024: 19.0pp
- All cycles
- 2024: D+19.0 2020: D+20.6 2016: D+16.6 2012: D+16.2 2008: D+18.9
Not yet ingested
- Civics
- —
Market trends
- HPI YoY
- ▼ -847.19%
- Current HPI
- 340.6136
- Rent YoY
- ▲ 1.37%
- Metro
- Seattle-Tacoma-Bellevue, WA
- State GDP YoY
- ▲ 4.65%
- F500 in state
- 22
Industry mix (Fortune 500 HQ in WA)
| Industry | F500 HQs | Revenue |
|---|---|---|
| Retail | 2 | $269B |
|
||
| Technology / Retail | 1 | $638B |
|
||
| Technology | 1 | $245B |
|
||
| Telecommunications | 1 | $38B |
|
||
| Food / Beverage | 1 | $36B |
|
||
| Automotive / Trucks | 1 | $34B |
|
||
Price history
+408.5% since first listed5 events — show timeline
- 2026-05-29 Listed $119,500 NWMLS as Distributed by MLS Grid
- 2010-08-27 Sold (MLS) $20,000 NWMLS as Distributed by MLS Grid
- 2010-07-09 Pending — NWMLS as Distributed by MLS Grid
- 2010-07-09 Delisted — NWMLS as Distributed by MLS Grid
- 2010-02-17 Listed $23,500 NWMLS as Distributed by MLS Grid
Property tax history
+9.3%/yrLatest (2026): $916 · +8.8% YoY. Source: county tax records.
Cash-flow waterfall
monthlySold comps — $/sqft
last 12 mo · ≤1 miLoading sold comps…