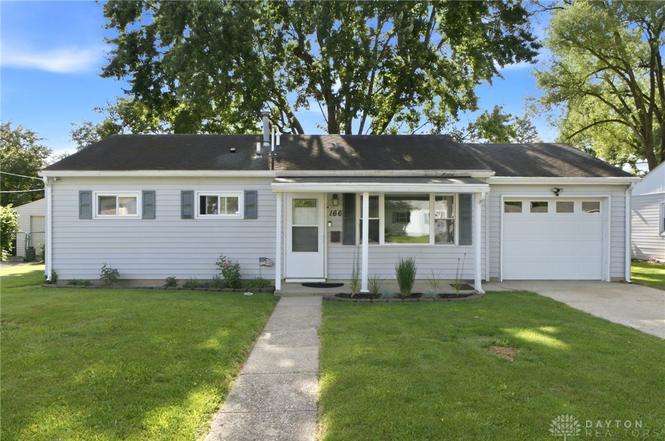
166 Dellwood Dr · Fairborn, OH
Flood risk 1/10 · Minimal
- FEMA flood zone
- X (unshaded)
- Chance of flooding over 30 yrs
- 0.0%
- Est. flood insurance / yr
- $507 – $1,088
Fire risk 1/10 · Minimal
- Est. fire insurance / yr
- $713 – $1,323
Heat risk 3/10 · Minor
- Hot days now (above 101°F)
- 7 days/yr
- Hot days in 30 yrs
- 18 days/yr
Wind risk 2/10 · Minimal
- Chance of severe wind over 30 yrs
- 0.0%
Air-quality risk 4/10 · Minor
- Unhealthy air days now
- 4 days/yr
- Unhealthy air days in 30 yrs
- 5 days/yr
Risk factors via First Street. Map © Google.
Why this score? — see what drove the D- grade
The composite is a weighted blend of 9 inputs, each scored 0–100. Each bar is that input's sub-score; the figure is the points it added to the 100-point composite (weight × sub-score).
- Cash flow +13.5/30.0
- DSCR +4.1/10.0
- Rent growth +3.9/5.0
- Schools +3.6/10.0
- Livability +3.6/5.0
- 1% rule +2.9/10.0
- Condition / age +2.5/5.0
- ARV discount +1.3/15.0
- Appreciation +0.0/10.0
$169,900
🖨 Deal sheet 📄 Offer letter ✓ Due diligence
Listing remarks
Welcome home to this well-maintained 3-bedroom, 1-bath ranch offering comfortable one-level living and thoughtful updates throughout! Step inside to a spacious living room highlighted by a large picture window that fills the space with natural light, creating a warm and inviting atmosphere. The kitchen features crisp white cabinetry with abundant storage space, updated appliances, and plenty of room for meal preparation and everyday dining. Down the hall, you'll find an updated full bathroom along with three bedrooms, including two comfortably carpeted bedrooms. Outside, enjoy relaxing or entertaining on the covered back patio complete with an awning for added shade and comfort. The fully f
Key facts
- Updated appliances
- Large picture window
- Covered back patio
Tags
Property features AI
Finance
- Financial info: Property is offered for sale
Exterior
- Parking: Attached one-car garage
- Utilities: Natural gas heating; Central air conditioning
- Home design: Single-story home; Frame construction with vinyl siding; Slab foundation
- Construction: Frame and vinyl siding construction
- Exterior features: Residential lot with dimensions approximately 64 x 109 x 56 x 108
Interior
- Kitchen: Main-level kitchen (13 x 10)
- Bedrooms: Two main-level bedrooms (11 x 7 and 9 x 11)
- Bathrooms: One full bathroom on the main level
- Heating & cooling: Central air conditioning; Forced air heating with natural gas
- Interior features: Total of 5 rooms
Neighborhood map
What this means for you Summary
Snapshot
- This is a 3-bed/1.0-bath single-family listed at $170k.
Deal economics
- At list price, monthly cash flow is $6 ($68/yr) — positive.
- The deal already cash-flows at list — no discount required.
- To meet the 1% rule (rent ≥ 1% of price), the offer needs to be $134k (21.4% below list).
- Recommended offer: $134k (21.4% below list) — sets the bar for 1% rule.
- Cap rate 6.3% vs local median 3.7% in Fairborn — top-decile yield for the area; either an underpriced asset or a hidden risk that comps aren't pricing in. Stress-test before assuming the spread holds.
Location & tenants
- Location reads 72/100 on livability (#374 in OH) — a middle-class / working-renter tenant base. Strengths: cost of living A+, housing A+; Watch: health & safety C-, schools D+, employment D+.
- Fairborn City (suburban): math 36% / reading 49% proficiency, ranked #520 of 656 in OH (top 79%) — families likely to look elsewhere, expect single-tenant / working-renter base with shorter leases.
- Market conditions: Rents rising fast (+5.8%/yr); 180 active listings in the ZIP; 13 comparable units currently listed for rent nearby; rentals at typical pace (median 15d on market — plan ~3-4 weeks tenant-placement turnaround); 797 units permitted in Greene County in 2024 (148 in 5+ unit buildings).
Forward outlook
- Local home prices are declining (-3.0%/yr); year-one equity from $1k of loan paydown is wiped out by about $5k of value loss. Plan a longer hold.
Negotiation context
- Only 1 days on market — expect competitive offers; lowballing is unlikely to land.
Risks & watch-outs
- Watch-outs: built in 1954 — expect roof / HVAC / electrical / plumbing capex.
Questions for the listing agent
- Built in 1954 — when were the roof, HVAC, electrical panel, plumbing, and water heater last replaced?
- Is there a deadline driving the sale (1031 exchange, divorce, estate, relocation)? That informs how much negotiation room exists.
- Schools are D-rated, which usually means shorter tenancies and higher turnover. Who's the typical renter profile here, and what's been the actual vacancy rate?
- The area grade is low — what's the realistic commute time and amenity access for the typical tenant pool here? Any planned neighborhood developments (good or bad) we should know about?
- What's the average days-on-market for RENTAL listings here right now (not sales)? A rising rental-DOM trend means longer vacancies and softer asking-rent achievability than the comps imply.
- What's the recent tenant-quality profile in this submarket — average credit score on applications, eviction rate, late-payment / NSF rate, and stable-employment percentage? A property-management company in the area should have these aggregated.
- How much new for-sale + rental construction is in the pipeline within 1–3 miles? Heavy new supply typically softens prices + rents 12–24 months out; constrained supply supports both.
Investment metrics
- 1% rule
- 0.79% ✗
- Cap rate
- 6.33%
- Cash-on-cash
- 0.14%
- DSCR
- 1.01
- GRM
- 10.6
CMA / ARV
- ARV (on-the-fly)
- $149,328
- Comps found
- 12
Show comp detail 12 sales within ~0.75 mi
| Address | Dist | Beds/Ba | Sqft | Sold | Price | $/sf | Match |
|---|---|---|---|---|---|---|---|
| 421 Marchmont Dr | 0.20mi | 3/1.0 | 816 (0%) | 2mo | $177,000 | $217 | 88 |
| 97 Marchmont Dr | 0.42mi | 3/1.0 | 816 (0%) | 4mo | $174,000 | $213 | 77 |
| 184 Pat Ln | 0.48mi | 3/1.0 | 840 (+3%) | 4mo | $160,001 | $190 | 69 |
| 45 Regina Dr | 0.16mi | 2/1.0 (-1) | 924 (+13%) | 2mo | $137,900 | $149 | 64 |
| 849 Flintridge Dr | 0.54mi | 2/1.0 (-1) | 792 (-3%) | 3mo | $145,000 | $183 | 62 |
| 244 Pat Ln | 0.48mi | 2/1.0 (-1) | 744 (-9%) | 1mo | $77,000 | $103 | 57 |
| 818 Flintridge Dr | 0.54mi | 2/1.0 (-1) | 744 (-9%) | 3mo | $125,000 | $168 | 53 |
| 153 N Diana Ln | 0.64mi | 2/1.0 (-1) | 744 (-9%) | 1mo | $144,000 | $194 | 50 |
| 15 N Diana Ln | 0.66mi | 2/1.0 (-1) | 744 (-9%) | 2mo | $145,000 | $195 | 48 |
| 1330 Kapok St | 0.64mi | 3/1.0 | 925 (+13%) | 1mo | $155,000 | $168 | 48 |
| 141 Locust Dr | 0.61mi | 3/1.0 | 925 (+13%) | 5mo | $143,000 | $155 | 45 |
| 1230 Ironwood Dr | 0.67mi | 3/1.0 | 925 (+13%) | 4mo | $167,000 | $181 | 43 |
Match score weights: distance 35% · size 25% · config 20% · recency 20%. Top-matched comps best support the ARV.
Projected returns pro-forma
-3.0% appreciation · 5.75% rent growth · sell at horizon
- IRR
- -13.4%
- Equity multiple
- 0.51×
- Total profit
- $-23,430
- Equity at exit
- $25,333
- IRR
- -1.0%
- Equity multiple
- 0.92×
- Total profit
- $-3,685
- Equity at exit
- $14,690
Cash invested: $47,572 (down + closing). Projections, not guarantees.
Landlord ↔ Tenant lean methodology
- Overall (STATE)
- 73 Landlord-Friendly
- State Ohio
- 73 Landlord-Friendly · R+6
- County
- — inherits STATE
- City
- — inherits STATE
ZIP-level market 45324
- Rents YoY
- 5.8%
- Active inventory
- 180
- Price-to-rent
- 10.6×
Monthly cashflow live
- Estimated rent
- $1,335 high interval (Pro) →
- Mortgage (P&I)
- −$891
- Tax from tax record
- −$87 /mo · $1,049/yr
- Insurance
- −$71
- HOA
- −$0
- Vacancy / Maint / Mgmt
- −$280
- Net cashflow
- $6
Break-even live
UW: 25.0% down · 7.5% · 30yr · 1.5% tax · 5.0% vac · 8.0% maint · 8.0% mgmt
Financing live
Cash to close
- Down payment
- $42,475
- Closing costs
- $5,097
- Reserves months
- —
- Total cash needed
- —
Loan-product check · same deal, 3 products live
Conventional
25% down · 7.5% · 30yr
- Down + closing
- —
- Monthly P&I
- —
- Monthly cashflow
- —
- DSCR
- —
- Eligible?
- —
Personal DTI + credit; lowest rate.
DSCR
20% down · 8.5% · 30yr
- Down + closing
- —
- Monthly P&I
- —
- Monthly cashflow
- —
- DSCR
- —
- Eligible?
- —
No personal income docs; deal must DSCR.
Hard money
10% down · 12.0% · 12mo
- Down + closing
- —
- Monthly P&I
- —
- Monthly cashflow
- —
- DSCR
- —
- Eligible?
- —
Short-term bridge; refi at stabilization.
Rent comps 13 comps
| Address | Beds | Baths | Sqft | Rent | $/sqft | DOM | Units | Dist |
|---|---|---|---|---|---|---|---|---|
| 124 E Lindberg Dr Fairborn, OH | 4.0 | 1.0 | 1075 | $1,495 | $1.39 | 44d | 1 | 0.50mi |
| 1040 S Central Ave Fairborn, OH | 3.0 | 1.0 | 860 | $1,499 | $1.74 | 23d | 1 | 0.54mi |
| 1033 Victoria Ave Fairborn, OH | 2.0 | 1.0 | 768 | $1,300 | $1.69 | 14d | 1 | 0.62mi |
| 212 High St Fairborn, OH | 2.0 | 1.0 | 908 | $1,200 | $1.32 | 14d | 1 | 0.83mi |
| 1529 Miami Ave Fairborn, OH | 2.0 | 1.0 | 900 | $1,000 | $1.11 | 3d | 1 | 1.28mi |
| 1527 Miami Ave Fairborn, OH | 2.0 | 1.0 | 900 | $1,100 | $1.22 | 3d | 1 | 1.29mi |
| 388 Morris Dr Unit 390 Fairborn, OH | 2.0 | 1.0 | 900 | $1,100 | $1.22 | 44d | 1 | 1.36mi |
| 165 W Funderburg Rd Fairborn, OH | 2.0 | 1.0 | 827 | $995 | $1.20 | 2d | 2 | 1.36mi |
| 281 Orville St Fairborn, OH | 2.0 | 1.0 | 850 | $899 | $1.06 | 14d | 1 | 1.40mi |
| 408 Patterson St Fairborn, OH | 3.0 | 1.0 | 988 | $1,400 | $1.42 | 11d | 1 | 1.41mi |
| 1647 Stewart Blvd Unit 1645 Fairborn, OH | 2.0 | 1.5 | 1024 | $900 | $0.88 | 23d | 1 | 1.42mi |
| 221 N Central Ave Fairborn, OH | 2.0 | 1.0 | 693 | $1,201 | $1.73 | 2d | 3 | 1.47mi |
| 18 Old Yellow Springs Rd Fairborn, OH | 1.0–3.0 | 1.0–2.0 | 805 | $1,200 | $1.49 | 14d | 9 | 1.49mi |
Listing history 3 events
-
2026-06-17status $169,900 Pending 1 DOM
-
2026-06-16remarks 699-char remark
-
2026-06-16$169,900 Active 1 DOM
ⓘ Source: listings_history table (triggers on properties + properties_extension) + one-shot
backfill from property_details.listing_events for pre-trigger history.
Tax reassessment forecast OH · Partial reset (capped growth)
- Current annual tax
- $1,049 · $87/mo
- Projected year-2 tax
- $1,850 · $154/mo
- Expected delta
- +$801/yr (+$67/mo · 76.3%)
ⓘ Screening estimate from a state-policy table — verify with the county assessor before closing.
Climate risk First Street
- Flood 1/10 Low FEMA zone X (unshaded) · 0% chance over 30 yrs
- Wildfire 1/10 Low
- Heat 3/10 Moderate 7 d/yr ≥101°F today · 18 d/yr by 30 yrs out
- Wind 2/10 Low 0% chance of damaging wind over 30 yrs
- Air quality 4/10 Moderate 4 unhealthy d/yr today · 5 by 30 yrs out
Nearby sold comps map
Loading sold comps map…
Walkable amenities ~0.75 mi
Loading nearby amenities…
Taxation est. · year 1
- Rental income
- $16,023
- − Mortgage interest
- −$9,517
- − Property taxes
- −$1,049
- − Insurance
- −$850
- − Repairs & maintenance
- −$1,282
- − Management
- −$1,282
- − Depreciation
- −$4,943
- Taxable loss
- −$2,899
- Est. tax savings @ 24.0%
- +$696
- After-tax cash flow
- $764/yr
For passive investors: Depreciation is non-cash, so a rental often shows a tax loss while cash-flowing — sheltering income. Rental losses are passive: they offset passive income freely, and up to $25,000/yr can offset ordinary (W-2) income if you actively participate and your MAGI is under $100k (phasing out to $0 by $150k); unused losses carry forward. On sale, claimed depreciation is recaptured at up to 25%, and gains may owe capital-gains tax (a 1031 exchange can defer both). Figures are a year-1 estimate at your 24.0% rate — not tax advice; consult a CPA.
Schools (NCES district)
- District
- Fairborn City
- NCES district ID
- 3904396
- Math proficiency
- 36% ▼ -17.00%
- Reading proficiency
- 49% ▼ -10.00%
- Median HH income
- $45,091
- Composite
- 36.05/100
- National rank
- #4772
- State rank
- #520 of 656 in OH
Livability — Fairborn
- Score
- 72/100
- State rank
- #374
- US rank
- #6101
Category grades
Schools grade is shown separately in the Schools card above.
Census & demographics
- Census place
- Fairborn, OH
- County
- Greene County · 132,120 people
- City population
- 41,194
- Metro
- Dayton-Kettering, OH
- Population (ZIP)
- 41,194
- Household income
- $64,979
- Rent vs Own
- Severe rent burden
- 1472.0
Population outlook (Greene County) Hauer SSP2
- Today (2025)
- 170,301 people
- By 2030
- 171,840 · +0.9%
- By 2040
- 171,408 · +0.7%
- By 2050
- 167,806 · -1.5%
- By 2075
- 154,430 · -9.3%
- By 2100
- 138,669 · -18.6%
Race, ethnicity, and origin ACS 2023
- Neighborhood character
- Predominantly White (78%)
- Race & ethnicity
- White 78% Two or more races 9% Black 8% Hispanic / Latino 3% Asian 2%
- Common ancestry
- Lithuanian 2% Slovak 2% Italian 1%
- Foreign-born
- 6% · Canada, China
- Languages at home
- 94% English-only · Spanish 1% German/W. Germanic 1% Other Indo-European 1%
Political lean MEDSL · Greene
- 2024 margin
- R (+19.8) · D 39.5% · R 59.3% · Other 1.2%
- 2008→2024 swing
- -1.4pp toward R · 2008: -18.4pp · 2024: -19.8pp
- All cycles
- 2024: R+19.8 2020: R+19.5 2016: R+24.5 2012: R+21.8 2008: R+18.4
Not yet ingested
- Civics
- —
Market trends
- HPI YoY
- ▼ -157.48%
- Current HPI
- 228.0801
- Rent YoY
- ▲ 5.75%
- Metro
- Dayton-Kettering, OH
- State GDP YoY
- ▲ 1.98%
- F500 in state
- 48
Industry mix (Fortune 500 HQ in OH)
| Industry | F500 HQs | Revenue |
|---|---|---|
| Insurance | 3 | $145B |
|
||
| Industrial Machinery | 3 | $49B |
|
||
| Financial Services | 3 | $24B |
|
||
| Consumer Goods | 2 | $93B |
|
||
| Aerospace / Defense | 2 | $47B |
|
||
| Utilities | 2 | $33B |
|
||
Price history
1 event — show timeline
- 2026-06-16 Listed $169,900 Dayton MLS
Property tax history
-1.2%/yrLatest (2025): $1,049 · -32.4% YoY. Source: county tax records.
Cash-flow waterfall
monthlySold comps — $/sqft
last 12 mo · ≤1 miLoading sold comps…