 🏷️ Likely Rental
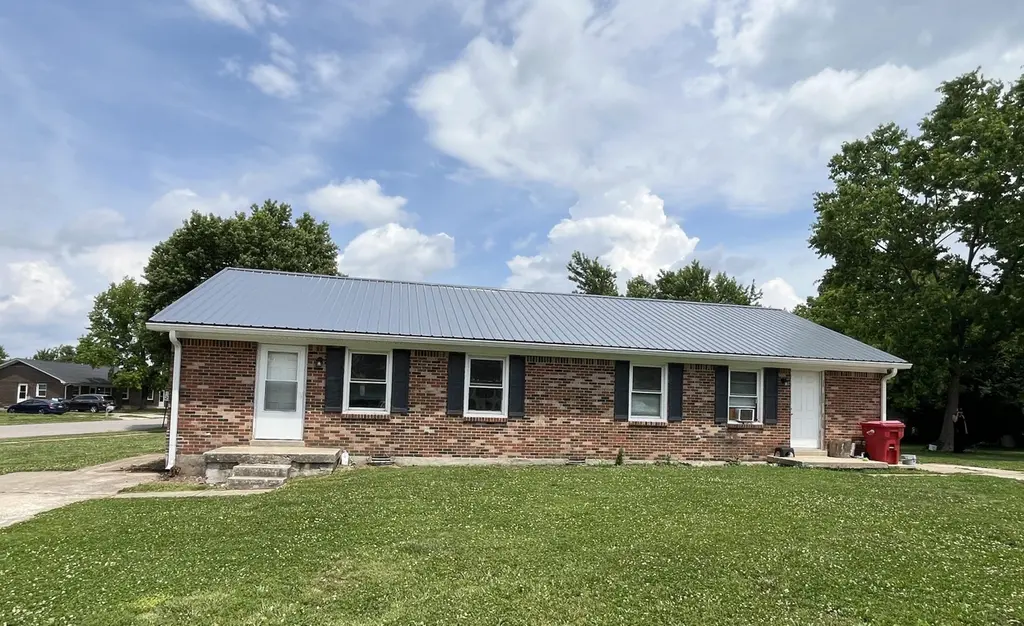
200 Longview Dr · Nicholasville, KY
Flood risk 1/10 · Minimal
- FEMA flood zone
- X (unshaded)
- Chance of flooding over 30 yrs
- 0.0%
- Est. flood insurance / yr
- $507 – $1,088
Fire risk 3/10 · Minor
- Est. fire insurance / yr
- $839 – $1,559
Heat risk 4/10 · Minor
- Hot days now (above 102°F)
- 7 days/yr
- Hot days in 30 yrs
- 19 days/yr
Wind risk 2/10 · Minimal
- Chance of severe wind over 30 yrs
- 4.0%
Air-quality risk 1/10 · Minimal
- Unhealthy air days now
- 0 days/yr
- Unhealthy air days in 30 yrs
- 0 days/yr
Risk factors via First Street. Map © Google.
Why this score? — see what drove the D+ grade
The composite is a weighted blend of 9 inputs, each scored 0–100. Each bar is that input's sub-score; the figure is the points it added to the 100-point composite (weight × sub-score).
- ARV discount +15.0/15.0
- Cash flow +13.2/30.0
- Rent growth +4.4/5.0
- DSCR +4.0/10.0
- 1% rule +3.7/10.0
- Schools +3.3/10.0
- Livability +3.3/5.0
- Condition / age +2.8/5.0
- Appreciation +0.0/10.0
$234,900
🖨 Deal sheet (PDF) 📄 Offer letter ✓ Due diligence
Listing remarks
Nicely maintained investment property in the heart of Nicholasville! This One Owner duplex features two 2-bedrooms, 1-bath units situated on a desirable corner lot just two blocks from the city park. One side is currently tenant occupied providing immediate rental income, while the vacant unit offers the perfect opportunity for an owner-occupant or additional rental potential. Partial upgrades have already been completed, adding value and appeal. Convenient location close to shopping, dining, schools, and downtown amenities. A solid income-producing property with room for continued improvement and increased returns.
Key facts
- Tenant occupied
- Partial upgrades
- Corner lot
Tags
Property features AI
Exterior
- Parking: Driveway parking; Off-street parking
- Utilities: Public water; Public sewer; Electricity connected; Water connected; Cable available; Phone available
- Home design: Duplex; One story
- Construction: Brick veneer exterior; Metal roof; Block foundation
- Exterior features: Brick veneer construction; Metal roof; Block foundation
Interior
- Kitchen: Refrigerator; Range
- Flooring: Laminate
- Bathrooms: 2 full bathrooms
- Heating & cooling: Ceiling heating; Has heating
- Interior features: Eat-in kitchen; Crawl space basement; No fireplace
- Laundry & utility: Washer hookup; Electric dryer hookup
Neighborhood map
What this means for you Summary
Snapshot
- This is a 4-bed/2.0-bath single-family listed at $235k. Condition is rated average.
Deal economics
- At list price, monthly cash flow is $-5 ($-60/yr) — negative.
- To cash-flow at today's rent, offer at most $234k (0.3% below list).
- To meet the 1% rule (rent ≥ 1% of price), the offer needs to be $205k (12.8% below list).
- Recommended offer: $205k (12.8% below list) — sets the bar for 1% rule.
- Cap rate 6.3% vs local median 3.4% in Nicholasville — top-decile yield for the area; either an underpriced asset or a hidden risk that comps aren't pricing in. Stress-test before assuming the spread holds.
Location & tenants
- Location reads 66/100 on livability (#231 in KY) — a middle-class / working-renter tenant base. Strengths: cost of living A+, housing A+, crime A; Watch: employment C-, amenities F, commute F.
- Jessamine County (town): math 31% / reading 45% proficiency, ranked #37 of 165 in KY (top 22%) — families likely to look elsewhere, expect single-tenant / working-renter base with shorter leases.
- Zoned schools: Nicholasville Elementary School (math 26% / reading 38%, grade F, #348 of 676 statewide, top 55%, 455 students, 62% FRL); East Jessamine Middle School (math 23% / reading 44%, grade F, #105 of 217 statewide, top 51%, 936 students, 56% FRL); East Jessamine High School (math 26% / reading 38%, grade F, #97 of 254 statewide, top 46%, 1,173 students, 57% FRL).
- Market conditions: Rents rising fast (+7.5%/yr); 502 active listings in the ZIP; 3 comparable units currently listed for rent nearby; rentals at typical pace (median 25d on market — plan ~3-4 weeks tenant-placement turnaround); 267 units permitted in Jessamine County in 2024 (9 in 5+ unit buildings).
- This rent runs 33% of the median local income ($74k/yr) — at the standard rent-burdened threshold; future hikes will face affordability resistance.
Forward outlook
- Local home prices are declining (-3.0%/yr); year-one equity from $2k of loan paydown is wiped out by about $7k of value loss. Plan a longer hold.
- Jessamine County population projected at +22% by 2050 — long-run rental-demand tailwind backs the buy-and-hold thesis.
Negotiation context
- Only 5 days on market — expect competitive offers; lowballing is unlikely to land.
Questions for the listing agent
- What do current leases actually rent for vs. the listed asking? Can we see a recent rent roll and the last 12 months of T-12 income?
- Built in 1976 — when were the roof, HVAC, electrical panel, plumbing, and water heater last replaced?
- Is there a deadline driving the sale (1031 exchange, divorce, estate, relocation)? That informs how much negotiation room exists.
- Schools are D-rated, which usually means shorter tenancies and higher turnover. Who's the typical renter profile here, and what's been the actual vacancy rate?
- The area grade is low — what's the realistic commute time and amenity access for the typical tenant pool here? Any planned neighborhood developments (good or bad) we should know about?
- What's the average days-on-market for RENTAL listings here right now (not sales)? A rising rental-DOM trend means longer vacancies and softer asking-rent achievability than the comps imply.
- What's the recent tenant-quality profile in this submarket — average credit score on applications, eviction rate, late-payment / NSF rate, and stable-employment percentage? A property-management company in the area should have these aggregated.
- How much new for-sale + rental construction is in the pipeline within 1–3 miles? Heavy new supply typically softens prices + rents 12–24 months out; constrained supply supports both.
Investment metrics
- 1% rule
- 0.87% ✗
- Cap rate
- 6.27%
- Cash-on-cash
- -0.09%
- DSCR
- 1.00
- GRM
- 9.6
CMA / ARV
- ARV (on-the-fly)
- $314,650
- Comps found
- 12
Show comp detail 12 sales within ~0.75 mi
| Address | Dist | Beds/Ba | Sqft | Sold | Price | $/sf | Match |
|---|---|---|---|---|---|---|---|
| 160 Shannon Pkwy | 0.34mi | 4/2.0 | 1,750 (-3%) | 1mo | $286,425 | $164 | 79 |
| 218 Kimberly Heights Dr | 0.36mi | 4/2.0 | 1,694 (-6%) | 9mo | $299,900 | $177 | 66 |
| 108 Winners Cir | 0.29mi | 3/2.0 (-1) | 1,641 (-9%) | 2mo | $328,000 | $200 | 65 |
| 106 Magnolia Way | 0.14mi | 3/2.0 (-1) | 1,564 (-13%) | 6mo | $296,900 | $190 | 62 |
| 164 Shannon Pkwy | 0.34mi | 3/2.5 (-1) | 1,729 (-4%) | 12mo | $246,000 | $142 | 61 |
| 151 Shannon Pkwy | 0.38mi | 3/2.5 (-1) | 1,710 (-5%) | 11mo | $250,000 | $146 | 58 |
| 121 Winners Cir | 0.34mi | 5/2.5 (+1) | 2,000 (+11%) | 6mo | $350,000 | $175 | 54 |
| 209 Winners Cir | 0.28mi | 3/2.5 (-1) | 2,065 (+15%) | 7mo | $319,000 | $154 | 49 |
| 112 Janice Dr | 0.47mi | 3/2.0 (-1) | 1,568 (-13%) | 6mo | $314,000 | $200 | 47 |
| 613 Williams Rd | 0.65mi | 3/2.0 (-1) | 1,610 (-10%) | 5mo | $308,000 | $191 | 44 |
| 224 Vicksburg Dr | 0.52mi | 3/3.0 (-1) | 2,022 (+12%) | 6mo | $237,000 | $117 | 40 |
| 413 Linden Ln | 0.71mi | 3/1.5 (-1) | 1,596 (-11%) | 10mo | $200,000 | $125 | 33 |
Match score weights: distance 35% · size 25% · config 20% · recency 20%. Top-matched comps best support the ARV.
Projected returns pro-forma
-3.0% appreciation · 7.5% rent growth · sell at horizon
- IRR
- -11.5%
- Equity multiple
- 0.56×
- Total profit
- $-28,656
- Equity at exit
- $35,024
- IRR
- 3.2%
- Equity multiple
- 1.28×
- Total profit
- $18,428
- Equity at exit
- $20,310
Cash invested: $65,772 (down + closing). Projections, not guarantees.
Landlord ↔ Tenant lean methodology
- Overall (STATE)
- 83 Strongly Landlord-Friendly
- State Kentucky
- 83 Strongly Landlord-Friendly · R+16
- County
- — inherits STATE
- City
- — inherits STATE
ZIP-level market 40356
- Home prices YoY
- -18.6%
- Rents YoY
- 7.5%
- Active inventory
- 502
- Price-to-rent
- 9.6×
Monthly cashflow live
- Estimated rent
- $2,049 medium interval (Pro) →
- Mortgage (P&I)
- −$1,232
- Tax est. 1.5%
- −$294 /mo · $3,524/yr
- Insurance
- −$98
- HOA
- −$0
- Vacancy / Maint / Mgmt
- −$430
- Net cashflow
- $-5
Break-even live
Sensitivity live
| Price | -10% $157 | -5% $76 | +0% $-5 | +5% $-86 | +10% $-167 |
|---|---|---|---|---|---|
| Rent | -10% $-167 | -5% $-86 | +0% $-5 | +5% $76 | +10% $157 |
| Rate | -1.0pp $113 | -0.5pp $55 | base $-5 | +0.5pp $-66 | +1.0pp $-128 |
UW: 25.0% down · 7.5% · 30yr · 1.5% tax · 5.0% vac · 8.0% maint · 8.0% mgmt
Financing live
Cash to close
- Down payment
- $58,725
- Closing costs
- $7,047
- Reserves months
- —
- Total cash needed
- —
Loan-product check · same deal, 3 products live
Conventional
25% down · 7.5% · 30yr
- Down + closing
- —
- Monthly P&I
- —
- Monthly cashflow
- —
- DSCR
- —
- Eligible?
- —
Personal DTI + credit; lowest rate.
DSCR
20% down · 8.5% · 30yr
- Down + closing
- —
- Monthly P&I
- —
- Monthly cashflow
- —
- DSCR
- —
- Eligible?
- —
No personal income docs; deal must DSCR.
Hard money
10% down · 12.0% · 12mo
- Down + closing
- —
- Monthly P&I
- —
- Monthly cashflow
- —
- DSCR
- —
- Eligible?
- —
Short-term bridge; refi at stabilization.
Rent comps 3 comps
| Address | Beds | Baths | Sqft | Rent | $/sqft | DOM | Units | Dist |
|---|---|---|---|---|---|---|---|---|
| 108 Winners Cir Nicholasville, KY | 3.0 | 2.0 | 1641 | $2,100 | $1.28 | 23d | 1 | 0.31mi |
| 516 S Main St Unit 1 Nicholasville, KY | 3.0 | 2.5 | 1454 | $1,850 | $1.27 | 25d | 1 | 0.67mi |
| 136 Lowell Ct Nicholasville, KY | 3.0 | 2.5 | 1480 | $1,750 | $1.18 | 25d | 1 | 0.73mi |
Listing history 7 events
-
2026-06-07status $234,900 Pending 5 DOM
-
2026-06-03days on market $234,900 Active 5 DOM
-
2026-06-02days on market $234,900 Active 4 DOM
-
2026-06-01days on market $234,900 Active 3 DOM
-
2026-06-01status $234,900 Active 2 DOM
-
2026-05-21status Pending
-
2026-05-19$234,900 Active
ⓘ Source: listings_history table (triggers on properties + properties_extension) + one-shot
backfill from property_details.listing_events for pre-trigger history.
Climate risk First Street
- Flood 1/10 Low FEMA zone X (unshaded) · 0% chance over 30 yrs
- Wildfire 3/10 Moderate
- Heat 4/10 Moderate 7 d/yr ≥102°F today · 19 d/yr by 30 yrs out
- Wind 2/10 Low 4% chance of damaging wind over 30 yrs
- Air quality 1/10 Low 0 unhealthy d/yr today · 0 by 30 yrs out
Nearby sold comps map
Loading sold comps map…
Walkable amenities ~0.75 mi
Loading nearby amenities…
Taxation est. · year 1
- Rental income
- $24,582
- − Mortgage interest
- −$13,158
- − Property taxes
- −$3,524
- − Insurance
- −$1,174
- − Repairs & maintenance
- −$1,967
- − Management
- −$1,967
- − Depreciation
- −$6,833
- Taxable loss
- −$4,040
- Est. tax savings @ 24.0%
- +$970
- After-tax cash flow
- $910/yr
For passive investors: Depreciation is non-cash, so a rental often shows a tax loss while cash-flowing — sheltering income. Rental losses are passive: they offset passive income freely, and up to $25,000/yr can offset ordinary (W-2) income if you actively participate and your MAGI is under $100k (phasing out to $0 by $150k); unused losses carry forward. On sale, claimed depreciation is recaptured at up to 25%, and gains may owe capital-gains tax (a 1031 exchange can defer both). Figures are a year-1 estimate at your 24.0% rate — not tax advice; consult a CPA.
Condition & rehab AI · 4 photos
A moderately maintained single-family home with average exterior and interior conditions. It offers a good investment opportunity with potential for moderate renovations to increase its resale and rental value.
Repairs flagged
- Minor Brick exterior — Some discoloration
- Minor Landscaping — Needs trimming
Value-add opportunities
- Both Paint interior walls — Enhances curb appeal and interior aesthetics
- Both Landscaping — Improves curb appeal and enhances property value
- Both HVAC maintenance — Ensures comfort and energy efficiency
- Both Interior paint — Enhances interior aesthetics and value
Renovation cost estimate screening
| Repair item | Severity | Est. cost |
|---|---|---|
| Brick exterior · Some discoloration | Minor | $500–3,000 |
| Landscaping · Needs trimming | Minor | $500–3,000 |
| Total estimated repair cost · 2 items | $1,000–6,000 |
Value-add ROI direction
- Both Paint interior walls — Enhances curb appeal and interior aesthetics ↑
- Both Landscaping — Improves curb appeal and enhances property value ↑
- Both HVAC maintenance — Ensures comfort and energy efficiency ↑
- Both Interior paint — Enhances interior aesthetics and value ↑
ⓘ Cost ranges are severity-bucket heuristics (US national rule-of-thumb). Get contractor quotes + a written scope before underwriting a rehab budget.
Schools (NCES district)
- District
- Jessamine County
- NCES district ID
- 2103030
- Math proficiency
- 31% ▼ -14.00%
- Reading proficiency
- 45% ▼ -12.00%
- Median HH income
- $50,249
- Composite
- 32.81/100
- National rank
- #5623
- State rank
- #37 of 165 in KY
Livability — Nicholasville
- Score
- 66/100
- State rank
- #231
- US rank
- #11266
Category grades
Schools grade is shown separately in the Schools card above.
Census & demographics
- Census place
- Nicholasville, KY
- County
- Jessamine County · 45,849 people
- City population
- 45,849
- Metro
- Lexington-Fayette, KY
- Population (ZIP)
- 45,849
- Household income
- $74,495
- Rent vs Own
- Severe rent burden
- 1186.0
Population outlook (Jessamine County) Hauer SSP2
- Today (2025)
- 58,419 people
- By 2030
- 61,468 · +5.2%
- By 2040
- 66,952 · +14.6%
- By 2050
- 71,357 · +22.1%
- By 2075
- 80,325 · +37.5%
- By 2100
- 83,848 · +43.5%
Race, ethnicity, and origin ACS 2023
- Neighborhood character
- Predominantly White (86%)
- Race & ethnicity
- White 86% Hispanic / Latino 5% Two or more races 5% Black 4% Asian 2%
- Common ancestry
- Italian 2% Subsaharan African 2% Slovak 2%
- Foreign-born
- 4% · Canada
- Languages at home
- 93% English-only · Spanish 4% Russian/Polish/Slavic 2% Other Asian/Pacific 1%
Political lean MEDSL · Jessamine
- 2024 margin
- Solid R (+35.9) · D 31.2% · R 67.0% · Other 1.8%
- 2008→2024 swing
- +1.1pp toward D · 2008: -37.0pp · 2024: -35.9pp
- All cycles
- 2024: R+35.9 2020: R+32.5 2016: R+40.0 2012: R+39.9 2008: R+37.0
Not yet ingested
- Civics
- —
Market trends
- HPI YoY
- ▼ -61.88%
- Current HPI
- 270.2432
- Rent YoY
- ▲ 7.50%
- Metro
- Lexington-Fayette, KY
- State GDP YoY
- ▲ 1.81%
- F500 in state
- 4
Industry mix (Fortune 500 HQ in KY)
| Industry | F500 HQs | Revenue |
|---|---|---|
| Healthcare | 1 | $118B |
|
||
| Food / Beverage | 1 | $7B |
|
||
Price history
2 events — show timeline
- 2026-05-21 Pending — ImagineMLS
- 2026-05-19 Listed $234,900 ImagineMLS
Cash-flow waterfall
monthlySold comps — $/sqft
last 12 mo · ≤1 miLoading sold comps…