982 Falkenberg Rd · Brick, NJ
Flood risk 1/10 · Minimal
- FEMA flood zone
- X (unshaded)
- Chance of flooding over 30 yrs
- 0.0%
- Est. flood insurance / yr
- $507 – $1,088
Fire risk 3/10 · Minor
- Est. fire insurance / yr
- $526 – $976
Heat risk 7/10 · Major
- Hot days now (above 98°F)
- 7 days/yr
- Hot days in 30 yrs
- 15 days/yr
Wind risk 7/10 · Major
- Chance of severe wind over 30 yrs
- 78.0%
Air-quality risk 3/10 · Minor
- Unhealthy air days now
- 3 days/yr
- Unhealthy air days in 30 yrs
- 5 days/yr
Risk factors via First Street. Map © Google.
Why this score? — see what drove the D grade
The composite is a weighted blend of 9 inputs, each scored 0–100. Each bar is that input's sub-score; the figure is the points it added to the 100-point composite (weight × sub-score).
- ARV discount +15.0/15.0
- Cash flow +11.0/30.0
- DSCR +3.2/10.0
- 1% rule +2.9/10.0
- Schools +2.8/10.0
- Rent growth +2.5/5.0
- Livability +2.5/5.0
- Condition / age +2.5/5.0
- Appreciation +0.0/10.0
$295,000
🖨 Deal sheet 📄 Offer letter ✓ Due diligence
Listing remarks MLS
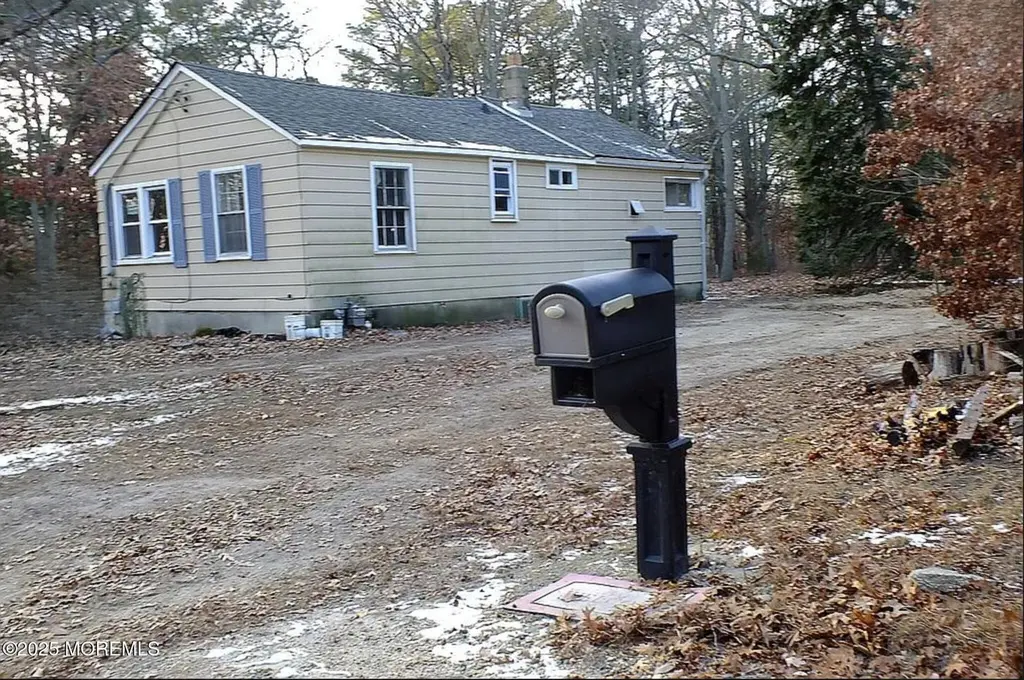
Opportunity meets potential on this rare half-acre parcel offering exceptional flexibility and upside. Zoned Hospital Support/Residential, this property offers flexibility for redevelopment, renovation, rental potential, or professional use. Set at the end of a quiet road for added privacy, the existing structure includes approx. 1,080 sq ft and a full walk-in basement— providing a strong foundation for transformation. Location matters, and this one delivers with close proximity to hospitals, commercial hubs, and major commuter routes. Sold strictly as-is. Bring your plans, your creativity, and your strategy — opportunities with this level of flexibility and positioning are increasingly hard to find.
Key facts
- Half-acre parcel
- 0.46 acre lot
- Built 1940
Tags
Neighborhood map
What this means for you Summary
Snapshot
- This is a 2-bed/1.0-bath single-family listed at $295k.
Deal economics
- At list price, monthly cash flow is $-126 ($-2k/yr) — negative.
- To cash-flow at today's rent, offer at most $273k (7.5% below list).
- To meet the 1% rule (rent ≥ 1% of price), the offer needs to be $233k (21.2% below list).
- Recommended offer: $233k (21.2% below list) — sets the bar for 1% rule.
Location & tenants
- Location reads: area grade D — affects rentability + tenant quality, not the cash-flow math above.
- Brick Township Public School District (suburban): math 18% / reading 43% proficiency, ranked #330 of 472 in NJ (top 70%) — families likely to look elsewhere, expect single-tenant / working-renter base with shorter leases.
- Market conditions: 284 active listings in the ZIP; 6 comparable units currently listed for rent nearby; rentals at typical pace (median 25d on market — plan ~3-4 weeks tenant-placement turnaround); 4,434 units permitted in Ocean County in 2024 (868 in 5+ unit buildings).
Forward outlook
- Local home prices are declining (-3.0%/yr); year-one equity from $2k of loan paydown is wiped out by about $9k of value loss. Plan a longer hold.
- Ocean County population projected to shrink 8% by 2050 — rents likely to lag national; underwrite the cash flow, not the appreciation.
Negotiation context
- It's been on market 119 days — a 9% lower offer ($268k) is reasonable based on typical stale-listing flexibility.
- 5 sale attempts since 18y ago with the ask held roughly flat each time — persistent listings suggest the price (not the market) is what's stuck; bring a comps-based counter.
- Current owner paid $155k; list at $295k implies a 90% gain — meaningful room to come down on a strong offer.
Risks & watch-outs
- Watch-outs: built in 1940 — expect roof / HVAC / electrical / plumbing capex.
- Climate carrying-cost: major wind risk, 78% chance of damaging wind over 30y; extreme-heat days projected 7→15/yr by 2055 (HVAC capex compounding) — expect insurance premiums to compound above CPI over the hold.
Questions for the listing agent
- What do current leases actually rent for vs. the listed asking? Can we see a recent rent roll and the last 12 months of T-12 income?
- It's been on market 119 days. Have you received any prior offers? Is the seller open to a 21% concession, seller financing, or rate buy-down credit?
- Built in 1940 — when were the roof, HVAC, electrical panel, plumbing, and water heater last replaced?
- Why hasn't it sold? Are there any deal-killer items the seller is aware of (foundation, flood, title, zoning, code violations)?
- Is there a deadline driving the sale (1031 exchange, divorce, estate, relocation)? That informs how much negotiation room exists.
- The area grade is low — what's the realistic commute time and amenity access for the typical tenant pool here? Any planned neighborhood developments (good or bad) we should know about?
- What's the average days-on-market for RENTAL listings here right now (not sales)? A rising rental-DOM trend means longer vacancies and softer asking-rent achievability than the comps imply.
- What's the recent tenant-quality profile in this submarket — average credit score on applications, eviction rate, late-payment / NSF rate, and stable-employment percentage? A property-management company in the area should have these aggregated.
- How much new for-sale + rental construction is in the pipeline within 1–3 miles? Heavy new supply typically softens prices + rents 12–24 months out; constrained supply supports both.
Investment metrics
- 1% rule
- 0.79% ✗
- Cap rate
- 5.78%
- Cash-on-cash
- -1.83%
- DSCR
- 0.92
- GRM
- 10.6
CMA / ARV
- ARV (median comp)
- $455,800
- List price
- $295,000
- Delta
- -35.28%
- Verdict
- UNDERPRICED
- Comps
- 20 within 1.0 mi
Show comp detail 12 sales within ~0.75 mi
| Address | Dist | Beds/Ba | Sqft | Sold | Price | $/sf | Match |
|---|---|---|---|---|---|---|---|
| 250 Nasto Ter | 0.24mi | 2/1.0 | 1,076 (-0%) | 13mo | $168,600 | $157 | 77 |
| 5 B Trl | 0.44mi | 2/1.0 | 1,000 (-7%) | 7mo | $87,000 | $87 | 61 |
| 109 John St | 0.31mi | 3/1.0 (+1) | 1,103 (+2%) | 19mo | $410,000 | $372 | 61 |
| 120 Bruce St | 0.22mi | 3/2.0 (+1) | 1,150 (+6%) | 13mo | $550,000 | $478 | 59 |
| 8 Holmes Ct | 0.54mi | 2/1.0 | 966 (-11%) | 5mo | $399,900 | $414 | 53 |
| 17 Division St | 0.58mi | 2/1.0 | 996 (-8%) | 15mo | $385,000 | $387 | 47 |
| 10 Callaghan Rd | 0.58mi | 3/1.0 (+1) | 1,008 (-7%) | 13mo | $440,000 | $437 | 46 |
| 12 Dickinson Rd | 0.72mi | 2/1.0 | 966 (-11%) | 5mo | $350,000 | $362 | 45 |
| 4 Longfellow Ct | 0.66mi | 2/1.5 | 1,134 (+5%) | 18mo | $341,000 | $301 | 44 |
| 122 Besante Blvd | 0.60mi | 3/2.0 (+1) | 1,194 (+11%) | 8mo | $575,000 | $482 | 39 |
| 1718 Forge Pond Rd | 0.47mi | 3/2.0 (+1) | 1,228 (+14%) | 16mo | $475,000 | $387 | 32 |
| 9 Whitman St | 0.74mi | 2/1.0 | 966 (-11%) | 18mo | $322,500 | $334 | 32 |
Match score weights: distance 35% · size 25% · config 20% · recency 20%. Top-matched comps best support the ARV.
Projected returns pro-forma
-3.0% appreciation · 3.0% rent growth · sell at horizon
- IRR
- -19.3%
- Equity multiple
- 0.32×
- Total profit
- $-55,831
- Equity at exit
- $43,985
- IRR
- -12.0%
- Equity multiple
- 0.29×
- Total profit
- $-58,985
- Equity at exit
- $25,506
Cash invested: $82,600 (down + closing). Projections, not guarantees.
Landlord ↔ Tenant lean methodology
- Overall (STATE)
- 21 Tenant-Leaning
- State New Jersey
- 21 Tenant-Leaning · D+6
- County
- — inherits STATE
- City
- — inherits STATE
ZIP-level market 08724
- Active inventory
- 284
- Price-to-rent
- 10.6×
Monthly cashflow live
- Estimated rent
- $2,326 high interval (Pro) →
- Mortgage (P&I)
- −$1,547
- Tax from tax record
- −$293 /mo · $3,518/yr
- Insurance
- −$123
- HOA
- −$0
- Vacancy / Maint / Mgmt
- −$488
- Net cashflow
- $-126
Break-even live
UW: 25.0% down · 7.5% · 30yr · 1.5% tax · 5.0% vac · 8.0% maint · 8.0% mgmt
Financing live
Cash to close
- Down payment
- $73,750
- Closing costs
- $8,850
- Reserves months
- —
- Total cash needed
- —
Loan-product check · same deal, 3 products live
Conventional
25% down · 7.5% · 30yr
- Down + closing
- —
- Monthly P&I
- —
- Monthly cashflow
- —
- DSCR
- —
- Eligible?
- —
Personal DTI + credit; lowest rate.
DSCR
20% down · 8.5% · 30yr
- Down + closing
- —
- Monthly P&I
- —
- Monthly cashflow
- —
- DSCR
- —
- Eligible?
- —
No personal income docs; deal must DSCR.
Hard money
10% down · 12.0% · 12mo
- Down + closing
- —
- Monthly P&I
- —
- Monthly cashflow
- —
- DSCR
- —
- Eligible?
- —
Short-term bridge; refi at stabilization.
Rent comps 6 comps
| Address | Beds | Baths | Sqft | Rent | $/sqft | DOM | Units | Dist |
|---|---|---|---|---|---|---|---|---|
| 378 Kentwood Blvd Brick Township, NJ | 1.0–2.0 | 1.0 | 972 | $2,225 | $2.29 | 6d | 2 | 0.81mi |
| 47 Newport Ct Brick Township, NJ | 2.0 | 1.0 | 1022 | $2,100 | $2.05 | 24d | 1 | 0.98mi |
| 101 Prosper Way Brick Township, NJ | 2.0 | 2.0 | 1360 | $2,650 | $1.95 | 24d | 1 | 1.21mi |
| 101 Prosper Way Brick Township, NJ | 2.0 | 2.0 | 1180 | $2,450 | $2.08 | 22d | 1 | 1.21mi |
| 2775 Hooper Ave Brick, NJ | 2.0 | 1.0 | 1100 | $2,300 | $2.09 | 24d | 1 | 1.23mi |
| 46 Patmore Rd Brick, NJ | 2.0 | 2.0 | 1280 | $2,400 | $1.88 | 18d | 1 | 1.39mi |
Listing history 17 events
-
2026-06-09days on market $295,000 Active 119 DOM
-
2026-06-08days on market $295,000 Active 118 DOM
-
2026-06-07days on market $295,000 Active 117 DOM
-
2026-06-04days on market $295,000 Active 114 DOM
-
2026-06-03days on market $295,000 Active 113 DOM
-
2026-06-02days on market $295,000 Active 112 DOM
-
2026-06-01days on market $295,000 Active 111 DOM
-
2026-05-31days on market $295,000 Active 110 DOM
-
2026-02-10$295,000 Active 721-char remark
Show marketing remark (721 chars)
Opportunity meets potential on this rare half-acre parcel offering exceptional flexibility and upside. Zoned Hospital Support/Residential, this property offers flexibility for redevelopment, renovation, rental potential, or professional use. Set at the end of a quiet road for added privacy, the existing structure includes approx. 1,080 sq ft and a full walk-in basement— providing a strong foundation for transformation. Location matters, and this one delivers with close proximity to hospitals, commercial hubs, and major commuter routes. Sold strictly as-is. Bring your plans, your creativity, and your strategy — opportunities with this level of flexibility and positioning are increasingly hard to find.
-
2025-07-24status Pending
-
2025-05-02$299,000 Active
-
2018-05-01historical
-
2018-03-06$185,900 Active
-
2008-10-07$189,900
-
2008-03-01$209,900
-
2004-04-01soldstatus $155,000
-
1994-04-07soldstatus $100,000
ⓘ Source: listings_history table (triggers on properties + properties_extension) + one-shot
backfill from property_details.listing_events for pre-trigger history.
Tax reassessment forecast NJ · Partial reset (capped growth)
- Current annual tax
- $3,518 · $293/mo
- Projected year-2 tax
- $5,432 · $453/mo
- Expected delta
- +$1,914/yr (+$159/mo · 54.4%)
ⓘ Screening estimate from a state-policy table — verify with the county assessor before closing.
Climate risk First Street
- Flood 1/10 Low FEMA zone X (unshaded) · 0% chance over 30 yrs
- Wildfire 3/10 Moderate
- Heat 7/10 Severe 7 d/yr ≥98°F today · 15 d/yr by 30 yrs out
- Wind 7/10 Severe 78% chance of damaging wind over 30 yrs
- Air quality 3/10 Moderate 3 unhealthy d/yr today · 5 by 30 yrs out
Nearby sold comps map
Loading sold comps map…
Walkable amenities ~0.75 mi
Loading nearby amenities…
Taxation est. · year 1
- Rental income
- $27,907
- − Mortgage interest
- −$16,525
- − Property taxes
- −$3,518
- − Insurance
- −$1,475
- − Repairs & maintenance
- −$2,233
- − Management
- −$2,233
- − Depreciation
- −$8,582
- Taxable loss
- −$6,657
- Est. tax savings @ 24.0%
- +$1,598
- After-tax cash flow
- $87/yr
For passive investors: Depreciation is non-cash, so a rental often shows a tax loss while cash-flowing — sheltering income. Rental losses are passive: they offset passive income freely, and up to $25,000/yr can offset ordinary (W-2) income if you actively participate and your MAGI is under $100k (phasing out to $0 by $150k); unused losses carry forward. On sale, claimed depreciation is recaptured at up to 25%, and gains may owe capital-gains tax (a 1031 exchange can defer both). Figures are a year-1 estimate at your 24.0% rate — not tax advice; consult a CPA.
Schools (NCES district)
- District
- Brick Township Public School District
- NCES district ID
- 3402220
- Math proficiency
- 18% ▼ -24.00%
- Reading proficiency
- 43% ▼ -15.00%
- Median HH income
- $68,717
- Composite
- 28.31/100
- National rank
- #6785
- State rank
- #330 of 472 in NJ
Livability — Brick
No livability data for this city. (Only ~50 U.S. cities are tracked.)
Census & demographics
- City population
- 32,141
- Population (ZIP)
- 41,573
Population outlook (Ocean County) Hauer SSP2
- Today (2025)
- 586,991 people
- By 2030
- 581,403 · -1.0%
- By 2040
- 564,913 · -3.8%
- By 2050
- 538,149 · -8.3%
- By 2075
- 468,845 · -20.1%
- By 2100
- 350,297 · -40.3%
Race, ethnicity, and origin ACS 2023
- Neighborhood character
- Predominantly White (78%)
- Race & ethnicity
- White 78% Hispanic / Latino 11% Two or more races 7% Black 5% Asian 2%
- Hispanic origin (detail)
- Mexican 2% Puerto Rican 5%
- Common ancestry
- Romanian 8% Lithuanian 2% Slovak 1%
- Foreign-born
- 7% · Canada, Jamaica, China
- Languages at home
- 90% English-only · Spanish 5% Other Indo-European 1% Chinese 1%
Political lean MEDSL · Ocean
- 2024 margin
- Solid R (+36.0) · D 31.4% · R 67.4% · Other 1.2%
- 2008→2024 swing
- -17.6pp toward R · 2008: -18.4pp · 2024: -36.0pp
- All cycles
- 2024: R+36.0 2020: R+28.7 2016: R+34.0 2012: R+17.7 2008: R+18.4
Not yet ingested
- Civics
- —
Market trends
- HPI YoY
- ▼ -524.30%
- Current HPI
- 380.6136
- Rent YoY
- —
- Metro
- —
- State GDP YoY
- ▲ 2.05%
- F500 in state
- 34
Industry mix (Fortune 500 HQ in NJ)
| Industry | F500 HQs | Revenue |
|---|---|---|
| Consumer Goods | 3 | $31B |
|
||
| Pharmaceuticals | 2 | $153B |
|
||
| Technology | 2 | $21B |
|
||
| Insurance | 2 | $20B |
|
||
| Healthcare | 2 | $19B |
|
||
| Financial Services | 1 | $70B |
|
||
Price history
+195.0% since first listed9 events — show timeline
- 2026-02-10 Listed $295,000 MOMLS
- 2025-07-24 Pending — MOMLS
- 2025-05-02 Listed $299,000 MOMLS
- 2018-05-01 Delisted — MOMLS
- 2018-03-06 Listed $185,900 MOMLS
- 2008-10-07 Listed $189,900 MOMLS
- 2008-03-01 Listed $209,900 MOMLS
- 2004-04-01 Sold (Public Records) $155,000 Public Records
- 1994-04-07 Sold (Public Records) $100,000 Public Records
Property tax history
-3.1%/yrLatest (2025): $3,518 · -26.5% YoY. Source: county tax records.
Cash-flow waterfall
monthlySold comps — $/sqft
last 12 mo · ≤1 miLoading sold comps…