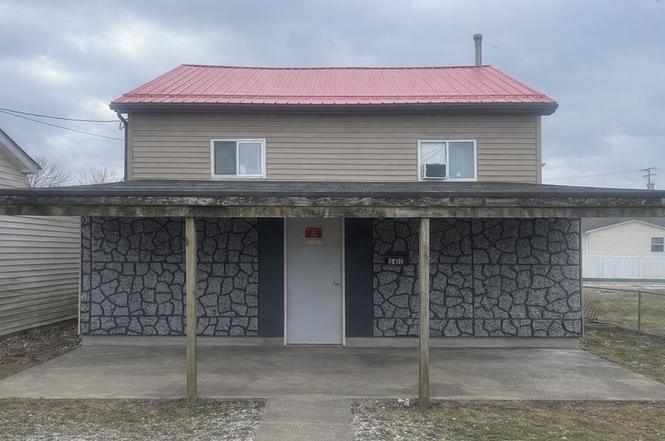
2415 Ohio St · Moundsville, WV
Flood risk 7/10 · Major
- FEMA flood zone
- X (unshaded)
- Chance of flooding over 30 yrs
- 0.76%
- Est. flood insurance / yr
- $473 – $860
Fire risk 1/10 · Minimal
- Est. fire insurance / yr
- $787 – $1,461
Heat risk 4/10 · Minor
- Hot days now (above 99°F)
- 7 days/yr
- Hot days in 30 yrs
- 20 days/yr
Wind risk 1/10 · Minimal
- Chance of severe wind over 30 yrs
- —
Air-quality risk 2/10 · Minimal
- Unhealthy air days now
- 1 days/yr
- Unhealthy air days in 30 yrs
- 3 days/yr
Risk factors via First Street. Map © Google.
Why this score? — see what drove the C- grade
The composite is a weighted blend of 9 inputs, each scored 0–100. Each bar is that input's sub-score; the figure is the points it added to the 100-point composite (weight × sub-score).
- Cash flow +16.2/30.0
- ARV discount +15.0/15.0
- DSCR +5.0/10.0
- 1% rule +4.4/10.0
- Livability +3.3/5.0
- Schools +2.7/10.0
- Rent growth +2.5/5.0
- Condition / age +2.5/5.0
- Appreciation +0.0/10.0
$109,000
🖨 Deal sheet (PDF) 📄 Offer letter ✓ Due diligence
Listing remarks
This unique property features a ground-level garage that's perfect for a workshop, hobby space, or extra storage — plus two full levels of living space above. The open-concept great room with vaulted ceilings creates an airy, inviting atmosphere ideal for entertaining or everyday living. With four spacious bedrooms, there's plenty of room for family, guests, or a home office setup. Conveniently located near shopping, gas stations, restaurants, and everyday amenities, this home offers both comfort and accessibility. Whether you're looking to customize, invest, or settle into a spacious layout with character, this property is full of opportunity.
Key facts
- Vaulted ceilings
- Ground-level garage
- Spacious layout
Tags
Property features AI
Exterior
- Parking: Attached garage with 4 spaces
- Utilities: Public water; Public sewer
- Home design: Single-family residence; Multi-level (2 stories)
- Construction: Vinyl siding; Metal roof
- Exterior features: Deck; Workshop
Interior
- Bathrooms: 1 full bathroom; 2 half bathrooms
- Heating & cooling: Natural gas heating; Wood heating; Window air conditioning units
- Interior features: Electric water heater; Wood-burning fireplace; 7 total rooms
Neighborhood map
What this means for you Summary
Snapshot
- This is a 3-bed/1.5-bath single-family listed at $109k.
Deal economics
- At list price, monthly cash flow is $2 ($24/yr) — positive.
- The deal already cash-flows at list — no discount required.
- To meet the 1% rule (rent ≥ 1% of price), the offer needs to be $103k (5.8% below list).
- Recommended offer: $99k (9.0% below list) — sets the bar for market timing.
- Cap rate 6.9% vs local median 4.7% in Moundsville — top-decile yield for the area; either an underpriced asset or a hidden risk that comps aren't pricing in. Stress-test before assuming the spread holds.
Location & tenants
- Location reads 66/100 on livability (#105 in WV) — a middle-class / working-renter tenant base. Strengths: cost of living A+, housing A-, health & safety A-; Watch: amenities F, commute F, employment F.
- Marshall County Schools (suburban): math 28% / reading 36% proficiency, ranked #21 of 55 in WV (top 38%) — families likely to look elsewhere, expect single-tenant / working-renter base with shorter leases.
- Zoned schools: Mcninch Primary School (340 students, 0% FRL); Moundsville Middle School (math 16% / reading 27%, grade F, #97 of 109 statewide, top 91%, 409 students, 0% FRL); John Marshall High School (math 22% / reading 49%, grade F, #41 of 110 statewide, top 37%, 1,046 students, 0% FRL) — zoned schools average 0% FRL vs 42% district-wide (42 pts lower); this property's tenant base skews higher-income than the district average.
- Market conditions: 78 active listings in the ZIP; 6 units permitted in Marshall County in 2024 (0 in 5+ unit buildings).
Forward outlook
- Local home prices are declining (-3.0%/yr); year-one equity from $754 of loan paydown is wiped out by about $3k of value loss. Plan a longer hold.
- Marshall County population projected at -19% by 2050 — secular population decline; favor cash flow + early exit over multi-decade hold.
Negotiation context
- It's been on market 109 days — a 9% lower offer ($99k) is reasonable based on typical stale-listing flexibility.
Risks & watch-outs
- Watch-outs: flood insurance adds $56/mo; built in 1920 — expect roof / HVAC / electrical / plumbing capex.
- Climate carrying-cost: major flood risk — expect insurance premiums to compound above CPI over the hold.
Questions for the listing agent
- It's been on market 109 days. Have you received any prior offers? Is the seller open to a 9% concession, seller financing, or rate buy-down credit?
- Built in 1920 — when were the roof, HVAC, electrical panel, plumbing, and water heater last replaced?
- What's the actual annual flood-insurance premium (NFIP or private), and is the property in a SFHA with mandatory coverage?
- Why hasn't it sold? Are there any deal-killer items the seller is aware of (foundation, flood, title, zoning, code violations)?
- Is there a deadline driving the sale (1031 exchange, divorce, estate, relocation)? That informs how much negotiation room exists.
- Schools are D-rated, which usually means shorter tenancies and higher turnover. Who's the typical renter profile here, and what's been the actual vacancy rate?
- What's the average days-on-market for RENTAL listings here right now (not sales)? A rising rental-DOM trend means longer vacancies and softer asking-rent achievability than the comps imply.
- What's the recent tenant-quality profile in this submarket — average credit score on applications, eviction rate, late-payment / NSF rate, and stable-employment percentage? A property-management company in the area should have these aggregated.
- How much new for-sale + rental construction is in the pipeline within 1–3 miles? Heavy new supply typically softens prices + rents 12–24 months out; constrained supply supports both.
Investment metrics
- 1% rule
- 0.94% ✗
- Cap rate
- 6.93%
- Cash-on-cash
- 2.26%
- DSCR
- 1.10
- GRM
- 8.9
CMA / ARV
- ARV (on-the-fly)
- $207,360
- Comps found
- 12
Show comp detail 12 sales within ~0.75 mi
| Address | Dist | Beds/Ba | Sqft | Sold | Price | $/sf | Match |
|---|---|---|---|---|---|---|---|
| 2213 4th St | 0.10mi | 3/2.0 | 2,082 (-4%) | 3mo | $220,000 | $106 | 84 |
| 2903 Glenwood Ave | 0.37mi | 4/2.5 (+1) | 2,147 (-1%) | 3mo | $219,000 | $102 | 71 |
| 312 Pine Ave | 0.17mi | 3/2.5 | 2,134 (-1%) | 20mo | $205,000 | $96 | 69 |
| 326 Poplar Ave | 0.10mi | 3/2.0 | 2,030 (-6%) | 18mo | $125,000 | $62 | 68 |
| 1707 Virginia St | 0.46mi | 3/3.0 | 2,121 (-2%) | 3mo | $165,000 | $78 | 68 |
| 316 Thorn Ave | 0.25mi | 4/1.0 (+1) | 1,870 (-13%) | 3mo | $172,000 | $92 | 57 |
| 1301 Fifth St | 0.71mi | 4/2.5 (+1) | 2,214 (+2%) | 1mo | $245,000 | $111 | 53 |
| 1222 Second St | 0.70mi | 3/2.0 | 2,128 (-2%) | 14mo | $115,000 | $54 | 52 |
| 118 Pine Ave | 0.39mi | 3/2.0 | 2,349 (+9%) | 18mo | $200,000 | $85 | 50 |
| 1312 7th St | 0.69mi | 4/2.0 (+1) | 2,054 (-5%) | 10mo | $234,000 | $114 | 44 |
| 1208 Center St | 0.74mi | 4/1.0 (+1) | 2,035 (-6%) | 6mo | $38,000 | $19 | 43 |
| 1507 Fifth St | 0.56mi | 4/1.5 (+1) | 1,854 (-14%) | 17mo | $180,000 | $97 | 31 |
Match score weights: distance 35% · size 25% · config 20% · recency 20%. Top-matched comps best support the ARV.
Projected returns pro-forma
-3.0% appreciation · 3.0% rent growth · sell at horizon
- IRR
- -16.1%
- Equity multiple
- 0.43×
- Total profit
- $-17,488
- Equity at exit
- $16,252
- IRR
- -7.7%
- Equity multiple
- 0.51×
- Total profit
- $-14,865
- Equity at exit
- $9,424
Cash invested: $30,520 (down + closing). Projections, not guarantees.
Landlord ↔ Tenant lean methodology
- Overall (STATE)
- 83 Strongly Landlord-Friendly
- State West Virginia
- 83 Strongly Landlord-Friendly · R+22
- County
- — inherits STATE
- City
- — inherits STATE
ZIP-level market 26041
- Home prices YoY
- -24.8%
- Active inventory
- 78
- Price-to-rent
- 8.9×
Monthly cashflow live
- Estimated rent
- $1,026 medium interval (Pro) →
- Mortgage (P&I)
- −$572
- Tax est. 1.5%
- −$136 /mo · $1,635/yr
- Insurance
- −$45
- Flood insurance flood zone
- −$56 /mo · $666/yr
- HOA
- −$0
- Vacancy / Maint / Mgmt
- −$216
- Net cashflow
- $2
Break-even live
Sensitivity live
| Price | -10% $77 | -5% $40 | +0% $2 | +5% $-36 | +10% $-73 |
|---|---|---|---|---|---|
| Rent | -10% $-79 | -5% $-39 | +0% $2 | +5% $43 | +10% $83 |
| Rate | -1.0pp $57 | -0.5pp $30 | base $2 | +0.5pp $-26 | +1.0pp $-55 |
UW: 25.0% down · 7.5% · 30yr · 1.5% tax · 5.0% vac · 8.0% maint · 8.0% mgmt
Financing live
Cash to close
- Down payment
- $27,250
- Closing costs
- $3,270
- Reserves months
- —
- Total cash needed
- —
Loan-product check · same deal, 3 products live
Conventional
25% down · 7.5% · 30yr
- Down + closing
- —
- Monthly P&I
- —
- Monthly cashflow
- —
- DSCR
- —
- Eligible?
- —
Personal DTI + credit; lowest rate.
DSCR
20% down · 8.5% · 30yr
- Down + closing
- —
- Monthly P&I
- —
- Monthly cashflow
- —
- DSCR
- —
- Eligible?
- —
No personal income docs; deal must DSCR.
Hard money
10% down · 12.0% · 12mo
- Down + closing
- —
- Monthly P&I
- —
- Monthly cashflow
- —
- DSCR
- —
- Eligible?
- —
Short-term bridge; refi at stabilization.
Listing history 15 events
-
2026-06-19days on market $109,000 Active 109 DOM
-
2026-06-18days on market $109,000 Active 108 DOM
-
2026-06-17days on market $109,000 Active 107 DOM
-
2026-06-16days on market $109,000 Active 106 DOM
-
2026-06-15days on market $109,000 Active 105 DOM
-
2026-06-14days on market $109,000 Active 103 DOM
-
2026-06-12days on market $109,000 Active 102 DOM
-
2026-06-09days on market $109,000 Active 99 DOM
-
2026-06-08days on market $109,000 Active 98 DOM
-
2026-06-07days on market $109,000 Active 97 DOM
-
2026-06-02days on market $109,000 Active 92 DOM
-
2026-06-01days on market $109,000 Active 91 DOM
-
2026-05-31days on market $109,000 Active 90 DOM
-
2026-05-30days on market $109,000 Active 89 DOM
-
2026-03-02$109,000 Active
ⓘ Source: listings_history table (triggers on properties + properties_extension) + one-shot
backfill from property_details.listing_events for pre-trigger history.
Climate risk First Street
- Flood 7/10 Severe FEMA zone X (unshaded) · 76% chance over 30 yrs
- Wildfire 1/10 Low
- Heat 4/10 Moderate 7 d/yr ≥99°F today · 20 d/yr by 30 yrs out
- Wind 1/10 Low
- Air quality 2/10 Low 1 unhealthy d/yr today · 3 by 30 yrs out
Nearby sold comps map
Loading sold comps map…
Walkable amenities ~0.75 mi
Loading nearby amenities…
Taxation est. · year 1
- Rental income
- $12,316
- − Mortgage interest
- −$6,106
- − Property taxes
- −$1,635
- − Insurance
- −$1,212
- − Repairs & maintenance
- −$985
- − Management
- −$985
- − Depreciation
- −$3,171
- Taxable loss
- −$1,778
- Est. tax savings @ 24.0%
- +$427
- After-tax cash flow
- $450/yr
For passive investors: Depreciation is non-cash, so a rental often shows a tax loss while cash-flowing — sheltering income. Rental losses are passive: they offset passive income freely, and up to $25,000/yr can offset ordinary (W-2) income if you actively participate and your MAGI is under $100k (phasing out to $0 by $150k); unused losses carry forward. On sale, claimed depreciation is recaptured at up to 25%, and gains may owe capital-gains tax (a 1031 exchange can defer both). Figures are a year-1 estimate at your 24.0% rate — not tax advice; consult a CPA.
Schools (NCES district)
- District
- Marshall County Schools
- NCES district ID
- 5400750
- Math proficiency
- 28% ▼ -6.00%
- Reading proficiency
- 36% ▼ -4.00%
- Median HH income
- $40,289
- Composite
- 26.91/100
- National rank
- #7086
- State rank
- #21 of 55 in WV
Livability — Moundsville
- Score
- 66/100
- State rank
- #105
- US rank
- #11553
Category grades
Schools grade is shown separately in the Schools card above.
Census & demographics
- Census place
- Moundsville, WV
- County
- Marshall · 16,750 people
- Metro
- Wheeling, WV-OH
- Population (ZIP)
- 15,706
- Household income
- $55,545
- Rent vs Own
- Severe rent burden
- 7.4
Population outlook (Marshall County) Hauer SSP2
- Today (2025)
- 30,387 people
- By 2030
- 29,242 · -3.8%
- By 2040
- 26,806 · -11.8%
- By 2050
- 24,627 · -19.0%
- By 2075
- 19,846 · -34.7%
- By 2100
- 15,169 · -50.1%
Race, ethnicity, and origin ACS 2023
- Neighborhood character
- Predominantly White (94%)
- Race & ethnicity
- White 94% Two or more races 3% Hispanic / Latino 1%
- Common ancestry
- Romanian 4% Iranian 2% Italian 1%
- Foreign-born
- 1% · Canada
- Languages at home
- 98% English-only · Spanish 1% German/W. Germanic 1%
Political lean MEDSL · Marshall
- 2024 margin
- Solid R (+50.0) · D 24.1% · R 74.1% · Other 1.8%
- 2008→2024 swing
- -37.5pp toward R · 2008: -12.6pp · 2024: -50.0pp
- All cycles
- 2024: R+50.0 2020: R+49.6 2016: R+51.0 2012: R+28.6 2008: R+12.6
Not yet ingested
- Civics
- —
Market trends
- HPI YoY
- ▼ -50.71%
- Current HPI
- 153.9522
- Rent YoY
- —
- Metro
- —
- State GDP YoY
- —
- F500 in state
- 0
Price history
1 event — show timeline
- 2026-03-02 Listed $109,000 WBOR
Property tax history
+5.4%/yrLatest (2025): $217 · +7.7% YoY. Source: county tax records.
Cash-flow waterfall
monthlySold comps — $/sqft
last 12 mo · ≤1 miLoading sold comps…