 Triplex
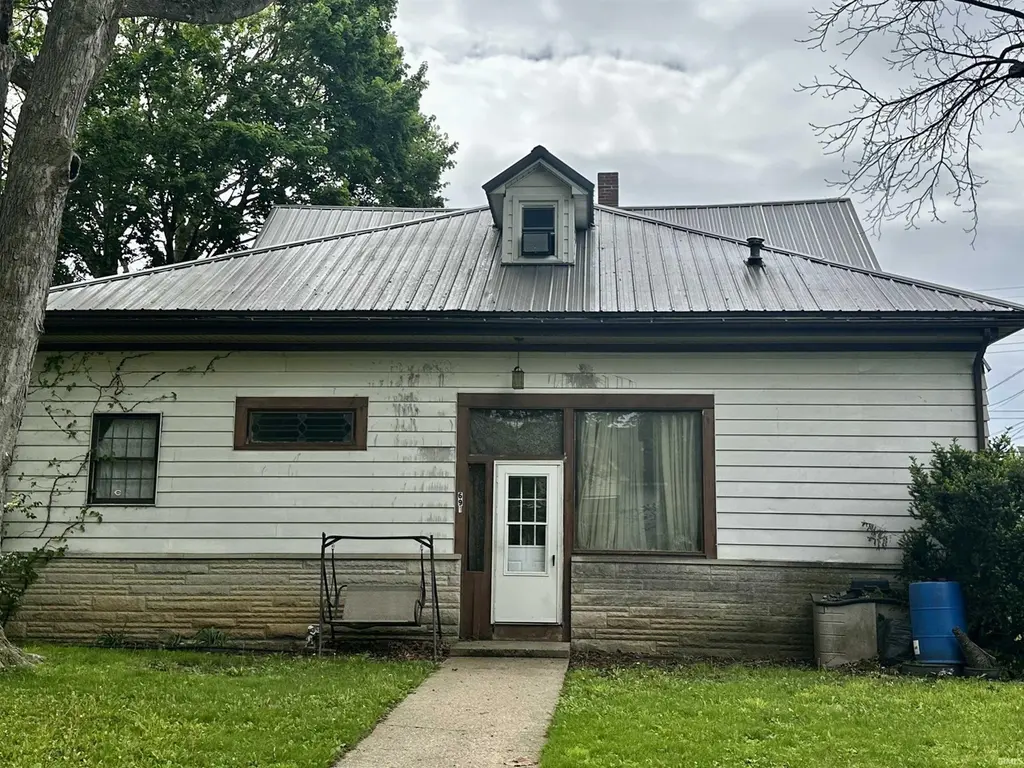
691 W Hill St · Wabash, IN
Flood risk 1/10 · Minimal
- FEMA flood zone
- X (unshaded)
- Chance of flooding over 30 yrs
- 0.0%
- Est. flood insurance / yr
- $507 – $1,088
Fire risk 1/10 · Minimal
- Est. fire insurance / yr
- $717 – $1,331
Heat risk 3/10 · Minor
- Hot days now (above 101°F)
- 7 days/yr
- Hot days in 30 yrs
- 17 days/yr
Wind risk 2/10 · Minimal
- Chance of severe wind over 30 yrs
- —
Air-quality risk 2/10 · Minimal
- Unhealthy air days now
- 1 days/yr
- Unhealthy air days in 30 yrs
- 2 days/yr
Risk factors via First Street. Map © Google.
Why this score? — see what drove the B grade
The composite is a weighted blend of 9 inputs, each scored 0–100. Each bar is that input's sub-score; the figure is the points it added to the 100-point composite (weight × sub-score).
- Cash flow +30.0/30.0
- ARV discount +12.4/15.0
- 1% rule +10.0/10.0
- DSCR +10.0/10.0
- Livability +3.8/5.0
- Rent growth +2.5/5.0
- Schools +2.5/10.0
- Condition / age +2.5/5.0
- Appreciation +0.0/10.0
$155,000
🖨 Deal sheet (PDF) 📄 Offer letter ✓ Due diligence
Multi-family units
County records classify this as Multi-Family (2-4 Unit). Listing-text estimate: 3 units. confirmed
Listing remarks
Fully occupied income-producing triplex featuring two 2 bed/1 bath units and one 1 bed/1 bath unit with long-term tenants in place for 5+ years. This property offers steady cash flow with on-site laundry for added tenant convenience. Recent updates include a durable metal roof and a new main water line, helping minimize future maintenance costs. A solid investment opportunity with stable occupancy and proven rental history.
Key facts
- On site laundry
- Metal roof
- New main water line
Tags
Property features AI
Finance
- Other: Pets allowed; Roof listed as green energy efficient
- Financial info: Annual tax amount listed (not included per instructions)
Exterior
- Parking: 3 open parking spaces; On-street parking and gravel parking areas
- Utilities: Public water; Public sewer
- Home design: Residential income property (Triplex); 2 stories; Entry level not specified; Lot roughly 86 x 132 (0.26 acre)
- Construction: Aluminum siding; Block foundation; Built with metal roof
- Exterior features: Metal roof; Corner lot
Interior
- Kitchen: Range, Microwave, Refrigerator, Dishwasher not listed
- Flooring: Carpet; Laminate
- Bathrooms: 3 full bathrooms; 5 main-level bathrooms
- Heating & cooling: Electric, Forced air, Natural gas heating; Wall unit cooling
- Interior features: Dryer, Microwave, Range, Refrigerator, Washer; Carpet and laminate flooring; Has basement with partial crawl space
- Laundry & utility: Washer hookup; Washer and Dryer included (appliances listed)
Neighborhood map
What this means for you Summary
Snapshot
- This is a 2×2bd/1ba + 1×1bd/1ba units multifamily listed at $155k.
Deal economics
- At list price, monthly cash flow is $1k ($16k/yr) — positive. Per door: $449/mo.
- The deal already cash-flows at list — no discount required.
- Meets the 1% rule at list price ($3k rent vs $155k).
- Recommended offer: $150k (3.0% below list) — sets the bar for market timing.
- Cap rate 16.7% vs local median 4.1% in Wabash — top-decile yield for the area; either an underpriced asset or a hidden risk that comps aren't pricing in. Stress-test before assuming the spread holds.
Location & tenants
- Location reads 76/100 on livability (#48 in IN, #3,353 nationally) — a middle-class / working-renter tenant base. Strengths: cost of living A+, housing A+, health & safety A+; Watch: employment D, commute F.
- Wabash City Schools (town): math 21% / reading 38% proficiency, ranked #249 of 301 in IN (top 83%) — low school quality limits family demand, transient renter base, plan for 1-2y turnover.
- Zoned schools: O J Neighbours Elementary School (math 24% / reading 25%, grade F, #762 of 994 statewide, top 78%, 391 students, 57% FRL); Wabash Middle School (math 18% / reading 43%, grade F, #203 of 330 statewide, top 63%, 443 students, 60% FRL); Wabash High School (math 27% / reading 42%, grade F, #270 of 369 statewide, top 77%, 478 students, 53% FRL).
- Market conditions: 37 active listings in the ZIP; 42 units permitted in Wabash County in 2024 (0 in 5+ unit buildings).
Forward outlook
- Local home prices are declining (-3.0%/yr); year-one equity from $1k of loan paydown is wiped out by about $5k of value loss. Plan a longer hold.
- Wabash County population projected at -16% by 2050 — secular population decline; favor cash flow + early exit over multi-decade hold.
- At projected returns (-3.0% appreciation + 3.0% rent growth), your $43k cash investment doubles in ~4 years — after that, you're playing with house money.
Negotiation context
- It's been on market 44 days — a 3% lower offer ($150k) is reasonable based on typical stale-listing flexibility.
Risks & watch-outs
- Watch-outs: built in 1910 — expect roof / HVAC / electrical / plumbing capex.
Questions for the listing agent
- It's been on market 44 days. Have you received any prior offers? Is the seller open to a 3% concession, seller financing, or rate buy-down credit?
- Can we see the unit-by-unit rent roll, current vacancy, and any below-market leases? What's the average tenancy length?
- What capital expenditures (roof, boiler, parking lot, exteriors) have been made in the last 5 years, and what's planned in the next 2?
- Built in 1910 — when were the roof, HVAC, electrical panel, plumbing, and water heater last replaced?
- Is there a deadline driving the sale (1031 exchange, divorce, estate, relocation)? That informs how much negotiation room exists.
- Schools are D-rated, which usually means shorter tenancies and higher turnover. Who's the typical renter profile here, and what's been the actual vacancy rate?
- What's the average days-on-market for RENTAL listings here right now (not sales)? A rising rental-DOM trend means longer vacancies and softer asking-rent achievability than the comps imply.
- What's the recent tenant-quality profile in this submarket — average credit score on applications, eviction rate, late-payment / NSF rate, and stable-employment percentage? A property-management company in the area should have these aggregated.
- How much new apartment / multifamily construction is in the pipeline within 1–3 miles? Heavy new supply (>2% of stock underway) typically softens rents 12–24 months out; light construction supports rent growth.
Investment metrics
- 1% rule
- 1.92% ✓
- Cap rate
- 16.72%
- Cash-on-cash
- 37.24%
- DSCR
- 2.66
- GRM
- 4.3
CMA / ARV
- ARV (median comp)
- $173,736
- List price
- $155,000
- Delta
- -10.78%
- Verdict
- UNDERPRICED
- Comps
- 7 within 1.0 mi
Projected returns pro-forma
-3.0% appreciation · 3.0% rent growth · sell at horizon
- IRR
- 33.2%
- Equity multiple
- 2.40×
- Total profit
- $60,671
- Equity at exit
- $23,111
- IRR
- 40.1%
- Equity multiple
- 4.76×
- Total profit
- $163,303
- Equity at exit
- $13,402
Cash invested: $43,400 (down + closing). Projections, not guarantees.
Landlord ↔ Tenant lean methodology
- Overall (STATE)
- 90 Strongly Landlord-Friendly
- State Indiana
- 90 Strongly Landlord-Friendly · R+11
- County
- — inherits STATE
- City
- — inherits STATE
ZIP-level market 46992
- Home prices YoY
- -21.3%
- Active inventory
- 37
- Price-to-rent
- 13.1×
Monthly cashflow live
- Estimated rent
- $2,973 medium interval (Pro) →
- Mortgage (P&I)
- −$813
- Tax from tax record
- −$124 /mo · $1,492/yr
- Insurance
- −$65
- HOA
- −$0
- Vacancy / Maint / Mgmt
- −$624
- Net cashflow
- $1,347
Break-even live
Sensitivity live
| Price | -10% $1,435 | -5% $1,391 | +0% $1,347 | +5% $1,303 | +10% $1,259 |
|---|---|---|---|---|---|
| Rent | -10% $1,112 | -5% $1,229 | +0% $1,347 | +5% $1,464 | +10% $1,582 |
| Rate | -1.0pp $1,425 | -0.5pp $1,386 | base $1,347 | +0.5pp $1,307 | +1.0pp $1,266 |
3-unit breakdown (identical units grouped — click to expand)
| Units | Beds | Baths | Est. rent |
|---|---|---|---|
| 2× units | 2 | 1 | $1,964 |
| #1 | 2 | 1 | $982 |
| #2 | 2 | 1 | $982 |
| 1× unit | 1 | 1 | $1,008 |
| Total (3 units) | $2,973 | ||
UW: 25.0% down · 7.5% · 30yr · 1.5% tax · 5.0% vac · 8.0% maint · 8.0% mgmt
Financing live
Cash to close
- Down payment
- $38,750
- Closing costs
- $4,650
- Reserves months
- —
- Total cash needed
- —
Loan-product check · same deal, 3 products live
Conventional
25% down · 7.5% · 30yr
- Down + closing
- —
- Monthly P&I
- —
- Monthly cashflow
- —
- DSCR
- —
- Eligible?
- —
Personal DTI + credit; lowest rate.
DSCR
20% down · 8.5% · 30yr
- Down + closing
- —
- Monthly P&I
- —
- Monthly cashflow
- —
- DSCR
- —
- Eligible?
- —
No personal income docs; deal must DSCR.
Hard money
10% down · 12.0% · 12mo
- Down + closing
- —
- Monthly P&I
- —
- Monthly cashflow
- —
- DSCR
- —
- Eligible?
- —
Short-term bridge; refi at stabilization.
Listing history 18 events
-
2026-06-22days on market $155,000 Active 44 DOM
-
2026-06-21days on market $155,000 Active 43 DOM
-
2026-06-21days on market $155,000 Active 42 DOM
-
2026-06-18days on market $155,000 Active 40 DOM
-
2026-06-17days on market $155,000 Active 39 DOM
-
2026-06-16days on market $155,000 Active 38 DOM
-
2026-06-15days on market $155,000 Active 37 DOM
-
2026-06-13days on market $155,000 Active 35 DOM
-
2026-06-12pricedays on market $155,000 Active 34 DOM
-
2026-06-09days on market $165,000 Active 31 DOM
-
2026-06-08days on market $165,000 Active 30 DOM
-
2026-06-07days on market $165,000 Active 29 DOM
-
2026-06-04days on market $165,000 Active 25 DOM
-
2026-06-02days on market $165,000 Active 24 DOM
-
2026-06-01days on market $165,000 Active 23 DOM
-
2026-05-31days on market $165,000 Active 22 DOM
-
2026-05-31days on market $165,000 Active 21 DOM
-
2026-05-09$165,000 Active 427-char remark
ⓘ Source: listings_history table (triggers on properties + properties_extension) + one-shot
backfill from property_details.listing_events for pre-trigger history.
Tax reassessment forecast IN · Partial reset (capped growth)
- Current annual tax
- $1,492 · $124/mo
- Projected year-2 tax
- $1,492 · $124/mo
- Expected delta
- $0/yr ($0/mo · 0.0%)
ⓘ Screening estimate from a state-policy table — verify with the county assessor before closing.
Climate risk First Street
- Flood 1/10 Low FEMA zone X (unshaded) · 0% chance over 30 yrs
- Wildfire 1/10 Low
- Heat 3/10 Moderate 7 d/yr ≥101°F today · 17 d/yr by 30 yrs out
- Wind 2/10 Low
- Air quality 2/10 Low 1 unhealthy d/yr today · 2 by 30 yrs out
Nearby sold comps map
Loading sold comps map…
Walkable amenities ~0.75 mi
Loading nearby amenities…
Taxation est. · year 1
- Rental income
- $35,676
- − Mortgage interest
- −$8,682
- − Property taxes
- −$1,492
- − Insurance
- −$775
- − Repairs & maintenance
- −$2,854
- − Management
- −$2,854
- − Depreciation
- −$4,509
- Taxable income
- $14,509
- Est. tax owed @ 24.0%
- −$3,482
- After-tax cash flow
- $12,681/yr
For passive investors: Depreciation is non-cash, so a rental often shows a tax loss while cash-flowing — sheltering income. Rental losses are passive: they offset passive income freely, and up to $25,000/yr can offset ordinary (W-2) income if you actively participate and your MAGI is under $100k (phasing out to $0 by $150k); unused losses carry forward. On sale, claimed depreciation is recaptured at up to 25%, and gains may owe capital-gains tax (a 1031 exchange can defer both). Figures are a year-1 estimate at your 24.0% rate — not tax advice; consult a CPA.
Schools (NCES district)
- District
- Wabash City Schools
- NCES district ID
- 1812150
- Math proficiency
- 21% ▼ -10.00%
- Reading proficiency
- 38% ▼ -7.00%
- Median HH income
- $38,900
- Composite
- 24.66/100
- National rank
- #7622
- State rank
- #249 of 301 in IN
Livability — Wabash
- Score
- 76/100
- State rank
- #48
- US rank
- #3353
Category grades
Schools grade is shown separately in the Schools card above.
Census & demographics
- Census place
- Wabash, IN
- City population
- 16,475
- Population (ZIP)
- 16,475
Population outlook (Wabash County) Hauer SSP2
- Today (2025)
- 30,872 people
- By 2030
- 29,933 · -3.0%
- By 2040
- 27,877 · -9.7%
- By 2050
- 25,887 · -16.1%
- By 2075
- 22,404 · -27.4%
- By 2100
- 19,461 · -37.0%
Race, ethnicity, and origin ACS 2023
- Neighborhood character
- Predominantly White (93%)
- Race & ethnicity
- White 93% Hispanic / Latino 4% Two or more races 3%
- Common ancestry
- Lithuanian 2% Italian 1% Iranian 1%
- Foreign-born
- 1% · Canada
- Languages at home
- 98% English-only · Spanish 1%
Political lean MEDSL · Wabash
- 2024 margin
- Solid R (+50.8) · D 23.9% · R 74.7% · Other 1.4%
- 2008→2024 swing
- -30.7pp toward R · 2008: -20.1pp · 2024: -50.8pp
- All cycles
- 2024: R+50.8 2020: R+49.9 2016: R+50.7 2012: R+36.2 2008: R+20.1
Not yet ingested
- Civics
- —
Market trends
- HPI YoY
- ▼ -59.46%
- Current HPI
- 220.0458
- Rent YoY
- —
- Metro
- —
- State GDP YoY
- ▲ 2.90%
- F500 in state
- 18
Industry mix (Fortune 500 HQ in IN)
| Industry | F500 HQs | Revenue |
|---|---|---|
| Industrial Machinery | 2 | $37B |
|
||
| Healthcare | 1 | $177B |
|
||
| Pharmaceuticals | 1 | $45B |
|
||
| Metals / Steel | 1 | $18B |
|
||
| Agriculture | 1 | $17B |
|
||
| Packaging | 1 | $12B |
|
||
Price history
-6.1% since first listed2 events — show timeline
- 2026-06-12 Price Changed $155,000 IRMLS
- 2026-05-09 Listed $165,000 IRMLS
Property tax history
-0.5%/yrLatest (2024): $1,492 · +1.6% YoY. Source: county tax records.
Cash-flow waterfall
monthlySold comps — $/sqft
last 12 mo · ≤1 miLoading sold comps…