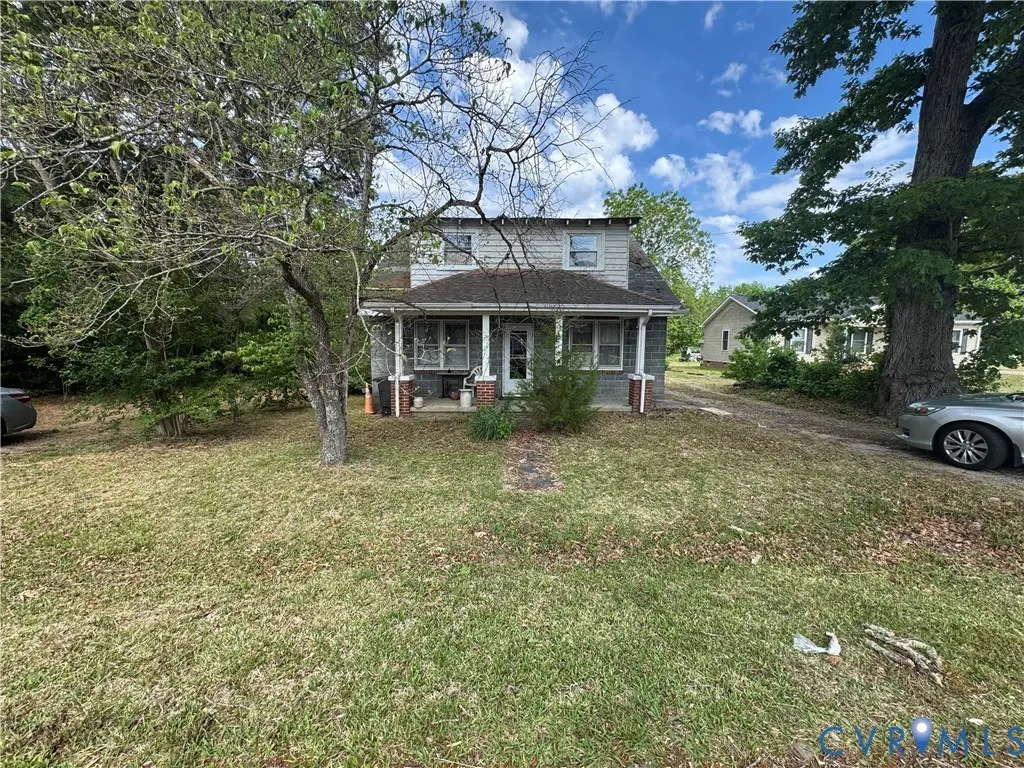
303 Purdy Rd · Emporia, VA
Flood risk 1/10 · Minimal
- FEMA flood zone
- X (unshaded)
- Chance of flooding over 30 yrs
- 0.0%
- Est. flood insurance / yr
- $473 – $860
Fire risk 3/10 · Minor
- Est. fire insurance / yr
- $666 – $1,236
Heat risk 7/10 · Major
- Hot days now (above 108°F)
- 7 days/yr
- Hot days in 30 yrs
- 16 days/yr
Wind risk 6/10 · Moderate
- Chance of severe wind over 30 yrs
- 58.0%
Air-quality risk 1/10 · Minimal
- Unhealthy air days now
- 0 days/yr
- Unhealthy air days in 30 yrs
- 0 days/yr
Risk factors via First Street. Map © Google.
Why this score? — see what drove the B grade
The composite is a weighted blend of 9 inputs, each scored 0–100. Each bar is that input's sub-score; the figure is the points it added to the 100-point composite (weight × sub-score).
- Cash flow +30.0/30.0
- 1% rule +10.0/10.0
- DSCR +10.0/10.0
- ARV discount +7.5/15.0
- Schools +5.0/10.0
- Livability +3.2/5.0
- Rent growth +2.5/5.0
- Condition / age +2.5/5.0
- Appreciation +0.0/10.0
$85,000
🖨 Deal sheet (PDF) 📄 Offer letter ✓ Due diligence
Listing remarks
Discover a 1950s property offering great potential in Emporia. This 1,433 sq ft structure features 3 bedrooms, 1 bathroom, and sits on a 0.38-acre lot. Well-maintained over the decades, it boasts solid bones and a layout that remains in decent, livable condition. Having been consistently occupied until recently, the vacant space is a clean slate ready for personalization. Bring your design ideas to modernize the interior to its full potential. Traditional architecture means there is no central HVAC. A great opportunity to customize a classic space!
Key facts
- 0.55 acre lot
- Built 1950
- Listed 20 days
Property features AI
Finance
- Other: Property assessed (assessment value provided but financial details omitted)
Exterior
- Utilities: Public water service; Public sewer service; Electric service (standard - specific provider not listed)
- Home design: Single-story home
- Construction: Block construction; Composition roof; About 1,433 square feet above grade (interior size provided)
- Exterior features: Lot about 0.55 acres; Public water; Public sewer
Interior
- Bedrooms: Bedrooms present (details not provided)
- Bathrooms: One full bathroom with tub and shower (located on the first level)
- Heating & cooling: Window unit(s) for cooling
- Interior features: Total of 6 rooms; Resale condition
Neighborhood map
What this means for you Summary
Snapshot
- This is a 3-bed/1.0-bath single-family listed at $85k.
Deal economics
- At list price, monthly cash flow is $500 ($6k/yr) — positive.
- The deal already cash-flows at list — no discount required.
- Meets the 1% rule at list price ($1k rent vs $85k).
- Recommended offer: $84k (1.5% below list) — sets the bar for market timing.
- Cap rate 13.3% vs local median 4.4% in Emporia — top-decile yield for the area; either an underpriced asset or a hidden risk that comps aren't pricing in. Stress-test before assuming the spread holds.
Location & tenants
- Location reads 64/100 on livability (#370 in VA) — a middle-class / working-renter tenant base. Strengths: cost of living A+, health & safety A+; Watch: schools C-, crime F, amenities F.
- Market conditions: 37 active listings in the ZIP; 5 units permitted in Emporia city in 2024 (0 in 5+ unit buildings).
Forward outlook
- Local home prices are declining (-3.0%/yr); year-one equity from $588 of loan paydown is wiped out by about $3k of value loss. Plan a longer hold.
- Emporia County population projected at -15% by 2050 — secular population decline; favor cash flow + early exit over multi-decade hold.
- At projected returns (-3.0% appreciation + 3.0% rent growth), your $24k cash investment doubles in ~5 years — after that, you're playing with house money.
Negotiation context
- It's been on market 20 days — a 2% lower offer ($84k) is reasonable based on typical stale-listing flexibility.
Risks & watch-outs
- Watch-outs: built in 1950 — expect roof / HVAC / electrical / plumbing capex.
- Climate carrying-cost: major wind risk, 58% chance of damaging wind over 30y; extreme-heat days projected 7→16/yr by 2055 (HVAC capex compounding) — expect insurance premiums to compound above CPI over the hold.
Questions for the listing agent
- Built in 1950 — when were the roof, HVAC, electrical panel, plumbing, and water heater last replaced?
- Is there a deadline driving the sale (1031 exchange, divorce, estate, relocation)? That informs how much negotiation room exists.
- Crime grade is F in this area — have there been break-ins, vandalism, or insurance claims at this property in the last 3 years? What carrier currently insures it and at what premium?
- What's the average days-on-market for RENTAL listings here right now (not sales)? A rising rental-DOM trend means longer vacancies and softer asking-rent achievability than the comps imply.
- What's the recent tenant-quality profile in this submarket — average credit score on applications, eviction rate, late-payment / NSF rate, and stable-employment percentage? A property-management company in the area should have these aggregated.
- How much new for-sale + rental construction is in the pipeline within 1–3 miles? Heavy new supply typically softens prices + rents 12–24 months out; constrained supply supports both.
Investment metrics
- 1% rule
- 1.50% ✓
- Cap rate
- 13.35%
- Cash-on-cash
- 25.20%
- DSCR
- 2.12
- GRM
- 5.6
CMA / ARV
- ARV (on-the-fly)
- $319,559
- Comps found
- 2
Show comp detail 2 sales within ~0.75 mi
| Address | Dist | Beds/Ba | Sqft | Sold | Price | $/sf | Match |
|---|---|---|---|---|---|---|---|
| 705 Lakeside Dr | 0.26mi | 3/2.0 | 1,582 (+10%) | 23mo | $225,000 | $142 | 48 |
| 1508 Walnut Dr | 0.74mi | 3/2.0 | 1,358 (-5%) | 6mo | $303,000 | $223 | 47 |
Match score weights: distance 35% · size 25% · config 20% · recency 20%. Top-matched comps best support the ARV.
Projected returns pro-forma
-3.0% appreciation · 3.0% rent growth · sell at horizon
- IRR
- 18.7%
- Equity multiple
- 1.76×
- Total profit
- $18,027
- Equity at exit
- $12,674
- IRR
- 27.0%
- Equity multiple
- 3.38×
- Total profit
- $56,563
- Equity at exit
- $7,349
Cash invested: $23,800 (down + closing). Projections, not guarantees.
Landlord ↔ Tenant lean methodology
- Overall (STATE)
- 55 Moderately Landlord-Leaning
- State Virginia
- 55 Moderately Landlord-Leaning · D+2
- County
- — inherits STATE
- City
- — inherits STATE
ZIP-level market 23847
- Home prices YoY
- -22.8%
- Active inventory
- 37
- Price-to-rent
- 5.6×
Monthly cashflow live
- Estimated rent
- $1,275 medium interval (Pro) →
- Mortgage (P&I)
- −$446
- Tax from tax record
- −$27 /mo · $320/yr
- Insurance
- −$35
- HOA
- −$0
- Vacancy / Maint / Mgmt
- −$268
- Net cashflow
- $500
Break-even live
Sensitivity live
| Price | -10% $548 | -5% $524 | +0% $500 | +5% $476 | +10% $452 |
|---|---|---|---|---|---|
| Rent | -10% $399 | -5% $449 | +0% $500 | +5% $550 | +10% $601 |
| Rate | -1.0pp $543 | -0.5pp $521 | base $500 | +0.5pp $478 | +1.0pp $455 |
UW: 25.0% down · 7.5% · 30yr · 1.5% tax · 5.0% vac · 8.0% maint · 8.0% mgmt
Financing live
Cash to close
- Down payment
- $21,250
- Closing costs
- $2,550
- Reserves months
- —
- Total cash needed
- —
Loan-product check · same deal, 3 products live
Conventional
25% down · 7.5% · 30yr
- Down + closing
- —
- Monthly P&I
- —
- Monthly cashflow
- —
- DSCR
- —
- Eligible?
- —
Personal DTI + credit; lowest rate.
DSCR
20% down · 8.5% · 30yr
- Down + closing
- —
- Monthly P&I
- —
- Monthly cashflow
- —
- DSCR
- —
- Eligible?
- —
No personal income docs; deal must DSCR.
Hard money
10% down · 12.0% · 12mo
- Down + closing
- —
- Monthly P&I
- —
- Monthly cashflow
- —
- DSCR
- —
- Eligible?
- —
Short-term bridge; refi at stabilization.
Listing history 10 events
-
2026-06-12statusdays on market $85,000 Pending 20 DOM
-
2026-06-09pricedays on market $85,000 Active 18 DOM
-
2026-06-08days on market $89,900 Active 17 DOM
-
2026-06-08days on market $89,900 Active 16 DOM
-
2026-06-05days on market $89,900 Active 14 DOM
-
2026-06-03days on market $89,900 Active 12 DOM
-
2026-06-02days on market $89,900 Active 11 DOM
-
2026-06-01days on market $89,900 Active 10 DOM
-
2026-05-31days on market $89,900 Active 9 DOM
-
2026-05-22$89,900 Active
ⓘ Source: listings_history table (triggers on properties + properties_extension) + one-shot
backfill from property_details.listing_events for pre-trigger history.
Tax reassessment forecast VA · Resets to sale price
- Current annual tax
- $320 · $27/mo
- Projected year-2 tax
- $697 · $58/mo
- Expected delta
- +$377/yr (+$31/mo · 117.7%)
ⓘ Screening estimate from a state-policy table — verify with the county assessor before closing.
Climate risk First Street
- Flood 1/10 Low FEMA zone X (unshaded) · 0% chance over 30 yrs
- Wildfire 3/10 Moderate
- Heat 7/10 Severe 7 d/yr ≥108°F today · 16 d/yr by 30 yrs out
- Wind 6/10 Major 58% chance of damaging wind over 30 yrs
- Air quality 1/10 Low 0 unhealthy d/yr today · 0 by 30 yrs out
Nearby sold comps map
Loading sold comps map…
Walkable amenities ~0.75 mi
Loading nearby amenities…
Taxation est. · year 1
- Rental income
- $15,305
- − Mortgage interest
- −$4,761
- − Property taxes
- −$320
- − Insurance
- −$425
- − Repairs & maintenance
- −$1,224
- − Management
- −$1,224
- − Depreciation
- −$2,473
- Taxable income
- $4,877
- Est. tax owed @ 24.0%
- −$1,171
- After-tax cash flow
- $4,827/yr
For passive investors: Depreciation is non-cash, so a rental often shows a tax loss while cash-flowing — sheltering income. Rental losses are passive: they offset passive income freely, and up to $25,000/yr can offset ordinary (W-2) income if you actively participate and your MAGI is under $100k (phasing out to $0 by $150k); unused losses carry forward. On sale, claimed depreciation is recaptured at up to 25%, and gains may owe capital-gains tax (a 1031 exchange can defer both). Figures are a year-1 estimate at your 24.0% rate — not tax advice; consult a CPA.
Schools (NCES district)
No district data.
Livability — Emporia
- Score
- 64/100
- State rank
- #370
- US rank
- #14846
Category grades
Schools grade is shown separately in the Schools card above.
Census & demographics
- Census place
- Emporia, VA
- Population (ZIP)
- 13,346
Population outlook (Emporia County) Hauer SSP2
- Today (2025)
- 5,078 people
- By 2030
- 4,892 · -3.7%
- By 2040
- 4,580 · -9.8%
- By 2050
- 4,335 · -14.6%
- By 2075
- 3,899 · -23.2%
- By 2100
- 3,646 · -28.2%
Race, ethnicity, and origin ACS 2023
- Neighborhood character
- Majority Black (62%)
- Race & ethnicity
- Black 62% White 27% Two or more races 9% Hispanic / Latino 5%
- Hispanic origin (detail)
- Common ancestry
- Slovak 1% Italian 1%
- Foreign-born
- 5% · Canada
- Languages at home
- 92% English-only · Spanish 5% Arabic 2%
Political lean MEDSL · Emporia
- 2024 margin
- Solid D (+31.0) · D 65.2% · R 34.2%
- 2008→2024 swing
- +0.2pp no change · 2008: 30.8pp · 2024: 31.0pp
- All cycles
- 2024: D+31.0 2020: D+36.0 2016: D+31.2 2012: D+33.7 2008: D+30.8
Not yet ingested
- Civics
- —
Market trends
- HPI YoY
- ▼ -48.80%
- Current HPI
- 165.052
- Rent YoY
- —
- Metro
- —
- State GDP YoY
- ▲ 2.40%
- F500 in state
- 50
Industry mix (Fortune 500 HQ in VA)
| Industry | F500 HQs | Revenue |
|---|---|---|
| Aerospace / Defense | 4 | $236B |
|
||
| Technology / Defense | 3 | $32B |
|
||
| Financial Services | 2 | $176B |
|
||
| Utilities | 2 | $27B |
|
||
| Insurance | 2 | $25B |
|
||
| Technology | 2 | $15B |
|
||
Price history
1 event — show timeline
- 2026-05-22 Listed $89,900 CVRMLS
Property tax history
+1.7%/yrLatest (2025): $320 · +0.0% YoY. Source: county tax records.
Cash-flow waterfall
monthlySold comps — $/sqft
last 12 mo · ≤1 miLoading sold comps…