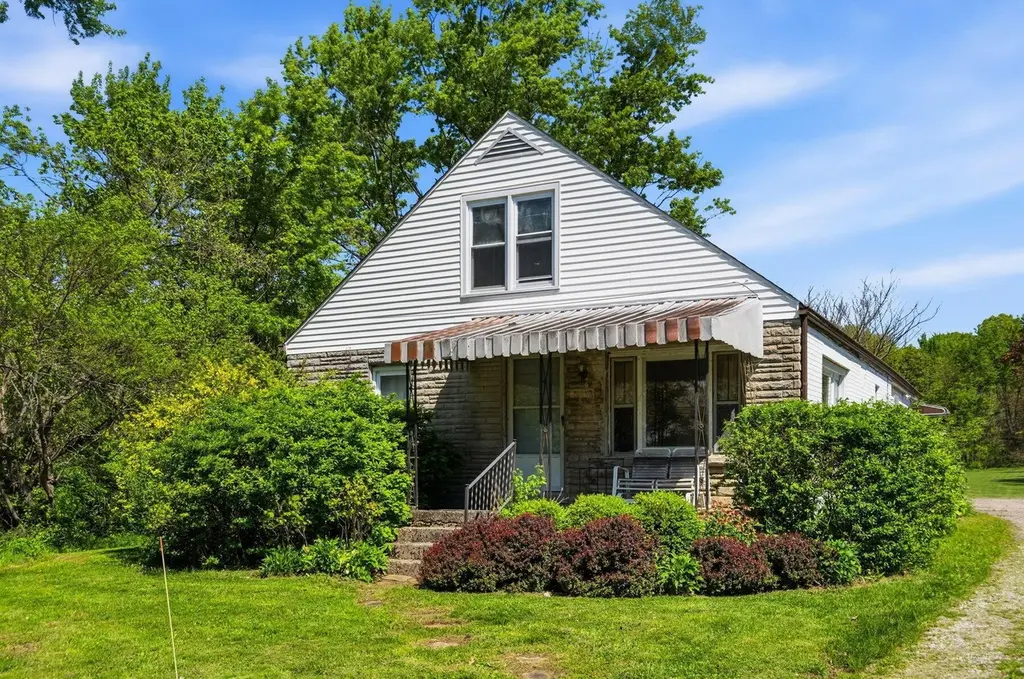
10131 Gorsuch Rd · Westerville, OH
Flood risk 1/10 · Minimal
- FEMA flood zone
- X (unshaded)
- Chance of flooding over 30 yrs
- 0.0%
- Est. flood insurance / yr
- $473 – $860
Fire risk 3/10 · Minor
- Est. fire insurance / yr
- $713 – $1,323
Heat risk 3/10 · Minor
- Hot days now (above 99°F)
- 7 days/yr
- Hot days in 30 yrs
- 17 days/yr
Wind risk 2/10 · Minimal
- Chance of severe wind over 30 yrs
- —
Air-quality risk 3/10 · Minor
- Unhealthy air days now
- 3 days/yr
- Unhealthy air days in 30 yrs
- 4 days/yr
Risk factors via First Street. Map © Google.
Why this score? — see what drove the C+ grade
The composite is a weighted blend of 9 inputs, each scored 0–100. Each bar is that input's sub-score; the figure is the points it added to the 100-point composite (weight × sub-score).
- Cash flow +25.5/30.0
- DSCR +8.5/10.0
- 1% rule +7.5/10.0
- ARV discount +7.5/15.0
- Schools +6.3/10.0
- Livability +4.1/5.0
- Rent growth +2.5/5.0
- Condition / age +2.5/5.0
- Appreciation +0.0/10.0
$200,000
🖨 Deal sheet 📄 Offer letter ✓ Due diligence
Listing remarks
Online Auction, the list price reflects the RESERVE (minimum Bid) of $200,000. The Auction ends at 7:00PM Tuesday June 2nd, 2026. Agents, please see 'A2A' remarks. Investor Opportunity - Value-Add Potential on 2.84 Acres! By the cheapest house in one of the best areas available. On approximately 2.84 scenic acres in the desirable Big Walnut School District, this 1.5 story home offers a rare blend of privacy, space, and opportunity. Being sold from the Estate of 98-year-old longtime resident. Built in 1951, including 4 bedrooms and 2 full bathrooms, first floor laundry and full basement that needs attention. The expansive lot provides a peaceful, rural setting with plenty of room for outd
Key facts
- 2.84 acre lot
- Built 1951
- Listed 30 days
Property features AI
Finance
- Other: Lot size approximately 2.84 acres; No additional parcels
Exterior
- Utilities: Public water; Private sewer
- Home design: Single-family residence; One-and-one-half story; Built in 1951
- Construction: Block foundation
- Exterior features: Balcony; Deck
Interior
- Bedrooms: Two main-level bedrooms
- Flooring: Carpet; Vinyl
- Bathrooms: Two full bathrooms
- Heating & cooling: Forced air heating with propane; Central air conditioning
- Interior features: Insulated windows; Walk-out, full basement with crawl space
Neighborhood map
What this means for you Summary
Snapshot
- This is a 2-bed/2.0-bath single-family listed at $200k.
Deal economics
- At list price, monthly cash flow is $468 ($6k/yr) — positive.
- The deal already cash-flows at list — no discount required.
- Meets the 1% rule at list price ($2k rent vs $200k).
- Recommended offer: $197k (1.5% below list) — sets the bar for market timing.
- Cap rate 9.1% vs local median 2.4% in Westerville — top-decile yield for the area; either an underpriced asset or a hidden risk that comps aren't pricing in. Stress-test before assuming the spread holds.
Location & tenants
- Location reads 82/100 on livability (#82 in OH, #1,215 nationally) — a professional / high-income tenant draw. Strengths: schools A+, employment A+, housing A+; Watch: amenities F, commute F.
- Big Walnut Local (rural): math 68% / reading 75% proficiency, ranked #103 of 656 in OH (top 16%) — strong family-tenant draw, lease renewals of 3-5y typical; only 15% free/reduced lunch — higher-income household profile.
- Market conditions: 111 active listings in the ZIP; 1 comparable units currently listed for rent nearby; high-income renter base; 2,233 units permitted in Delaware County in 2024 (304 in 5+ unit buildings).
Forward outlook
- Local home prices are declining (-3.0%/yr); year-one equity from $1k of loan paydown is wiped out by about $6k of value loss. Plan a longer hold.
- Delaware County population projected at +37% by 2050 — long-run rental-demand tailwind backs the buy-and-hold thesis.
Negotiation context
- It's been on market 30 days — a 2% lower offer ($197k) is reasonable based on typical stale-listing flexibility.
Risks & watch-outs
- Watch-outs: built in 1951 — expect roof / HVAC / electrical / plumbing capex.
Questions for the listing agent
- Built in 1951 — when were the roof, HVAC, electrical panel, plumbing, and water heater last replaced?
- Is there a deadline driving the sale (1031 exchange, divorce, estate, relocation)? That informs how much negotiation room exists.
- Schools are A-rated — typically a magnet for longer-tenancy family renters. What's the average tenant stay here, and is there a school-zone premium baked into asking?
- What's the average days-on-market for RENTAL listings here right now (not sales)? A rising rental-DOM trend means longer vacancies and softer asking-rent achievability than the comps imply.
- What's the recent tenant-quality profile in this submarket — average credit score on applications, eviction rate, late-payment / NSF rate, and stable-employment percentage? A property-management company in the area should have these aggregated.
- How much new for-sale + rental construction is in the pipeline within 1–3 miles? Heavy new supply typically softens prices + rents 12–24 months out; constrained supply supports both.
Investment metrics
- 1% rule
- 1.25% ✓
- Cap rate
- 9.10%
- Cash-on-cash
- 10.03%
- DSCR
- 1.45
- GRM
- 6.7
CMA / ARV
- ARV (median comp)
- $498,039
- List price
- $200,000
- Delta
- -59.84%
- Verdict
- UNDERPRICED
- Comps
- 6 within 1.0 mi
Show comp detail 1 sale within ~0.75 mi
| Address | Dist | Beds/Ba | Sqft | Sold | Price | $/sf | Match |
|---|---|---|---|---|---|---|---|
| 10945 Adams Rd | 0.70mi | 3/2.0 (+1) | 1,892 (-0%) | 0mo | $525,000 | $277 | 62 |
Match score weights: distance 35% · size 25% · config 20% · recency 20%. Top-matched comps best support the ARV.
Projected returns pro-forma
-3.0% appreciation · 3.0% rent growth · sell at horizon
- IRR
- -1.2%
- Equity multiple
- 0.96×
- Total profit
- $-2,472
- Equity at exit
- $29,821
- IRR
- 8.6%
- Equity multiple
- 1.66×
- Total profit
- $36,712
- Equity at exit
- $17,292
Cash invested: $56,000 (down + closing). Projections, not guarantees.
Landlord ↔ Tenant lean methodology
- Overall (STATE)
- 73 Landlord-Friendly
- State Ohio
- 73 Landlord-Friendly · R+6
- County
- — inherits STATE
- City
- — inherits STATE
ZIP-level market 43021
- Active inventory
- 111
- Price-to-rent
- 6.7×
Monthly cashflow live
- Estimated rent
- $2,500 medium interval (Pro) →
- Mortgage (P&I)
- −$1,049
- Tax from tax record
- −$375 /mo · $4,495/yr
- Insurance
- −$83
- HOA
- −$0
- Vacancy / Maint / Mgmt
- −$525
- Net cashflow
- $468
Break-even live
UW: 25.0% down · 7.5% · 30yr · 1.5% tax · 5.0% vac · 8.0% maint · 8.0% mgmt
Financing live
Cash to close
- Down payment
- $50,000
- Closing costs
- $6,000
- Reserves months
- —
- Total cash needed
- —
Loan-product check · same deal, 3 products live
Conventional
25% down · 7.5% · 30yr
- Down + closing
- —
- Monthly P&I
- —
- Monthly cashflow
- —
- DSCR
- —
- Eligible?
- —
Personal DTI + credit; lowest rate.
DSCR
20% down · 8.5% · 30yr
- Down + closing
- —
- Monthly P&I
- —
- Monthly cashflow
- —
- DSCR
- —
- Eligible?
- —
No personal income docs; deal must DSCR.
Hard money
10% down · 12.0% · 12mo
- Down + closing
- —
- Monthly P&I
- —
- Monthly cashflow
- —
- DSCR
- —
- Eligible?
- —
Short-term bridge; refi at stabilization.
Rent comps 1 comps
| Address | Beds | Baths | Sqft | Rent | $/sqft | DOM | Units | Dist |
|---|---|---|---|---|---|---|---|---|
| 11755 Gorsuch Rd Galena, OH | 3.0 | 1.0 | 2040 | $2,500 | $1.23 | 43d | 1 | 1.39mi |
Listing history 6 events
-
2026-06-05statusdays on market $200,000 Pending 30 DOM
-
2026-06-03days on market $200,000 Active 29 DOM
-
2026-06-02days on market $200,000 Active 28 DOM
-
2026-06-01days on market $200,000 Active 27 DOM
-
2026-05-31days on market $200,000 Active 26 DOM
-
2026-05-05$200,000 Active 1155-char remark
ⓘ Source: listings_history table (triggers on properties + properties_extension) + one-shot
backfill from property_details.listing_events for pre-trigger history.
Tax reassessment forecast OH · Partial reset (capped growth)
- Current annual tax
- $4,495 · $375/mo
- Projected year-2 tax
- $4,495 · $375/mo
- Expected delta
- $0/yr ($0/mo · 0.0%)
ⓘ Screening estimate from a state-policy table — verify with the county assessor before closing.
Climate risk First Street
- Flood 1/10 Low FEMA zone X (unshaded) · 0% chance over 30 yrs
- Wildfire 3/10 Moderate
- Heat 3/10 Moderate 7 d/yr ≥99°F today · 17 d/yr by 30 yrs out
- Wind 2/10 Low
- Air quality 3/10 Moderate 3 unhealthy d/yr today · 4 by 30 yrs out
Nearby sold comps map
Loading sold comps map…
Walkable amenities ~0.75 mi
Loading nearby amenities…
Taxation est. · year 1
- Rental income
- $30,000
- − Mortgage interest
- −$11,203
- − Property taxes
- −$4,495
- − Insurance
- −$1,000
- − Repairs & maintenance
- −$2,400
- − Management
- −$2,400
- − Depreciation
- −$5,818
- Taxable income
- $2,683
- Est. tax owed @ 24.0%
- −$644
- After-tax cash flow
- $4,975/yr
For passive investors: Depreciation is non-cash, so a rental often shows a tax loss while cash-flowing — sheltering income. Rental losses are passive: they offset passive income freely, and up to $25,000/yr can offset ordinary (W-2) income if you actively participate and your MAGI is under $100k (phasing out to $0 by $150k); unused losses carry forward. On sale, claimed depreciation is recaptured at up to 25%, and gains may owe capital-gains tax (a 1031 exchange can defer both). Figures are a year-1 estimate at your 24.0% rate — not tax advice; consult a CPA.
Schools (NCES district)
- District
- Big Walnut Local
- NCES district ID
- 3904674
- Math proficiency
- 68% ▼ -9.00%
- Reading proficiency
- 75% ▼ -6.00%
- Median HH income
- $79,890
- Composite
- 63.45/100
- National rank
- #617
- State rank
- #103 of 656 in OH
Livability — Westerville
- Score
- 82/100
- State rank
- #82
- US rank
- #1215
Category grades
Schools grade is shown separately in the Schools card above.
Census & demographics
- County
- Delaware · 221,676 people
- City population
- 99,583
- Metro
- Columbus, OH
- Population (ZIP)
- 14,855
- Household income
- $160,120
- Rent vs Own
- Severe rent burden
- 0.7
Population outlook (Delaware County) Hauer SSP2
- Today (2025)
- 230,854 people
- By 2030
- 249,294 · +8.0%
- By 2040
- 284,223 · +23.1%
- By 2050
- 315,314 · +36.6%
- By 2075
- 379,462 · +64.4%
- By 2100
- 403,158 · +74.6%
Race, ethnicity, and origin ACS 2023
- Neighborhood character
- Predominantly White (85%)
- Race & ethnicity
- White 85% Two or more races 7% Asian 4% Hispanic / Latino 3% Black 3%
- Common ancestry
- Italian 3% Romanian 3% Slovak 2%
- Foreign-born
- 6% · Canada, China, South Korea
- Languages at home
- 94% English-only · Spanish 2% Other Indo-European 1% Chinese 1%
Political lean MEDSL · Delaware
- 2024 margin
- Lean R (+6.6) · D 46.2% · R 52.8%
- 2008→2024 swing
- +13.0pp toward D · 2008: -19.6pp · 2024: -6.6pp
- All cycles
- 2024: R+6.6 2020: R+6.8 2016: R+16.1 2012: R+23.7 2008: R+19.6
Not yet ingested
- Civics
- —
Market trends
- HPI YoY
- ▼ -162.82%
- Current HPI
- 239.1812
- Rent YoY
- —
- Metro
- —
- State GDP YoY
- ▲ 1.98%
- F500 in state
- 48
Industry mix (Fortune 500 HQ in OH)
| Industry | F500 HQs | Revenue |
|---|---|---|
| Insurance | 3 | $145B |
|
||
| Industrial Machinery | 3 | $49B |
|
||
| Financial Services | 3 | $24B |
|
||
| Consumer Goods | 2 | $93B |
|
||
| Aerospace / Defense | 2 | $47B |
|
||
| Utilities | 2 | $33B |
|
||
Price history
2 events — show timeline
- 2026-06-05 Pending — CBRMLS
- 2026-05-05 Listed $200,000 CBRMLS
Property tax history
+6.8%/yrLatest (2025): $4,495 · +0.0% YoY. Source: county tax records.
Cash-flow waterfall
monthlySold comps — $/sqft
last 12 mo · ≤1 miLoading sold comps…