 Multi-family
8200 Sunbury Ln · Houston, TX
Flood risk 1/10 · Minimal
- FEMA flood zone
- X (unshaded)
- Chance of flooding over 30 yrs
- 0.0%
- Est. flood insurance / yr
- $507 – $1,088
Fire risk 1/10 · Minimal
- Est. fire insurance / yr
- $1,222 – $2,270
Heat risk 9/10 · Severe
- Hot days now (above 110°F)
- 7 days/yr
- Hot days in 30 yrs
- 23 days/yr
Wind risk 8/10 · Major
- Chance of severe wind over 30 yrs
- 99.0%
Air-quality risk 3/10 · Minor
- Unhealthy air days now
- 2 days/yr
- Unhealthy air days in 30 yrs
- 3 days/yr
Risk factors via First Street. Map © Google.
Why this score? — see what drove the C- grade
The composite is a weighted blend of 9 inputs, each scored 0–100. Each bar is that input's sub-score; the figure is the points it added to the 100-point composite (weight × sub-score).
- Cash flow +16.2/30.0
- ARV discount +7.5/15.0
- DSCR +5.0/10.0
- Appreciation +4.5/10.0
- 1% rule +4.4/10.0
- Schools +4.4/10.0
- Condition / age +3.8/5.0
- Livability +3.7/5.0
- Rent growth +3.0/5.0
$150,000
🖨 Deal sheet (PDF) 📄 Offer letter ✓ Due diligence
Multi-family units
County records classify this as Multi-Family (5+ Unit). Listing-text estimate: 1 unit. estimate disagrees with records
5+ unit building — per-unit beds/baths from public records are typically unavailable; the breakdown below (if shown) is an estimate from the listing text.
Listing remarks
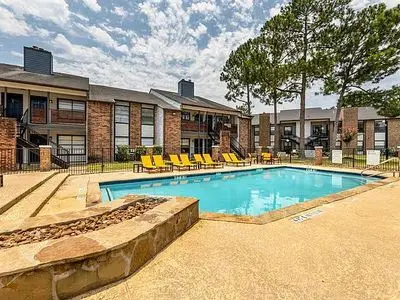
At The Grove, you have everything you need to lead an easy and fulfilling everyday life without ever leaving the comfort of your home or your gated community. Your pet-friendly 1 or 2 bedroom apartment includes perks like a chef-worthy kitchen with trendy cabinetry, spacious countertops, modern appliances, and a custom tile backsplash. You can enjoy access to community amenities like a fitness center with cardio equipment, an on-site play area, and a resort-worthy swimming pool. We & acirc; & euro; & trade; ll always be there for you when you rent one of these stunning apartment homes. Living at The Grove puts you in a central location near Jersey Village, just minutes away from
Key facts
- Built 1983
- Listed 19 days
Neighborhood map
What this means for you Summary
Snapshot
- This is a 2-bed/2.0-bath multifamily listed at $150k. Condition is rated good.
Deal economics
- At list price, monthly cash flow is $81 ($971/yr) — positive.
- The deal already cash-flows at list — no discount required.
- To meet the 1% rule (rent ≥ 1% of price), the offer needs to be $141k (5.7% below list).
- Recommended offer: $141k (5.7% below list) — sets the bar for 1% rule.
- Cap rate 6.9% vs local median 3.2% in Houston — top-decile yield for the area; either an underpriced asset or a hidden risk that comps aren't pricing in. Stress-test before assuming the spread holds.
Location & tenants
- Location reads 74/100 on livability (#184 in TX, #4,771 nationally) — a middle-class / working-renter tenant base. Strengths: amenities A+, cost of living A+, housing A+; Watch: crime F.
- Cypress-Fairbanks ISD (suburban): math 45% / reading 52% proficiency, ranked #161 of 826 in TX (top 20%) — families likely to look elsewhere, expect single-tenant / working-renter base with shorter leases.
- Zoned schools: Owens El (math 40% / reading 39%, grade F, #1,545 of 4,322 statewide, top 38%, 774 students, 77% FRL); Labay Middle (math 46% / reading 47%, grade D+, #443 of 1,662 statewide, top 28%, 1,199 students, 70% FRL); Cypress Falls H S (math 52% / reading 60%, grade C, #361 of 1,632 statewide, top 22%, 2,865 students, 66% FRL) — zoned schools average 71% FRL vs 43% district-wide (28 pts higher); higher-poverty schools than district average — tighter screening recommended.
- Market conditions: Rents rising (+2.1%/yr); 335 active listings in the ZIP; 40 comparable units currently listed for rent nearby; rentals at typical pace (median 19d on market — plan ~3-4 weeks tenant-placement turnaround); solid renter incomes; 29,883 units permitted in Harris County in 2024 (8,621 in 5+ unit buildings).
Forward outlook
- Local home prices are declining (-0.9%/yr); year-one equity from $1k of loan paydown is wiped out by about $1k of value loss. Plan a longer hold.
- Harris County population projected at +47% by 2050 — long-run rental-demand tailwind backs the buy-and-hold thesis.
Negotiation context
- It's been on market 20 days — a 2% lower offer ($148k) is reasonable based on typical stale-listing flexibility.
Risks & watch-outs
- Climate carrying-cost: severe wind risk, 99% chance of damaging wind over 30y; extreme-heat days projected 7→23/yr by 2055 (HVAC capex compounding) — expect insurance premiums to compound above CPI over the hold.
Questions for the listing agent
- Is there a deadline driving the sale (1031 exchange, divorce, estate, relocation)? That informs how much negotiation room exists.
- Schools are D-rated, which usually means shorter tenancies and higher turnover. Who's the typical renter profile here, and what's been the actual vacancy rate?
- Crime grade is F in this area — have there been break-ins, vandalism, or insurance claims at this property in the last 3 years? What carrier currently insures it and at what premium?
- What's the average days-on-market for RENTAL listings here right now (not sales)? A rising rental-DOM trend means longer vacancies and softer asking-rent achievability than the comps imply.
- What's the recent tenant-quality profile in this submarket — average credit score on applications, eviction rate, late-payment / NSF rate, and stable-employment percentage? A property-management company in the area should have these aggregated.
- How much new apartment / multifamily construction is in the pipeline within 1–3 miles? Heavy new supply (>2% of stock underway) typically softens rents 12–24 months out; light construction supports rent growth.
Investment metrics
- 1% rule
- 0.94% ✗
- Cap rate
- 6.94%
- Cash-on-cash
- 2.31%
- DSCR
- 1.10
- GRM
- 8.8
CMA / ARV
No comps found within radius.
Projected returns pro-forma
-0.94% appreciation · 2.1% rent growth · sell at horizon
- IRR
- -3.8%
- Equity multiple
- 0.83×
- Total profit
- $-7,020
- Equity at exit
- $36,601
- IRR
- 2.1%
- Equity multiple
- 1.19×
- Total profit
- $8,093
- Equity at exit
- $38,770
Cash invested: $42,000 (down + closing). Projections, not guarantees.
Landlord ↔ Tenant lean methodology
- Overall (STATE)
- 87 Strongly Landlord-Friendly
- State Texas
- 87 Strongly Landlord-Friendly · R+5
- County
- — inherits STATE
- City
- — inherits STATE
ZIP-level market 77095
- Home prices YoY
- -0.4%
- Rents YoY
- 2.1%
- Active inventory
- 335
- Price-to-rent
- 8.8×
Monthly cashflow live
- Estimated rent
- $1,415 high interval (Pro) →
- Mortgage (P&I)
- −$787
- Tax est. 1.5%
- −$188 /mo · $2,250/yr
- Insurance
- −$62
- HOA
- −$0
- Vacancy / Maint / Mgmt
- −$297
- Net cashflow
- $81
Break-even live
Sensitivity live
| Price | -10% $185 | -5% $133 | +0% $81 | +5% $29 | +10% $-23 |
|---|---|---|---|---|---|
| Rent | -10% $-31 | -5% $25 | +0% $81 | +5% $137 | +10% $193 |
| Rate | -1.0pp $156 | -0.5pp $119 | base $81 | +0.5pp $42 | +1.0pp $2 |
UW: 25.0% down · 7.5% · 30yr · 1.5% tax · 5.0% vac · 8.0% maint · 8.0% mgmt
Financing live
Cash to close
- Down payment
- $37,500
- Closing costs
- $4,500
- Reserves months
- —
- Total cash needed
- —
Loan-product check · same deal, 3 products live
Conventional
25% down · 7.5% · 30yr
- Down + closing
- —
- Monthly P&I
- —
- Monthly cashflow
- —
- DSCR
- —
- Eligible?
- —
Personal DTI + credit; lowest rate.
DSCR
20% down · 8.5% · 30yr
- Down + closing
- —
- Monthly P&I
- —
- Monthly cashflow
- —
- DSCR
- —
- Eligible?
- —
No personal income docs; deal must DSCR.
Hard money
10% down · 12.0% · 12mo
- Down + closing
- —
- Monthly P&I
- —
- Monthly cashflow
- —
- DSCR
- —
- Eligible?
- —
Short-term bridge; refi at stabilization.
Rent comps 40 comps
| Address | Beds | Baths | Sqft | Rent | $/sqft | DOM | Units | Dist |
|---|---|---|---|---|---|---|---|---|
| 8200 Sunbury Ln Houston, TX | 2.0 | 2.0 | 800 | $1,164 | $1.46 | 45d | 1 | 0.02mi |
| 8255 Sunbury Ln Apt 424 Houston, TX | 2.0 | 2.0 | 900 | $1,051 | $1.17 | 18d | 1 | 0.08mi |
| 8255 Sunbury Ln Unit 8276 Houston, TX | 1.0 | 1.0 | 600 | $827 | $1.38 | 18d | 1 | 0.08mi |
| 8255 Sunbury Ln Unit 8276 Houston, TX | 1.0 | 1.0 | 650 | $975 | $1.50 | 45d | 1 | 0.08mi |
| 8255 Sunbury Ln Unit 8288 Houston, TX | 3.0 | 2.0 | 1185 | $1,561 | $1.32 | 18d | 1 | 0.08mi |
| 8261 Sunbury Ln Houston, TX | 2.0 | 2.0 | 900 | $1,322 | $1.47 | 45d | 1 | 0.13mi |
| 8255 Sunbury Ln Houston, TX | 1.0–3.0 | 1.0–2.0 | 892 | $1,304 | $1.46 | 1d | 27 | 0.13mi |
| 8255 Sunbury Ln Houston, TX | 1.0 | 1.0 | 781 | $985 | $1.26 | 45d | 1 | 0.13mi |
| 18 Easton Commons Dr Houston, TX | 1.0 | 1.0 | 637 | $890 | $1.40 | 45d | 1 | 0.16mi |
| 18 Easton Commons Dr Houston, TX | 2.0 | 1.0 | 800 | $1,123 | $1.40 | 19d | 1 | 0.16mi |
| 18 Easton Commons Dr Houston, TX | 1.0 | 1.0 | 637 | $890 | $1.40 | 20d | 1 | 0.16mi |
| 14819 Chetland Place Dr Houston, TX | 3.0 | 2.0 | — | $2,050 | — | 4d | 1 | 0.18mi |
| 8315 Columbia Forest Dr Houston, TX | 3.0 | 2.5 | — | $2,150 | — | 26d | 1 | 0.19mi |
| 8335 Hawthorn Valley Ln Houston, TX | 3.0 | 2.5 | — | $2,150 | — | 45d | 1 | 0.19mi |
| 14818 Chetland Place Dr Unit CHEP18-1 Houston, TX | 3.0 | 2.5 | 2490 | $2,100 | $0.84 | 45d | 1 | 0.19mi |
| 8440 Easton Commons Dr Unit 1165 Houston, TX | 1.0 | 1.0 | 550 | $918 | $1.67 | 0d | 1 | 0.20mi |
| 8440 Easton Commons Dr Unit 8497 Houston, TX | 2.0 | 2.0 | 907 | $1,233 | $1.36 | 12d | 1 | 0.20mi |
| 8440 Easton Commons Dr Unit 2165 Houston, TX | 2.0 | 2.0 | 907 | $1,193 | $1.32 | 0d | 1 | 0.20mi |
| 8440 Easton Commons Dr Unit 8491 Houston, TX | 1.0 | 1.0 | 501 | $760 | $1.52 | 17d | 1 | 0.20mi |
| 8335 Columbia Forest Dr Houston, TX | 3.0 | 3.0 | 1767 | $2,000 | $1.13 | 45d | 1 | 0.21mi |
| 14811 West Rd Houston, TX | 2.0 | 2.0 | 943 | $1,455 | $1.54 | 26d | 1 | 0.22mi |
| 14811 West Rd Houston, TX | 2.0 | 2.0 | 943 | $1,455 | $1.54 | 45d | 1 | 0.22mi |
| 8022 Willancy Ln Houston, TX | 3.0 | 2.5 | — | $2,045 | — | 45d | 1 | 0.24mi |
| 8440 Easton Commons Dr Unit 8514 Houston, TX | 1.0 | 1.0 | 550 | $968 | $1.76 | 12d | 1 | 0.26mi |
| 8440 Easton Commons Dr Unit 8514 Houston, TX | 1.0 | 1.0 | 501 | $749 | $1.50 | 23d | 1 | 0.26mi |
| 14811 West Rd Unit 14826 Houston, TX | 1.0 | 1.0 | 730 | $1,432 | $1.96 | 12d | 1 | 0.27mi |
| 14811 West Rd Unit 14832 Houston, TX | 1.0 | 1.0 | 730 | $1,423 | $1.95 | 45d | 1 | 0.27mi |
| 14811 West Rd Unit 325 Houston, TX | 1.0 | 1.0 | 730 | $1,382 | $1.89 | 0d | 1 | 0.27mi |
| 14811 West Rd Unit 14838 Houston, TX | 2.0 | 2.0 | 943 | $1,599 | $1.70 | 14d | 1 | 0.27mi |
| 14811 West Rd Unit 424 Houston, TX | 2.0 | 2.0 | 1081 | $1,658 | $1.53 | 7d | 1 | 0.27mi |
| 14811 West Rd Unit 3148 Houston, TX | 3.0 | 2.0 | 1570 | $2,132 | $1.36 | 0d | 1 | 0.27mi |
| 14811 West Rd Unit 422 Houston, TX | 2.0 | 2.0 | 1081 | $1,658 | $1.53 | 9d | 1 | 0.27mi |
| 14811 West Rd Unit 14848 Houston, TX | 2.0 | 2.0 | 1187 | $1,809 | $1.52 | 45d | 1 | 0.27mi |
| 14811 West Rd Unit 14834 Houston, TX | 2.0 | 2.0 | 1081 | $1,682 | $1.56 | 12d | 1 | 0.27mi |
| 14811 West Rd Unit 14826 Houston, TX | 1.0 | 1.0 | 730 | $1,428 | $1.96 | 14d | 1 | 0.27mi |
| 14811 West Rd Unit 324 Houston, TX | 1.0 | 1.0 | 730 | $1,393 | $1.91 | 9d | 1 | 0.27mi |
| 14811 West Rd Unit 425 Houston, TX | 2.0 | 2.0 | 1081 | $1,642 | $1.52 | 0d | 1 | 0.27mi |
| 14811 West Rd Unit 14844 Houston, TX | 3.0 | 2.0 | 1570 | $2,172 | $1.38 | 12d | 1 | 0.27mi |
| 15125 West Rd Houston, TX | 1.0–3.0 | 1.0–2.0 | 969 | $1,528 | $1.58 | 1d | 29 | 0.33mi |
| 14623 Roaring Fork Ln Houston, TX | 3.0 | 2.5 | — | $2,100 | — | 45d | 1 | 0.35mi |
Listing history 14 events
-
2026-06-21days on market $150,000 Active 20 DOM
-
2026-06-18days on market $150,000 Active 17 DOM
-
2026-06-17pricedays on market $150,000 Active 16 DOM
-
2026-06-16days on market $90,000 Active 15 DOM
-
2026-06-15days on market $90,000 Active 14 DOM
-
2026-06-13days on market $90,000 Active 12 DOM
-
2026-06-13days on market $90,000 Active 11 DOM
-
2026-06-09days on market $90,000 Active 8 DOM
-
2026-06-08days on market $90,000 Active 7 DOM
-
2026-06-07days on market $90,000 Active 6 DOM
-
2026-06-04days on market $90,000 Active 3 DOM
-
2026-06-03days on market $90,000 Active 2 DOM
-
2026-06-02remarks 687-char remark
-
2026-06-02$90,000 Active 1 DOM
ⓘ Source: listings_history table (triggers on properties + properties_extension) + one-shot
backfill from property_details.listing_events for pre-trigger history.
Climate risk First Street
- Flood 1/10 Low FEMA zone X (unshaded) · 0% chance over 30 yrs
- Wildfire 1/10 Low
- Heat 9/10 Extreme 7 d/yr ≥110°F today · 23 d/yr by 30 yrs out
- Wind 8/10 Severe 99% chance of damaging wind over 30 yrs
- Air quality 3/10 Moderate 2 unhealthy d/yr today · 3 by 30 yrs out
Nearby sold comps map
Loading sold comps map…
Walkable amenities ~0.75 mi
Loading nearby amenities…
Taxation est. · year 1
- Rental income
- $16,975
- − Mortgage interest
- −$8,402
- − Property taxes
- −$2,250
- − Insurance
- −$750
- − Repairs & maintenance
- −$1,358
- − Management
- −$1,358
- − Depreciation
- −$4,364
- Taxable loss
- −$1,507
- Est. tax savings @ 24.0%
- +$362
- After-tax cash flow
- $1,333/yr
For passive investors: Depreciation is non-cash, so a rental often shows a tax loss while cash-flowing — sheltering income. Rental losses are passive: they offset passive income freely, and up to $25,000/yr can offset ordinary (W-2) income if you actively participate and your MAGI is under $100k (phasing out to $0 by $150k); unused losses carry forward. On sale, claimed depreciation is recaptured at up to 25%, and gains may owe capital-gains tax (a 1031 exchange can defer both). Figures are a year-1 estimate at your 24.0% rate — not tax advice; consult a CPA.
Condition & rehab AI · 1 photo
The property is in good condition with a well-maintained exterior and interior. Minor updates to landscaping, painting, and pool accessories would significantly enhance its value.
Value-add opportunities
- Both Landscaping improvements — Enhances curb appeal and adds value
- Both Painting exterior and interior — Fresh paint improves appearance and value
- Both Upgrade pool accessories — Modernizes the pool area and adds value
Renovation cost estimate screening
Value-add ROI direction
- Both Landscaping improvements — Enhances curb appeal and adds value ↑
- Both Painting exterior and interior — Fresh paint improves appearance and value ↑
- Both Upgrade pool accessories — Modernizes the pool area and adds value ↑
ⓘ Cost ranges are severity-bucket heuristics (US national rule-of-thumb). Get contractor quotes + a written scope before underwriting a rehab budget.
Schools (NCES district)
- District
- Cypress-Fairbanks ISD
- NCES district ID
- 4816110
- Math proficiency
- 45% ▼ -12.00%
- Reading proficiency
- 52% ▼ -2.00%
- Median HH income
- $72,025
- Composite
- 43.63/100
- National rank
- #2968
- State rank
- #161 of 826 in TX
Livability — Houston
- Score
- 74/100
- State rank
- #184
- US rank
- #4771
Category grades
Schools grade is shown separately in the Schools card above.
Census & demographics
- County
- Harris County · 4,702,590 people
- City population
- 3,226,434
- Metro
- Houston-The Woodlands-Sugar Land, TX
- Population (ZIP)
- 69,767
- Household income
- $91,594
- Rent vs Own
- Severe rent burden
- 1870.0
Population outlook (Harris County) Hauer SSP2
- Today (2025)
- 5,571,493 people
- By 2030
- 6,089,821 · +9.3%
- By 2040
- 7,142,806 · +28.2%
- By 2050
- 8,185,864 · +46.9%
- By 2075
- 10,574,329 · +89.8%
- By 2100
- 12,109,958 · +117.4%
Race, ethnicity, and origin ACS 2023
- Neighborhood character
- Highly diverse neighborhood (Simpson 0.73)
- Race & ethnicity
- White 39% Hispanic / Latino 28% Two or more races 18% Black 16% Asian 12%
- Hispanic origin (detail)
- Mexican 16% Cuban 2%
- Common ancestry
- Italian 2% Romanian 2% Lithuanian 1%
- Foreign-born
- 25% · Canada, Vietnam, Jamaica
- Languages at home
- 66% English-only · Spanish 19% Vietnamese 5% Arabic 3%
Political lean MEDSL · Harris
- 2024 margin
- Lean D (+5.5) · D 52.0% · R 46.4% · Other 1.6%
- 2008→2024 swing
- +3.9pp toward D · 2008: 1.6pp · 2024: 5.5pp
- All cycles
- 2024: D+5.5 2020: D+13.3 2016: D+12.4 2012: D+0.1 2008: D+1.6
Not yet ingested
- Civics
- —
Market trends
- HPI YoY
- ▼ -0.94%
- Current HPI
- 236.0249
- Rent YoY
- ▲ 2.10%
- Metro
- Houston-The Woodlands-Sugar Land, TX
- State GDP YoY
- ▲ 3.95%
- F500 in state
- 110
Industry mix (Fortune 500 HQ in TX)
| Industry | F500 HQs | Revenue |
|---|---|---|
| Energy | 16 | $1,198B |
|
||
| Technology | 5 | $198B |
|
||
| Engineering / Construction | 4 | $72B |
|
||
| Energy Services | 3 | $60B |
|
||
| Utilities | 3 | $41B |
|
||
| Healthcare | 2 | $330B |
|
||
Price history
1 event — show timeline
- 2026-06-02 Listed $90,000 FSBO.com
Cash-flow waterfall
monthlySold comps — $/sqft
last 12 mo · ≤1 miLoading sold comps…