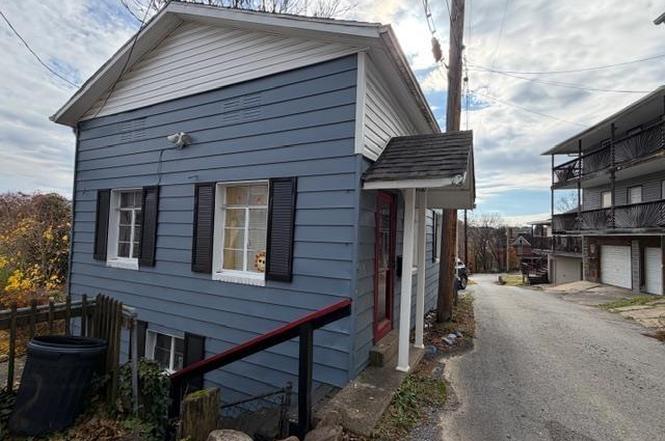
1013 Fay St · Fairmont, WV
Flood risk 1/10 · Minimal
- FEMA flood zone
- X (unshaded)
- Chance of flooding over 30 yrs
- 0.0%
- Est. flood insurance / yr
- $473 – $860
Fire risk 1/10 · Minimal
- Est. fire insurance / yr
- $787 – $1,461
Heat risk 5/10 · Moderate
- Hot days now (above 99°F)
- 7 days/yr
- Hot days in 30 yrs
- 20 days/yr
Wind risk 1/10 · Minimal
- Chance of severe wind over 30 yrs
- —
Air-quality risk 2/10 · Minimal
- Unhealthy air days now
- 1 days/yr
- Unhealthy air days in 30 yrs
- 2 days/yr
Risk factors via First Street. Map © Google.
Why this score? — see what drove the B- grade
The composite is a weighted blend of 9 inputs, each scored 0–100. Each bar is that input's sub-score; the figure is the points it added to the 100-point composite (weight × sub-score).
- Cash flow +29.5/30.0
- DSCR +10.0/10.0
- 1% rule +7.5/10.0
- ARV discount +7.5/15.0
- Livability +3.5/5.0
- Schools +3.1/10.0
- Rent growth +2.5/5.0
- Condition / age +2.5/5.0
- Appreciation +0.0/10.0
$63,900
🖨 Deal sheet 📄 Offer letter ✓ Due diligence
Listing remarks
Attention!!!Cute and cozy bungalow that is ready now. Updated throughout including window treatments/furniture and appliances remain. Great opportunity to relax and enjoy. Must see to appreciate. All measurements/lot dimensions are approximate. This is a great home just for you and it could be yours before the end of the year. Cheaper than rent!!! Let's get you pre-approved today.
Key facts
- 0.37 acre lot
- Built 1954
- Listed 210 days
Property features AI
Exterior
- Parking: Off-street parking; On-street parking
- Utilities: Public water; Public sewer; Cable available
- Home design: Single-family detached residence; 1 story
- Construction: Block and vinyl siding construction; Shingle roof
- Exterior features: Chain link fencing; Corner lot
Interior
- Kitchen: Refrigerator; Range
- Flooring: Laminate
- Bathrooms: 1 full bathroom
- Heating & cooling: Central heating; Forced air heating; Has cooling
- Interior features: Ceiling fan(s); Concrete partial unfinished basement; Porch
- Laundry & utility: Washer; Dryer
Neighborhood map
What this means for you Summary
Snapshot
- This is a 1-bed/1.0-bath single-family listed at $64k.
Deal economics
- At list price, monthly cash flow is $228 ($3k/yr) — positive.
- The deal already cash-flows at list — no discount required.
- Meets the 1% rule at list price ($801 rent vs $64k).
- Recommended offer: $56k (12.0% below list) — sets the bar for market timing.
- Cap rate 10.6% vs local median 4.3% in Fairmont — top-decile yield for the area; either an underpriced asset or a hidden risk that comps aren't pricing in. Stress-test before assuming the spread holds.
Location & tenants
- Location reads 70/100 on livability (#64 in WV) — a middle-class / working-renter tenant base. Strengths: cost of living A+, housing A+, health & safety A+; Watch: crime D, amenities F, commute F.
- Marion County Schools (town): math 30% / reading 43% proficiency, ranked #11 of 55 in WV (top 20%) — families likely to look elsewhere, expect single-tenant / working-renter base with shorter leases.
- Zoned schools: Jayenne Elementary School (math 47% / reading 47%, grade D-, #63 of 377 statewide, top 18%, 300 students, 0% FRL); West Fairmont Middle School (math 27% / reading 41%, grade F, #36 of 109 statewide, top 35%, 629 students, 0% FRL); East Fairmont High School (math 27% / reading 52%, grade F, #21 of 110 statewide, top 26%, 689 students, 0% FRL) — zoned schools average 0% FRL vs 46% district-wide (46 pts lower); this property's tenant base skews higher-income than the district average.
- Market conditions: 151 active listings in the ZIP; 3 units permitted in Marion County in 2024 (0 in 5+ unit buildings).
Forward outlook
- Local home prices are declining (-3.0%/yr); year-one equity from $442 of loan paydown is wiped out by about $2k of value loss. Plan a longer hold.
- At projected returns (-3.0% appreciation + 3.0% rent growth), your $18k cash investment doubles in ~8 years — after that, you're playing with house money.
Negotiation context
- It's been on market 211 days — a 12% lower offer ($56k) is reasonable based on typical stale-listing flexibility.
Risks & watch-outs
- Watch-outs: built in 1954 — expect roof / HVAC / electrical / plumbing capex.
- Climate carrying-cost: extreme-heat days projected 7→20/yr by 2055 (HVAC capex compounding) — expect insurance premiums to compound above CPI over the hold.
Questions for the listing agent
- It's been on market 211 days. Have you received any prior offers? Is the seller open to a 12% concession, seller financing, or rate buy-down credit?
- Built in 1954 — when were the roof, HVAC, electrical panel, plumbing, and water heater last replaced?
- Why hasn't it sold? Are there any deal-killer items the seller is aware of (foundation, flood, title, zoning, code violations)?
- Is there a deadline driving the sale (1031 exchange, divorce, estate, relocation)? That informs how much negotiation room exists.
- Schools are B-rated — typically a magnet for longer-tenancy family renters. What's the average tenant stay here, and is there a school-zone premium baked into asking?
- Crime grade is D in this area — have there been break-ins, vandalism, or insurance claims at this property in the last 3 years? What carrier currently insures it and at what premium?
- What's the average days-on-market for RENTAL listings here right now (not sales)? A rising rental-DOM trend means longer vacancies and softer asking-rent achievability than the comps imply.
- What's the recent tenant-quality profile in this submarket — average credit score on applications, eviction rate, late-payment / NSF rate, and stable-employment percentage? A property-management company in the area should have these aggregated.
- How much new for-sale + rental construction is in the pipeline within 1–3 miles? Heavy new supply typically softens prices + rents 12–24 months out; constrained supply supports both.
Investment metrics
- 1% rule
- 1.25% ✓
- Cap rate
- 10.57%
- Cash-on-cash
- 15.27%
- DSCR
- 1.68
- GRM
- 6.6
CMA / ARV
No comps found within radius.
Projected returns pro-forma
-3.0% appreciation · 3.0% rent growth · sell at horizon
- IRR
- 5.9%
- Equity multiple
- 1.23×
- Total profit
- $4,140
- Equity at exit
- $9,528
- IRR
- 15.3%
- Equity multiple
- 2.24×
- Total profit
- $22,240
- Equity at exit
- $5,525
Cash invested: $17,892 (down + closing). Projections, not guarantees.
Landlord ↔ Tenant lean methodology
- Overall (STATE)
- 83 Strongly Landlord-Friendly
- State West Virginia
- 83 Strongly Landlord-Friendly · R+22
- County
- — inherits STATE
- City
- — inherits STATE
ZIP-level market 26554
- Home prices YoY
- -11.3%
- Active inventory
- 151
- Price-to-rent
- 6.6×
Monthly cashflow live
- Estimated rent
- $801 medium interval (Pro) →
- Mortgage (P&I)
- −$335
- Tax from tax record
- −$43 /mo · $521/yr
- Insurance
- −$27
- HOA
- −$0
- Vacancy / Maint / Mgmt
- −$168
- Net cashflow
- $228
Break-even live
UW: 25.0% down · 7.5% · 30yr · 1.5% tax · 5.0% vac · 8.0% maint · 8.0% mgmt
Financing live
Cash to close
- Down payment
- $15,975
- Closing costs
- $1,917
- Reserves months
- —
- Total cash needed
- —
Loan-product check · same deal, 3 products live
Conventional
25% down · 7.5% · 30yr
- Down + closing
- —
- Monthly P&I
- —
- Monthly cashflow
- —
- DSCR
- —
- Eligible?
- —
Personal DTI + credit; lowest rate.
DSCR
20% down · 8.5% · 30yr
- Down + closing
- —
- Monthly P&I
- —
- Monthly cashflow
- —
- DSCR
- —
- Eligible?
- —
No personal income docs; deal must DSCR.
Hard money
10% down · 12.0% · 12mo
- Down + closing
- —
- Monthly P&I
- —
- Monthly cashflow
- —
- DSCR
- —
- Eligible?
- —
Short-term bridge; refi at stabilization.
Listing history 20 events
-
2026-06-19days on market $63,900 Active 211 DOM
-
2026-06-18days on market $63,900 Active 210 DOM
-
2026-06-17days on market $63,900 Active 209 DOM
-
2026-06-16days on market $63,900 Active 208 DOM
-
2026-06-15days on market $63,900 Active 207 DOM
-
2026-06-14days on market $63,900 Active 205 DOM
-
2026-06-13days on market $63,900 Active 204 DOM
-
2026-06-10days on market $63,900 Active 202 DOM
-
2026-06-09days on market $63,900 Active 201 DOM
-
2026-06-08days on market $63,900 Active 200 DOM
-
2026-06-07days on market $63,900 Active 199 DOM
-
2026-06-02days on market $63,900 Active 194 DOM
-
2026-06-01days on market $63,900 Active 193 DOM
-
2026-05-31days on market $63,900 Active 192 DOM
-
2026-05-30days on market $63,900 Active 191 DOM
-
2026-05-07price $63,900
-
2026-04-27price $71,900
-
2026-04-23price $74,900
-
2026-03-03price $79,900
-
2025-11-21$91,900 Active
ⓘ Source: listings_history table (triggers on properties + properties_extension) + one-shot
backfill from property_details.listing_events for pre-trigger history.
Tax reassessment forecast WV · Resets to sale price
- Current annual tax
- $521 · $43/mo
- Projected year-2 tax
- $521 · $43/mo
- Expected delta
- $0/yr ($0/mo · 0.0%)
ⓘ Screening estimate from a state-policy table — verify with the county assessor before closing.
Climate risk First Street
- Flood 1/10 Low FEMA zone X (unshaded) · 0% chance over 30 yrs
- Wildfire 1/10 Low
- Heat 5/10 Major 7 d/yr ≥99°F today · 20 d/yr by 30 yrs out
- Wind 1/10 Low
- Air quality 2/10 Low 1 unhealthy d/yr today · 2 by 30 yrs out
Nearby sold comps map
Loading sold comps map…
Walkable amenities ~0.75 mi
Loading nearby amenities…
Taxation est. · year 1
- Rental income
- $9,614
- − Mortgage interest
- −$3,579
- − Property taxes
- −$521
- − Insurance
- −$320
- − Repairs & maintenance
- −$769
- − Management
- −$769
- − Depreciation
- −$1,859
- Taxable income
- $1,796
- Est. tax owed @ 24.0%
- −$431
- After-tax cash flow
- $2,302/yr
For passive investors: Depreciation is non-cash, so a rental often shows a tax loss while cash-flowing — sheltering income. Rental losses are passive: they offset passive income freely, and up to $25,000/yr can offset ordinary (W-2) income if you actively participate and your MAGI is under $100k (phasing out to $0 by $150k); unused losses carry forward. On sale, claimed depreciation is recaptured at up to 25%, and gains may owe capital-gains tax (a 1031 exchange can defer both). Figures are a year-1 estimate at your 24.0% rate — not tax advice; consult a CPA.
Schools (NCES district)
- District
- Marion County Schools
- NCES district ID
- 5400720
- Math proficiency
- 30% ▼ -14.00%
- Reading proficiency
- 43% ▼ -8.00%
- Median HH income
- $42,195
- Composite
- 30.8/100
- National rank
- #6145
- State rank
- #11 of 55 in WV
Livability — Fairmont
- Score
- 70/100
- State rank
- #64
- US rank
- #8054
Category grades
Schools grade is shown separately in the Schools card above.
Census & demographics
- Census place
- Fairmont, WV
- Population (ZIP)
- 42,116
Population outlook (Marion County) Hauer SSP2
- Today (2025)
- 56,923 people
- By 2030
- 56,850 · -0.1%
- By 2040
- 56,469 · -0.8%
- By 2050
- 56,027 · -1.6%
- By 2075
- 55,509 · -2.5%
- By 2100
- 51,082 · -10.3%
Race, ethnicity, and origin ACS 2023
- Neighborhood character
- Predominantly White (90%)
- Race & ethnicity
- White 90% Two or more races 5% Black 3% Hispanic / Latino 2%
- Common ancestry
- Romanian 3% Slovak 2% Iranian 2%
- Foreign-born
- 1%
- Languages at home
- 98% English-only · Spanish 1%
Political lean MEDSL · Marion
- 2024 margin
- Solid R (+31.2) · D 33.2% · R 64.5% · Other 2.3%
- 2008→2024 swing
- -31.7pp toward R · 2008: 0.5pp · 2024: -31.2pp
- All cycles
- 2024: R+31.2 2020: R+28.7 2016: R+33.5 2012: R+14.4 2008: D+0.5
Not yet ingested
- Civics
- —
Market trends
- HPI YoY
- ▼ -30.86%
- Current HPI
- 240.9967
- Rent YoY
- —
- Metro
- —
- State GDP YoY
- —
- F500 in state
- 0
Price history
-30.5% since first listed5 events — show timeline
- 2026-05-07 Price Changed $63,900 NCWVREIN
- 2026-04-27 Price Changed $71,900 NCWVREIN
- 2026-04-23 Price Changed $74,900 NCWVREIN
- 2026-03-03 Price Changed $79,900 NCWVREIN
- 2025-11-21 Listed $91,900 NCWVREIN
Property tax history
+1.8%/yrLatest (2025): $521 · +4.1% YoY. Source: county tax records.
Cash-flow waterfall
monthlySold comps — $/sqft
last 12 mo · ≤1 miLoading sold comps…