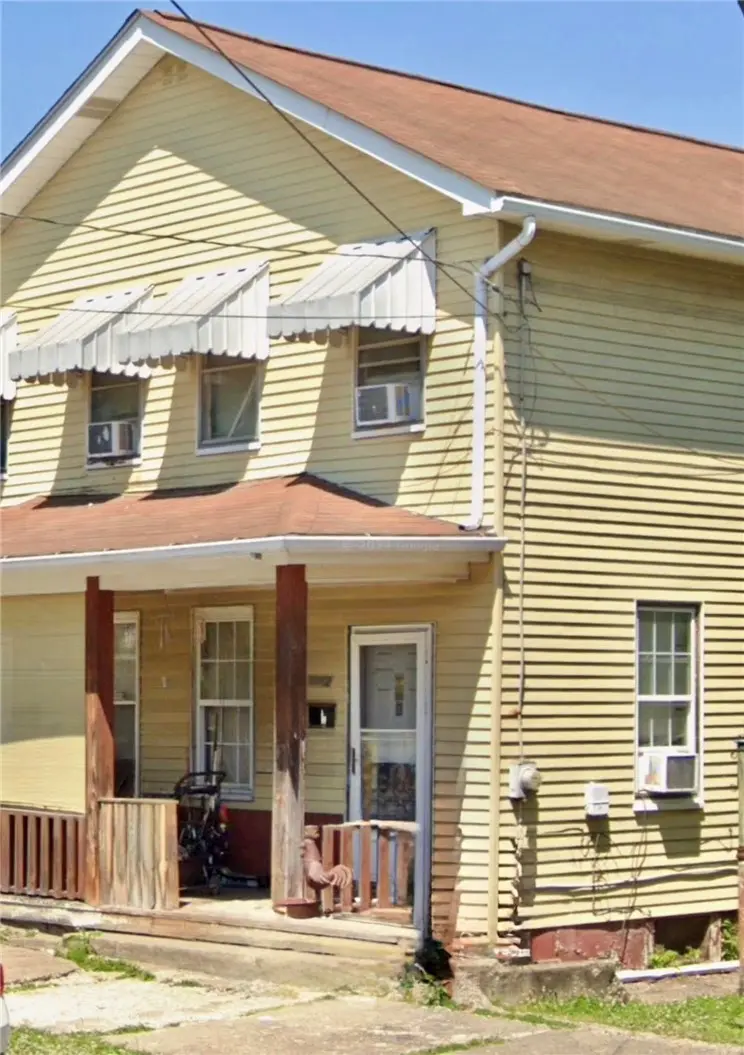
1312 2nd Ave · Beaver Falls, PA
Flood risk 1/10 · Minimal
- FEMA flood zone
- X (unshaded)
- Chance of flooding over 30 yrs
- 0.0%
- Est. flood insurance / yr
- $473 – $860
Fire risk 1/10 · Minimal
- Est. fire insurance / yr
- $511 – $949
Heat risk 4/10 · Minor
- Hot days now (above 97°F)
- 8 days/yr
- Hot days in 30 yrs
- 19 days/yr
Wind risk 2/10 · Minimal
- Chance of severe wind over 30 yrs
- —
Air-quality risk 3/10 · Minor
- Unhealthy air days now
- 2 days/yr
- Unhealthy air days in 30 yrs
- 4 days/yr
Risk factors via First Street. Map © Google.
Why this score? — see what drove the C+ grade
The composite is a weighted blend of 9 inputs, each scored 0–100. Each bar is that input's sub-score; the figure is the points it added to the 100-point composite (weight × sub-score).
- Cash flow +30.0/30.0
- 1% rule +10.0/10.0
- DSCR +10.0/10.0
- Livability +4.2/5.0
- Rent growth +3.3/5.0
- Condition / age +2.5/5.0
- Schools +2.2/10.0
- ARV discount +0.0/15.0
- Appreciation +0.0/10.0
$73,000
🖨 Deal sheet (PDF) 📄 Offer letter ✓ Due diligence
Listing remarks
Updated townhome featuring modern upgrades throughout. New furnace, flooring, and windows installed 1/2026! This home is turnkey with the exception of a few unfinished exterior renovations awaiting completion by its new owner. The main level showcases LVP flooring, fresh paint, updated fixtures, and most importantly an updated kitchen with beautiful, earth tone cabinetry. Upstairs you will find a fully updated bathroom accompanied by 3 bedrooms, each boasting gleaming hardwood floors. This property would make a great first home or investment property to add to your portfolio.
Key facts
- Updated kitchen
- Built 1900
- Listed 23 days
Tags
Property features AI
Exterior
- Parking: On-street parking
- Utilities: Public water; Public sewer
- Home design: 2-story; Property faces unspecified direction
- Construction: Built previously (resale property)
- Exterior features: Public water; Public sewer; Resale condition
Interior
- Kitchen: Microwave; Refrigerator; Stove
- Flooring: Hardwood; Vinyl
- Bathrooms: 1 full bathroom
- Heating & cooling: Gas heating
- Interior features: Multi-pane windows; Window treatments
- Laundry & utility: Washer; Dryer; Some gas appliances
Neighborhood map
What this means for you Summary
Snapshot
- This is a 3-bed/1.0-bath single-family listed at $73k.
Deal economics
- At list price, monthly cash flow is $429 ($5k/yr) — positive.
- The deal already cash-flows at list — no discount required.
- Meets the 1% rule at list price ($1k rent vs $73k).
- Recommended offer: $72k (1.5% below list) — sets the bar for market timing.
- Cap rate 13.3% vs local median 7.6% in Beaver Falls — top-decile yield for the area; either an underpriced asset or a hidden risk that comps aren't pricing in. Stress-test before assuming the spread holds.
Location & tenants
- Location reads 84/100 on livability (#93 in PA, #675 nationally) — a professional / high-income tenant draw. Strengths: commute A+, cost of living A+, housing A+; Watch: amenities F, employment F.
- Big Beaver Falls Area SD (suburban): math 16% / reading 37% proficiency, ranked #467 of 539 in PA (top 87%) — low school quality limits family demand, transient renter base, plan for 1-2y turnover; 66% free/reduced lunch — lower-income household profile, screen leases tightly.
- Zoned schools: Central El Sch (math 12% / reading 37%, grade F, #1,180 of 1,518 statewide, top 80%, 497 students, 100% FRL); Beaver Falls Ms (math 6% / reading 32%, grade F, #447 of 512 statewide, top 88%, 384 students, 100% FRL); Beaver Falls Area Shs (math 32%, 469 students, 89% FRL) — zoned schools average 96% FRL vs 66% district-wide (30 pts higher); higher-poverty schools than district average — tighter screening recommended.
- Market conditions: Rents rising (+3.1%/yr); 147 active listings in the ZIP; 9 comparable units currently listed for rent nearby; rentals leasing fast (median 4d on market — plan ~1-2 weeks tenant-placement turnaround); 272 units permitted in Beaver County in 2024 (80 in 5+ unit buildings).
Forward outlook
- Local home prices are declining (-3.0%/yr); year-one equity from $505 of loan paydown is wiped out by about $2k of value loss. Plan a longer hold.
- Beaver County population projected at -14% by 2050 — secular population decline; favor cash flow + early exit over multi-decade hold.
- At projected returns (-3.0% appreciation + 3.1% rent growth), your $20k cash investment doubles in ~5 years — after that, you're playing with house money.
Negotiation context
- It's been on market 24 days — a 2% lower offer ($72k) is reasonable based on typical stale-listing flexibility.
- 2 sale attempts; this cycle's ask has dropped $6k (7%) from the opening price — seller is motivated, your offer sets the floor, not the list.
- Current owner paid $16k; list at $73k implies a 356% gain — meaningful room to come down on a strong offer.
Risks & watch-outs
- Watch-outs: built in 1900 — expect roof / HVAC / electrical / plumbing capex.
Questions for the listing agent
- Built in 1900 — when were the roof, HVAC, electrical panel, plumbing, and water heater last replaced?
- Is there a deadline driving the sale (1031 exchange, divorce, estate, relocation)? That informs how much negotiation room exists.
- Schools are B-rated — typically a magnet for longer-tenancy family renters. What's the average tenant stay here, and is there a school-zone premium baked into asking?
- What's the average days-on-market for RENTAL listings here right now (not sales)? A rising rental-DOM trend means longer vacancies and softer asking-rent achievability than the comps imply.
- What's the recent tenant-quality profile in this submarket — average credit score on applications, eviction rate, late-payment / NSF rate, and stable-employment percentage? A property-management company in the area should have these aggregated.
- How much new for-sale + rental construction is in the pipeline within 1–3 miles? Heavy new supply typically softens prices + rents 12–24 months out; constrained supply supports both.
Investment metrics
- 1% rule
- 1.61% ✓
- Cap rate
- 13.34%
- Cash-on-cash
- 25.17%
- DSCR
- 2.12
- GRM
- 5.2
CMA / ARV
- ARV (median comp)
- $58,094
- List price
- $73,000
- Delta
- 13.61%
- Verdict
- OVERPRICED
- Comps
- 20 within 1.0 mi
Show comp detail 12 sales within ~0.75 mi
| Address | Dist | Beds/Ba | Sqft | Sold | Price | $/sf | Match |
|---|---|---|---|---|---|---|---|
| 1503 3rd Ave | 0.15mi | 3/1.0 | 1,200 (+5%) | 3mo | $48,000 | $40 | 82 |
| 1716 4th Ave | 0.31mi | 2/1.0 (-1) | 1,144 (0%) | 3mo | $30,000 | $26 | 78 |
| 1512 3rd Ave | 0.15mi | 2/1.0 (-1) | 1,238 (+8%) | 9mo | $66,000 | $53 | 66 |
| 1908 6th Ave | 0.46mi | 2/1.5 (-1) | 1,144 (0%) | 9mo | $116,000 | $101 | 64 |
| 1602 6th Ave | 0.33mi | 2/1.5 (-1) | 1,058 (-8%) | 3mo | $45,000 | $43 | 62 |
| 1717 3rd Ave | 0.30mi | 2/2.0 (-1) | 1,080 (-6%) | 7mo | $40,000 | $37 | 62 |
| 1705 N 3rd St | 0.65mi | 3/2.0 | 1,144 (0%) | 8mo | $224,000 | $196 | 59 |
| 1556 2nd St | 0.73mi | 2/1.0 (-1) | 1,192 (+4%) | 4mo | $125,000 | $105 | 51 |
| 2217 7th Ave Rear | 0.69mi | 3/1.5 | 1,236 (+8%) | 6mo | $137,000 | $111 | 47 |
| 2106 rear 6th Ave Rear | 0.57mi | 3/1.0 | 1,024 (-10%) | 12mo | $105,000 | $103 | 46 |
| 420 20th St | 0.47mi | 2/1.5 (-1) | 1,286 (+12%) | 8mo | $113,500 | $88 | 44 |
| 620 24th St | 0.74mi | 3/1.0 | 1,232 (+8%) | 13mo | $117,000 | $95 | 42 |
Match score weights: distance 35% · size 25% · config 20% · recency 20%. Top-matched comps best support the ARV.
Projected returns pro-forma
-3.0% appreciation · 3.07% rent growth · sell at horizon
- IRR
- 18.8%
- Equity multiple
- 1.76×
- Total profit
- $15,573
- Equity at exit
- $10,885
- IRR
- 27.2%
- Equity multiple
- 3.40×
- Total profit
- $49,116
- Equity at exit
- $6,312
Cash invested: $20,440 (down + closing). Projections, not guarantees.
Landlord ↔ Tenant lean methodology
- Overall (STATE)
- 62 Landlord-Friendly
- State Pennsylvania
- 62 Landlord-Friendly · EVEN
- County
- — inherits STATE
- City
- — inherits STATE
ZIP-level market 15010
- Home prices YoY
- -22.6%
- Rents YoY
- 3.1%
- Active inventory
- 147
- Price-to-rent
- 5.2×
Monthly cashflow live
- Estimated rent
- $1,173 high interval (Pro) →
- Mortgage (P&I)
- −$383
- Tax from tax record
- −$85 /mo · $1,016/yr
- Insurance
- −$30
- HOA
- −$0
- Vacancy / Maint / Mgmt
- −$246
- Net cashflow
- $429
Break-even live
Sensitivity live
| Price | -10% $470 | -5% $449 | +0% $429 | +5% $408 | +10% $387 |
|---|---|---|---|---|---|
| Rent | -10% $336 | -5% $382 | +0% $429 | +5% $475 | +10% $521 |
| Rate | -1.0pp $465 | -0.5pp $447 | base $429 | +0.5pp $410 | +1.0pp $391 |
UW: 25.0% down · 7.5% · 30yr · 1.5% tax · 5.0% vac · 8.0% maint · 8.0% mgmt
Financing live
Cash to close
- Down payment
- $18,250
- Closing costs
- $2,190
- Reserves months
- —
- Total cash needed
- —
Loan-product check · same deal, 3 products live
Conventional
25% down · 7.5% · 30yr
- Down + closing
- —
- Monthly P&I
- —
- Monthly cashflow
- —
- DSCR
- —
- Eligible?
- —
Personal DTI + credit; lowest rate.
DSCR
20% down · 8.5% · 30yr
- Down + closing
- —
- Monthly P&I
- —
- Monthly cashflow
- —
- DSCR
- —
- Eligible?
- —
No personal income docs; deal must DSCR.
Hard money
10% down · 12.0% · 12mo
- Down + closing
- —
- Monthly P&I
- —
- Monthly cashflow
- —
- DSCR
- —
- Eligible?
- —
Short-term bridge; refi at stabilization.
Rent comps 9 comps
| Address | Beds | Baths | Sqft | Rent | $/sqft | DOM | Units | Dist |
|---|---|---|---|---|---|---|---|---|
| 1320 4th Ave Beaver Falls, PA | 2.0 | 1.0 | 850 | $950 | $1.12 | 3d | 1 | 0.12mi |
| 1503 3rd Ave Beaver Falls, PA | 3.0 | 1.0 | 1200 | $1,350 | $1.12 | 3d | 1 | 0.16mi |
| 1613 4th Ave Beaver Falls, PA | 2.0 | 1.0 | 1016 | $1,200 | $1.18 | 3d | 1 | 0.27mi |
| 921 15th St Unit 3 Beaver Falls, PA | 2.0 | 1.0 | 800 | $949 | $1.19 | 45d | 1 | 0.55mi |
| 2210 7th Ave Beaver Falls, PA | 2.0 | 1.0 | 850 | $875 | $1.03 | 3d | 1 | 0.67mi |
| 911 12th Ave Beaver Falls, PA | 2.0 | 1.0 | 812 | $850 | $1.05 | 3d | 1 | 0.68mi |
| 1459 4th St New Brighton, PA | 3.0 | 2.0 | 1312 | $1,625 | $1.24 | 16d | 1 | 0.74mi |
| 418 Darlington Rd Beaver Falls, PA | 2.0 | 1.5 | 975 | $1,350 | $1.38 | 14d | 1 | 1.20mi |
| 904 Penn Ave Unit 1 New Brighton, PA | 2.0 | 1.0 | 1300 | $995 | $0.77 | 19d | 1 | 1.26mi |
Listing history 19 events
-
2026-06-21days on market $73,000 Active 24 DOM
-
2026-06-18days on market $73,000 Active 21 DOM
-
2026-06-18price $73,000 Active 20 DOM
-
2026-06-17days on market $78,500 Active 20 DOM
-
2026-06-16days on market $78,500 Active 19 DOM
-
2026-06-15days on market $78,500 Active 18 DOM
-
2026-06-13days on market $78,500 Active 16 DOM
-
2026-06-13days on market $78,500 Active 15 DOM
-
2026-06-09days on market $78,500 Active 12 DOM
-
2026-06-08days on market $78,500 Active 11 DOM
-
2026-06-07days on market $78,500 Active 10 DOM
-
2026-06-05days on market $78,500 Active 7 DOM
-
2026-06-03days on market $78,500 Active 6 DOM
-
2026-06-02days on market $78,500 Active 5 DOM
-
2026-06-01days on market $78,500 Active 4 DOM
-
2026-05-31days on market $78,500 Active 3 DOM
-
2026-05-08$66,000 Active
-
2003-10-22soldstatus $16,000
-
1982-07-20soldstatus $17,000
ⓘ Source: listings_history table (triggers on properties + properties_extension) + one-shot
backfill from property_details.listing_events for pre-trigger history.
Tax reassessment forecast PA · Partial reset (capped growth)
- Current annual tax
- $1,016 · $85/mo
- Projected year-2 tax
- $1,085 · $90/mo
- Expected delta
- +$69/yr (+$6/mo · 6.8%)
ⓘ Screening estimate from a state-policy table — verify with the county assessor before closing.
Climate risk First Street
- Flood 1/10 Low FEMA zone X (unshaded) · 0% chance over 30 yrs
- Wildfire 1/10 Low
- Heat 4/10 Moderate 8 d/yr ≥97°F today · 19 d/yr by 30 yrs out
- Wind 2/10 Low
- Air quality 3/10 Moderate 2 unhealthy d/yr today · 4 by 30 yrs out
Nearby sold comps map
Loading sold comps map…
Walkable amenities ~0.75 mi
Loading nearby amenities…
Taxation est. · year 1
- Rental income
- $14,076
- − Mortgage interest
- −$4,089
- − Property taxes
- −$1,016
- − Insurance
- −$365
- − Repairs & maintenance
- −$1,126
- − Management
- −$1,126
- − Depreciation
- −$2,124
- Taxable income
- $4,230
- Est. tax owed @ 24.0%
- −$1,015
- After-tax cash flow
- $4,130/yr
For passive investors: Depreciation is non-cash, so a rental often shows a tax loss while cash-flowing — sheltering income. Rental losses are passive: they offset passive income freely, and up to $25,000/yr can offset ordinary (W-2) income if you actively participate and your MAGI is under $100k (phasing out to $0 by $150k); unused losses carry forward. On sale, claimed depreciation is recaptured at up to 25%, and gains may owe capital-gains tax (a 1031 exchange can defer both). Figures are a year-1 estimate at your 24.0% rate — not tax advice; consult a CPA.
Schools (NCES district)
- District
- Big Beaver Falls Area SD
- NCES district ID
- 4203630
- Math proficiency
- 16% ▼ -11.00%
- Reading proficiency
- 37% ▼ -15.00%
- Median HH income
- $35,686
- Composite
- 21.85/100
- National rank
- #8241
- State rank
- #467 of 539 in PA
Livability — Beaver Falls
- Score
- 84/100
- State rank
- #93
- US rank
- #675
Category grades
Schools grade is shown separately in the Schools card above.
Census & demographics
- Census place
- Beaver Falls, PA
- County
- Beaver County · 116,001 people
- City population
- 28,542
- Metro
- Pittsburgh, PA
- Population (ZIP)
- 28,542
- Household income
- $71,200
- Rent vs Own
- Severe rent burden
- 519.0
Population outlook (Beaver County) Hauer SSP2
- Today (2025)
- 164,976 people
- By 2030
- 161,449 · -2.1%
- By 2040
- 151,752 · -8.0%
- By 2050
- 141,155 · -14.4%
- By 2075
- 118,142 · -28.4%
- By 2100
- 91,740 · -44.4%
Race, ethnicity, and origin ACS 2023
- Neighborhood character
- Predominantly White (85%)
- Race & ethnicity
- White 85% Black 9% Two or more races 4% Hispanic / Latino 1%
- Common ancestry
- Romanian 5% Slovak 2% Iranian 1%
- Foreign-born
- 2% · Canada
- Languages at home
- 98% English-only · Spanish 1%
Political lean MEDSL · Beaver
- 2024 margin
- Strong R (+20.7) · D 39.2% · R 59.9%
- 2008→2024 swing
- -17.9pp toward R · 2008: -2.8pp · 2024: -20.7pp
- All cycles
- 2024: R+20.7 2020: R+17.7 2016: R+20.1 2012: R+6.6 2008: R+2.8
Not yet ingested
- Civics
- —
Market trends
- HPI YoY
- ▼ -76.25%
- Current HPI
- 261.2703
- Rent YoY
- ▲ 3.07%
- Metro
- Pittsburgh, PA
- State GDP YoY
- ▲ 1.68%
- F500 in state
- 34
Industry mix (Fortune 500 HQ in PA)
| Industry | F500 HQs | Revenue |
|---|---|---|
| Healthcare | 2 | $309B |
|
||
| Insurance | 2 | $27B |
|
||
| Telecommunications / Media | 1 | $124B |
|
||
| Industrial Distribution | 1 | $22B |
|
||
| Financial Services | 1 | $20B |
|
||
| Chemicals / Materials | 1 | $18B |
|
||
Price history
+329.4% since first listed5 events — show timeline
- 2026-06-18 Price Changed $73,000 West Penn MLS
- 2026-05-28 Listed $78,500 West Penn MLS
- 2026-05-08 Listed $66,000 West Penn MLS
- 2003-10-22 Sold (Public Records) $16,000 Public Records
- 1982-07-20 Sold (Public Records) $17,000 Public Records
Property tax history
+0.5%/yrLatest (2026): $1,016 · +0.0% YoY. Source: county tax records.
Cash-flow waterfall
monthlySold comps — $/sqft
last 12 mo · ≤1 miLoading sold comps…