 Duplex
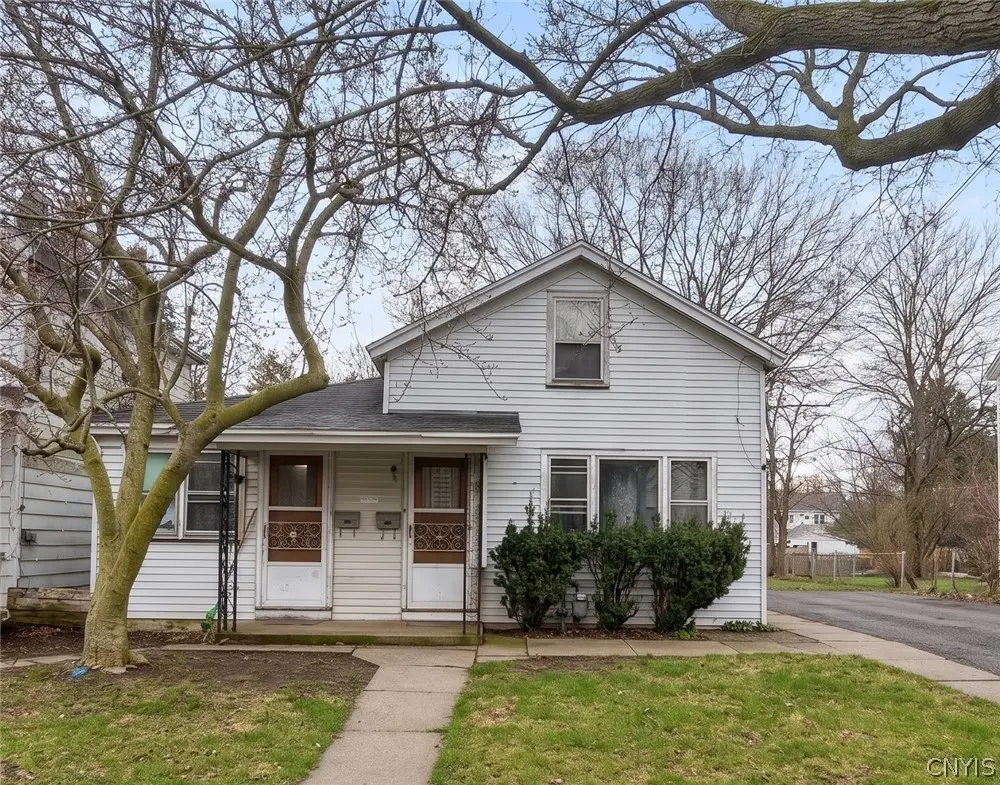
68 Mitchell St · Oswego, NY
Flood risk 1/10 · Minimal
- FEMA flood zone
- X (unshaded)
- Chance of flooding over 30 yrs
- 0.0%
- Est. flood insurance / yr
- $473 – $860
Fire risk 2/10 · Minimal
- Est. fire insurance / yr
- $691 – $1,283
Heat risk 2/10 · Minimal
- Hot days now (above 94°F)
- 7 days/yr
- Hot days in 30 yrs
- 16 days/yr
Wind risk 1/10 · Minimal
- Chance of severe wind over 30 yrs
- 0.0%
Air-quality risk 2/10 · Minimal
- Unhealthy air days now
- 2 days/yr
- Unhealthy air days in 30 yrs
- 2 days/yr
Risk factors via First Street. Map © Google.
Why this score? — see what drove the B+ grade
The composite is a weighted blend of 9 inputs, each scored 0–100. Each bar is that input's sub-score; the figure is the points it added to the 100-point composite (weight × sub-score).
- Cash flow +30.0/30.0
- 1% rule +10.0/10.0
- DSCR +10.0/10.0
- ARV discount +7.5/15.0
- Rent growth +5.0/5.0
- Appreciation +3.9/10.0
- Schools +3.8/10.0
- Livability +3.8/5.0
- Condition / age +2.5/5.0
$90,000
🖨 Deal sheet 📄 Offer letter ✓ Due diligence
Multi-family units
County records classify this as Multi-Family (2-4 Unit). Listing-text estimate: 2 units. confirmed
Listing remarks
68 Mitchell St is a duplex in Oswego NY offering both investment potential and owner-occupant flexibility. The property features a 2 bed, 1 bath unit alongside a 1 bed, 1 bath unit, making it well suited for rental income, multi-generational living, or a live-in investment strategy. Priced below assessed value, this multi-family opportunity stands out for buyers looking to secure value in today’s market. The sale also includes an additional lot at 10 Aline St, adding extra space and future potential. Located in the City of Oswego with proximity to Lake Ontario and everyday conveniences, this property presents a strong opportunity at an accessible price point.
Key facts
- Investment potential
- Rental income
- Duplex
Tags
Neighborhood map
What this means for you Summary
Snapshot
- This is a 2 × 3-bed/2.0-bath units multifamily listed at $90k.
Deal economics
- At list price, monthly cash flow is $2k ($21k/yr) — positive. Per door: $883/mo.
- The deal already cash-flows at list — no discount required.
- Meets the 1% rule at list price ($3k rent vs $90k).
- Cap rate 29.8% vs local median 8.8% in Oswego — top-decile yield for the area; either an underpriced asset or a hidden risk that comps aren't pricing in. Stress-test before assuming the spread holds.
Location & tenants
- Location reads 75/100 on livability (#265 in NY, #4,189 nationally) — a middle-class / working-renter tenant base. Strengths: cost of living A+, housing A+, health & safety A+; Watch: schools D+, crime F, commute F.
- Oswego City School District (town): math 39% / reading 51% proficiency, ranked #465 of 590 in NY (top 79%) — families likely to look elsewhere, expect single-tenant / working-renter base with shorter leases.
- Market conditions: Rents rising fast (+19.2%/yr); 168 active listings in the ZIP; 9 comparable units currently listed for rent nearby; rentals leasing fast (median 14d on market — plan ~1-2 weeks tenant-placement turnaround); 172 units permitted in Oswego County in 2024 (27 in 5+ unit buildings).
- At $3,085/mo this rent would consume 57% of the median local household income ($65k/yr) (locally 1341% of renters already pay >50% of income on rent) — very limited rent-growth headroom before tenants either downsize or default.
Forward outlook
- Local home prices are declining (-2.2%/yr); year-one equity from $622 of loan paydown is wiped out by about $2k of value loss. Plan a longer hold.
- Oswego County population projected at -23% by 2050 — secular population decline; favor cash flow + early exit over multi-decade hold.
- At projected returns (-2.2% appreciation + 8.0% rent growth), your $25k cash investment doubles in ~2 years — after that, you're playing with house money.
Negotiation context
- Only 7 days on market — expect competitive offers; lowballing is unlikely to land.
- Current owner paid $50k; list at $90k implies a 80% gain — meaningful room to come down on a strong offer.
Risks & watch-outs
- Watch-outs: built in 1909 — expect roof / HVAC / electrical / plumbing capex.
Questions for the listing agent
- Can we see the unit-by-unit rent roll, current vacancy, and any below-market leases? What's the average tenancy length?
- What capital expenditures (roof, boiler, parking lot, exteriors) have been made in the last 5 years, and what's planned in the next 2?
- Built in 1909 — when were the roof, HVAC, electrical panel, plumbing, and water heater last replaced?
- Is there a deadline driving the sale (1031 exchange, divorce, estate, relocation)? That informs how much negotiation room exists.
- Schools are D-rated, which usually means shorter tenancies and higher turnover. Who's the typical renter profile here, and what's been the actual vacancy rate?
- Crime grade is F in this area — have there been break-ins, vandalism, or insurance claims at this property in the last 3 years? What carrier currently insures it and at what premium?
- What's the average days-on-market for RENTAL listings here right now (not sales)? A rising rental-DOM trend means longer vacancies and softer asking-rent achievability than the comps imply.
- What's the recent tenant-quality profile in this submarket — average credit score on applications, eviction rate, late-payment / NSF rate, and stable-employment percentage? A property-management company in the area should have these aggregated.
- How much new apartment / multifamily construction is in the pipeline within 1–3 miles? Heavy new supply (>2% of stock underway) typically softens rents 12–24 months out; light construction supports rent growth.
Investment metrics
- 1% rule
- 3.43% ✓
- Cap rate
- 29.85%
- Cash-on-cash
- 84.13%
- DSCR
- 4.74
- GRM
- 2.4
CMA / ARV
No comps found within radius.
Projected returns pro-forma
-2.25% appreciation · 8.0% rent growth · sell at horizon
- IRR
- 90.7%
- Equity multiple
- 5.65×
- Total profit
- $117,162
- Equity at exit
- $16,443
- IRR
- 94.4%
- Equity multiple
- 13.85×
- Total profit
- $323,932
- Equity at exit
- $13,076
Cash invested: $25,200 (down + closing). Projections, not guarantees.
Landlord ↔ Tenant lean methodology
- Overall (STATE)
- 15 Strongly Tenant-Friendly
- State New York
- 15 Strongly Tenant-Friendly · D+10
- County
- — inherits STATE
- City
- — inherits STATE
ZIP-level market 13126
- Home prices YoY
- -0.8%
- Rents YoY
- 19.2%
- Active inventory
- 168
- Price-to-rent
- 4.9×
Monthly cashflow live
- Estimated rent
- $3,085 medium interval (Pro) →
- Mortgage (P&I)
- −$472
- Tax from tax record
- −$161 /mo · $1,931/yr
- Insurance
- −$38
- HOA
- −$0
- Vacancy / Maint / Mgmt
- −$648
- Net cashflow
- $1,767
Break-even live
2-unit breakdown (identical units grouped — click to expand)
| Units | Beds | Baths | Est. rent |
|---|---|---|---|
| 2× units | 3 | 2 | $3,086 |
| #1 | 3 | 2 | $1,543 |
| #2 | 3 | 2 | $1,543 |
| Total (2 units) | $3,085 | ||
UW: 25.0% down · 7.5% · 30yr · 1.5% tax · 5.0% vac · 8.0% maint · 8.0% mgmt
Financing live
Cash to close
- Down payment
- $22,500
- Closing costs
- $2,700
- Reserves months
- —
- Total cash needed
- —
Loan-product check · same deal, 3 products live
Conventional
25% down · 7.5% · 30yr
- Down + closing
- —
- Monthly P&I
- —
- Monthly cashflow
- —
- DSCR
- —
- Eligible?
- —
Personal DTI + credit; lowest rate.
DSCR
20% down · 8.5% · 30yr
- Down + closing
- —
- Monthly P&I
- —
- Monthly cashflow
- —
- DSCR
- —
- Eligible?
- —
No personal income docs; deal must DSCR.
Hard money
10% down · 12.0% · 12mo
- Down + closing
- —
- Monthly P&I
- —
- Monthly cashflow
- —
- DSCR
- —
- Eligible?
- —
Short-term bridge; refi at stabilization.
Rent comps 9 comps
| Address | Beds | Baths | Sqft | Rent | $/sqft | DOM | Units | Dist |
|---|---|---|---|---|---|---|---|---|
| 64 E 5th St Unit 1 Oswego, NY | 2.0 | 1.0 | 900 | $1,300 | $1.44 | 43d | 1 | 0.70mi |
| 188 W 2nd St Unit 1 Oswego, NY | 2.0 | 1.0 | 900 | $1,695 | $1.88 | 21d | 1 | 1.21mi |
| 25 W Mohawk St Unit TH Oswego, NY | 3.0 | 1.0 | 1150 | $1,745 | $1.52 | 43d | 1 | 1.22mi |
| 165 W 3rd St Unit 4 Oswego, NY | 2.0 | 1.0 | 1000 | $1,495 | $1.50 | 13d | 1 | 1.23mi |
| 165 W 3rd St Unit 3 Oswego, NY | 2.0 | 1.0 | 1000 | $1,445 | $1.45 | 43d | 1 | 1.23mi |
| 39 W 6th St Unit 2-A Oswego, NY | 3.0 | 1.0 | 1500 | $1,725 | $1.15 | 13d | 1 | 1.25mi |
| 103 W 8th St Unit A Oswego, NY | 4.0 | 2.0 | 1800 | $2,400 | $1.33 | 13d | 1 | 1.39mi |
| 23 NW 9th St Oswego, NY | 4.0 | 1.5 | 1700 | $2,300 | $1.35 | 13d | 1 | 1.45mi |
| 105 W Oneida St Unit A Oswego, NY | 4.0 | 2.0 | 1800 | $2,540 | $1.41 | 13d | 1 | 1.49mi |
Listing history 3 events
-
2026-04-22status Pending
-
2026-04-15$90,000 Active
-
2004-01-13soldstatus $50,000
ⓘ Source: listings_history table (triggers on properties + properties_extension) + one-shot
backfill from property_details.listing_events for pre-trigger history.
Tax reassessment forecast NY · Partial reset (capped growth)
- Current annual tax
- $1,931 · $161/mo
- Projected year-2 tax
- $1,931 · $161/mo
- Expected delta
- $0/yr ($0/mo · 0.0%)
ⓘ Screening estimate from a state-policy table — verify with the county assessor before closing.
Climate risk First Street
- Flood 1/10 Low FEMA zone X (unshaded) · 0% chance over 30 yrs
- Wildfire 2/10 Low
- Heat 2/10 Low 7 d/yr ≥94°F today · 16 d/yr by 30 yrs out
- Wind 1/10 Low 0% chance of damaging wind over 30 yrs
- Air quality 2/10 Low 2 unhealthy d/yr today · 2 by 30 yrs out
Nearby sold comps map
Loading sold comps map…
Walkable amenities ~0.75 mi
Loading nearby amenities…
Taxation est. · year 1
- Rental income
- $37,020
- − Mortgage interest
- −$5,041
- − Property taxes
- −$1,931
- − Insurance
- −$450
- − Repairs & maintenance
- −$2,962
- − Management
- −$2,962
- − Depreciation
- −$2,618
- Taxable income
- $21,056
- Est. tax owed @ 24.0%
- −$5,053
- After-tax cash flow
- $16,147/yr
For passive investors: Depreciation is non-cash, so a rental often shows a tax loss while cash-flowing — sheltering income. Rental losses are passive: they offset passive income freely, and up to $25,000/yr can offset ordinary (W-2) income if you actively participate and your MAGI is under $100k (phasing out to $0 by $150k); unused losses carry forward. On sale, claimed depreciation is recaptured at up to 25%, and gains may owe capital-gains tax (a 1031 exchange can defer both). Figures are a year-1 estimate at your 24.0% rate — not tax advice; consult a CPA.
Schools (NCES district)
- District
- Oswego City School District
- NCES district ID
- 3622050
- Math proficiency
- 39% ▼ -7.00%
- Reading proficiency
- 51% ▲ 9.00%
- Median HH income
- $45,835
- Composite
- 38.2/100
- National rank
- #4257
- State rank
- #465 of 590 in NY
Livability — Oswego
- Score
- 75/100
- State rank
- #265
- US rank
- #4189
Category grades
Schools grade is shown separately in the Schools card above.
Census & demographics
- Census place
- Oswego, NY
- County
- Oswego County · 36,495 people
- City population
- 36,495
- Metro
- Syracuse, NY
- Population (ZIP)
- 36,495
- Household income
- $65,346
- Rent vs Own
- Severe rent burden
- 1341.0
Population outlook (Oswego County) Hauer SSP2
- Today (2025)
- 114,465 people
- By 2030
- 109,968 · -3.9%
- By 2040
- 99,205 · -13.3%
- By 2050
- 87,979 · -23.1%
- By 2075
- 65,100 · -43.1%
- By 2100
- 47,117 · -58.8%
Race, ethnicity, and origin ACS 2023
- Neighborhood character
- Predominantly White (87%)
- Race & ethnicity
- White 87% Hispanic / Latino 5% Two or more races 5% Black 2% Asian 2%
- Hispanic origin (detail)
- Mexican 1% Puerto Rican 2%
- Common ancestry
- Romanian 6% Lithuanian 4% Italian 2%
- Foreign-born
- 3% · Canada
- Languages at home
- 93% English-only · Spanish 3% Other Asian/Pacific 1% Other Indo-European 1%
Political lean MEDSL · Oswego
- 2024 margin
- Strong R (+24.2) · D 37.9% · R 62.1%
- 2008→2024 swing
- -26.6pp toward R · 2008: 2.5pp · 2024: -24.2pp
- All cycles
- 2024: R+24.2 2020: R+20.2 2016: R+23.2 2012: D+7.9 2008: D+2.5
Not yet ingested
- Civics
- —
Market trends
- HPI YoY
- ▼ -2.25%
- Current HPI
- 295.5134
- Rent YoY
- ▲ 19.18%
- Metro
- Syracuse, NY
- State GDP YoY
- ▲ 2.60%
- F500 in state
- 92
Industry mix (Fortune 500 HQ in NY)
| Industry | F500 HQs | Revenue |
|---|---|---|
| Financial Services | 10 | $950B |
|
||
| Consumer Goods | 9 | $162B |
|
||
| Insurance | 4 | $225B |
|
||
| Telecommunications | 2 | $144B |
|
||
| Pharmaceuticals | 2 | $112B |
|
||
| Media / Entertainment | 2 | $69B |
|
||
Price history
+80.0% since first listed3 events — show timeline
- 2026-04-22 Pending — CNYIS
- 2026-04-15 Listed $90,000 CNYIS
- 2004-01-13 Sold (Public Records) $50,000 Public Records
Property tax history
+13.8%/yrLatest (2025): $1,931 · +17.7% YoY. Source: county tax records.
Cash-flow waterfall
monthlySold comps — $/sqft
last 12 mo · ≤1 miLoading sold comps…