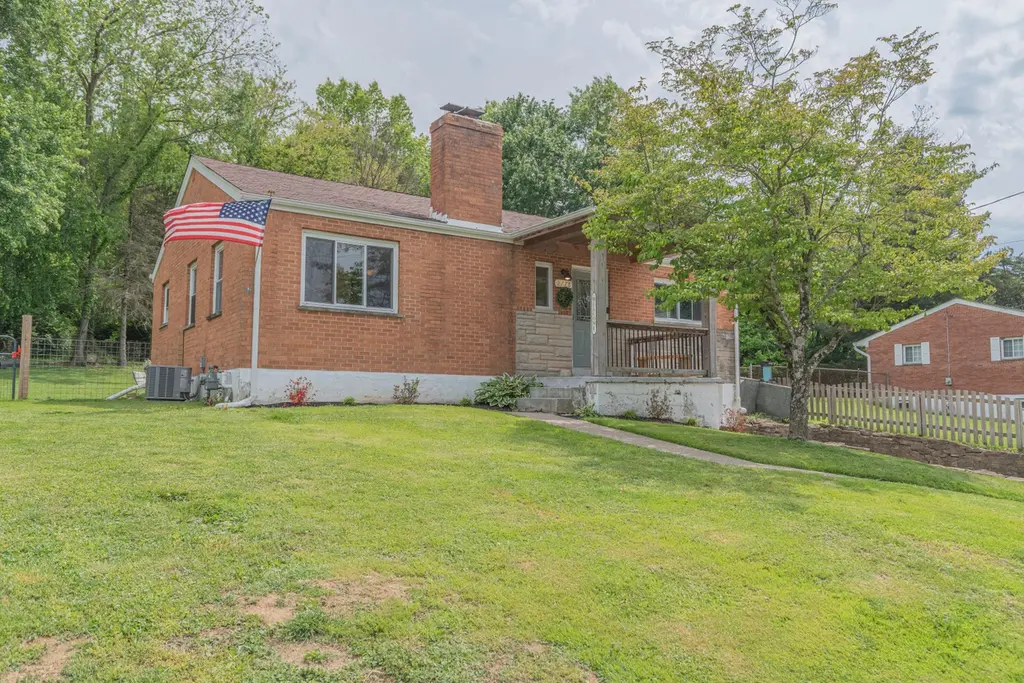
2778 Coral Dr · Hebron, KY
Flood risk 1/10 · Minimal
- FEMA flood zone
- X (unshaded)
- Chance of flooding over 30 yrs
- 0.0%
- Est. flood insurance / yr
- $473 – $860
Fire risk 1/10 · Minimal
- Est. fire insurance / yr
- $839 – $1,559
Heat risk 3/10 · Minor
- Hot days now (above 101°F)
- 7 days/yr
- Hot days in 30 yrs
- 18 days/yr
Wind risk 2/10 · Minimal
- Chance of severe wind over 30 yrs
- 1.0%
Air-quality risk 2/10 · Minimal
- Unhealthy air days now
- 1 days/yr
- Unhealthy air days in 30 yrs
- 2 days/yr
Risk factors via First Street. Map © Google.
Why this score? — see what drove the D grade
The composite is a weighted blend of 9 inputs, each scored 0–100. Each bar is that input's sub-score; the figure is the points it added to the 100-point composite (weight × sub-score).
- Cash flow +14.0/30.0
- ARV discount +10.2/15.0
- DSCR +4.3/10.0
- Schools +4.1/10.0
- Livability +4.0/5.0
- 1% rule +3.0/10.0
- Rent growth +2.5/5.0
- Condition / age +2.5/5.0
- Appreciation +0.0/10.0
$250,000
🖨 Deal sheet 📄 Offer letter ✓ Due diligence
Listing remarks MLS
If you are looking for a gorgeous home then here it is. USDA eligible for 100% financing, New roof, refinished hardwood floors, new kitchen with stainless appliances, new porch and deck, huge new driveway. All new lighting, paint and flooring. Full basement and 1 car garage. 1 year home warranty and immediate occupancy.
Key facts
- Double driveway
- Large patio
- Convenient location
Tags
Property features AI
Exterior
- Parking: Driveway; Detached garage facing front; Off-street parking; 1-car garage
- Security: Smoke detectors
- Utilities: Public water; Public sewer
- Home design: Single-family house; One level; Built in 1950; Has a view
- Construction: Brick construction; Asphalt shingle roof; Block foundation
- Exterior features: Covered patio and porch; Porch; Private yard; Vinyl window frames; Paved road access
Interior
- Kitchen: Stainless steel appliances; Electric oven; Electric range; Refrigerator
- Bedrooms: Primary bedroom (13 x 13); Bedroom 2 (13 x 11); Bedroom 3 (11 x 9)
- Bathrooms: 1 full bathroom (primary bath 8 x 6)
- Heating & cooling: Forced air heating; Central air conditioning
- Interior features: Eat-in kitchen; Ceiling fans; Natural woodwork; Recessed lighting; Stone wood-burning fireplace
- Laundry & utility: Laundry located in basement / lower level
Neighborhood map
What this means for you Summary
Snapshot
- This is a 3-bed/1.0-bath single-family listed at $250k.
Deal economics
- At list price, monthly cash flow is $33 ($401/yr) — positive.
- The deal already cash-flows at list — no discount required.
- To meet the 1% rule (rent ≥ 1% of price), the offer needs to be $200k (20.1% below list).
- Recommended offer: $200k (20.1% below list) — sets the bar for 1% rule.
- Cap rate 6.5% vs local median 3.8% in Hebron — top-decile yield for the area; either an underpriced asset or a hidden risk that comps aren't pricing in. Stress-test before assuming the spread holds.
Location & tenants
- Location reads 80/100 on livability (#69 in KY, #1,700 nationally) — a professional / high-income tenant draw. Strengths: crime A+, employment A+, cost of living A+; Watch: amenities F, commute F.
- Boone County (suburban): math 43% / reading 49% proficiency, ranked #12 of 165 in KY (top 7%) — families likely to look elsewhere, expect single-tenant / working-renter base with shorter leases.
- Zoned schools: Thornwilde Elementary School (math 57% / reading 59%, grade C+, #43 of 676 statewide, top 6%, 624 students, 28% FRL); Conner Middle School (math 50% / reading 62%, grade B-, #6 of 217 statewide, top 2%, 896 students, 35% FRL); Conner High School (math 47% / reading 51%, grade D, #15 of 254 statewide, top 6%, 1,443 students, 33% FRL) — zoned schools at 32% FRL track the district average.
- Market conditions: 198 active listings in the ZIP; 2 comparable units currently listed for rent nearby; high-income renter base; 1,430 units permitted in Boone County in 2024 (928 in 5+ unit buildings).
- This rent is only 17% of the median local income ($137k/yr) — well below the 30% rent-burden line; pricing power to push rent on renewal without tenant pushback.
Forward outlook
- Local home prices are declining (-3.0%/yr); year-one equity from $2k of loan paydown is wiped out by about $8k of value loss. Plan a longer hold.
- Boone County population projected at +24% by 2050 — long-run rental-demand tailwind backs the buy-and-hold thesis.
Negotiation context
- Only 3 days on market — expect competitive offers; lowballing is unlikely to land.
- 5 sale attempts since 26y ago with the ask held roughly flat each time — persistent listings suggest the price (not the market) is what's stuck; bring a comps-based counter.
- Current owner paid $139k; list at $250k implies a 80% gain — meaningful room to come down on a strong offer.
Risks & watch-outs
- Watch-outs: built in 1950 — expect roof / HVAC / electrical / plumbing capex.
Questions for the listing agent
- Built in 1950 — when were the roof, HVAC, electrical panel, plumbing, and water heater last replaced?
- Is there a deadline driving the sale (1031 exchange, divorce, estate, relocation)? That informs how much negotiation room exists.
- Schools are A-rated — typically a magnet for longer-tenancy family renters. What's the average tenant stay here, and is there a school-zone premium baked into asking?
- The area grade is low — what's the realistic commute time and amenity access for the typical tenant pool here? Any planned neighborhood developments (good or bad) we should know about?
- What's the average days-on-market for RENTAL listings here right now (not sales)? A rising rental-DOM trend means longer vacancies and softer asking-rent achievability than the comps imply.
- What's the recent tenant-quality profile in this submarket — average credit score on applications, eviction rate, late-payment / NSF rate, and stable-employment percentage? A property-management company in the area should have these aggregated.
- How much new for-sale + rental construction is in the pipeline within 1–3 miles? Heavy new supply typically softens prices + rents 12–24 months out; constrained supply supports both.
Investment metrics
- 1% rule
- 0.80% ✗
- Cap rate
- 6.45%
- Cash-on-cash
- 0.57%
- DSCR
- 1.03
- GRM
- 10.4
CMA / ARV
- ARV (on-the-fly)
- $266,000
- Comps found
- 10
Show comp detail 10 sales within ~0.75 mi
| Address | Dist | Beds/Ba | Sqft | Sold | Price | $/sf | Match |
|---|---|---|---|---|---|---|---|
| 2728 Coral Dr | 0.10mi | 3/1.0 | 1,216 (+14%) | 8mo | $245,000 | $201 | 65 |
| 1852 Princess Ct | 0.51mi | 3/2.0 | 1,023 (-4%) | 7mo | $272,000 | $266 | 60 |
| 2975 Ridge Ave | 0.41mi | 3/1.0 | 1,176 (+10%) | 5mo | $251,500 | $214 | 59 |
| 2759 Ridgefield Dr | 0.70mi | 3/2.5 | 1,018 (-4%) | 6mo | $236,000 | $232 | 49 |
| 2867 Donjoy Dr | 0.62mi | 3/2.5 | 1,062 (-0%) | 21mo | $285,000 | $268 | 48 |
| 1769 Elijah Creek Rd | 0.66mi | 3/2.0 | 1,052 (-1%) | 20mo | $255,000 | $242 | 46 |
| 2521 Hilliard Dr | 0.70mi | 3/2.0 | 1,023 (-4%) | 13mo | $275,000 | $269 | 46 |
| 2509 Hilliard Dr | 0.73mi | 3/2.5 | 1,080 (+2%) | 14mo | $270,000 | $250 | 46 |
| 2620 Berwood Ln | 0.73mi | 3/2.5 | 1,028 (-3%) | 14mo | $245,000 | $238 | 43 |
| 1774 Asbury Way | 0.69mi | 3/2.0 | 987 (-7%) | 11mo | $265,000 | $268 | 43 |
Match score weights: distance 35% · size 25% · config 20% · recency 20%. Top-matched comps best support the ARV.
Projected returns pro-forma
-3.0% appreciation · 3.0% rent growth · sell at horizon
- IRR
- -15.4%
- Equity multiple
- 0.45×
- Total profit
- $-38,465
- Equity at exit
- $37,276
- IRR
- -7.0%
- Equity multiple
- 0.56×
- Total profit
- $-31,090
- Equity at exit
- $21,615
Cash invested: $70,000 (down + closing). Projections, not guarantees.
Landlord ↔ Tenant lean methodology
- Overall (STATE)
- 83 Strongly Landlord-Friendly
- State Kentucky
- 83 Strongly Landlord-Friendly · R+16
- County
- — inherits STATE
- City
- — inherits STATE
ZIP-level market 41048
- Home prices YoY
- -31.1%
- Active inventory
- 198
- Price-to-rent
- 10.4×
Monthly cashflow live
- Estimated rent
- $1,997 medium interval (Pro) →
- Mortgage (P&I)
- −$1,311
- Tax from tax record
- −$129 /mo · $1,545/yr
- Insurance
- −$104
- HOA
- −$0
- Vacancy / Maint / Mgmt
- −$419
- Net cashflow
- $33
Break-even live
UW: 25.0% down · 7.5% · 30yr · 1.5% tax · 5.0% vac · 8.0% maint · 8.0% mgmt
Financing live
Cash to close
- Down payment
- $62,500
- Closing costs
- $7,500
- Reserves months
- —
- Total cash needed
- —
Loan-product check · same deal, 3 products live
Conventional
25% down · 7.5% · 30yr
- Down + closing
- —
- Monthly P&I
- —
- Monthly cashflow
- —
- DSCR
- —
- Eligible?
- —
Personal DTI + credit; lowest rate.
DSCR
20% down · 8.5% · 30yr
- Down + closing
- —
- Monthly P&I
- —
- Monthly cashflow
- —
- DSCR
- —
- Eligible?
- —
No personal income docs; deal must DSCR.
Hard money
10% down · 12.0% · 12mo
- Down + closing
- —
- Monthly P&I
- —
- Monthly cashflow
- —
- DSCR
- —
- Eligible?
- —
Short-term bridge; refi at stabilization.
Rent comps 2 comps
| Address | Beds | Baths | Sqft | Rent | $/sqft | DOM | Units | Dist |
|---|---|---|---|---|---|---|---|---|
| 3465 Hebron Station Dr Hebron, KY | 1.0–2.0 | 1.0–2.0 | 819 | $1,510 | $1.84 | 2d | 20 | 0.70mi |
| 2375 S Park Dr Hebron, KY | 2.0 | 1.0 | 821 | $1,267 | $1.54 | 1d | 3 | 1.08mi |
Listing history 13 events
-
2026-05-10status Pending
-
2026-05-07$250,000 Active
-
2018-06-26soldstatus $139,000
-
2018-06-22soldstatus $139,000 326-char remark
Show marketing remark (326 chars)
If you are looking for a gorgeous home then here it is. USDA eligible for 100% financing, New roof, refinished hardwood floors, new kitchen with stainless appliances, new porch and deck, huge new driveway. All new lighting, paint and flooring. Full basement and 1 car garage. 1 year home warranty and immediate occupancy.
-
2018-03-02$139,900 326-char remark
Show marketing remark (326 chars)
If you are looking for a gorgeous home then here it is. USDA eligible for 100% financing, New roof, refinished hardwood floors, new kitchen with stainless appliances, new porch and deck, huge new driveway. All new lighting, paint and flooring. Full basement and 1 car garage. 1 year home warranty and immediate occupancy.
-
2017-10-26soldstatus $71,500 162-char remark
Show marketing remark (162 chars)
Brick ranch with 5 rooms, 3 bedrooms, 1 bath. Full basement, 1 car built in garage. Hardwood floors. Fireplace. Some of the rehab is completed. Great opportunity.
-
2017-07-03$71,900 162-char remark
Show marketing remark (162 chars)
Brick ranch with 5 rooms, 3 bedrooms, 1 bath. Full basement, 1 car built in garage. Hardwood floors. Fireplace. Some of the rehab is completed. Great opportunity.
-
2017-05-25soldstatus $56,000
-
2007-01-14historical
-
2006-07-13$120,000
-
2000-07-25soldstatus $70,000
-
2000-07-21soldstatus $70,000
-
2000-06-05$74,900
ⓘ Source: listings_history table (triggers on properties + properties_extension) + one-shot
backfill from property_details.listing_events for pre-trigger history.
Tax reassessment forecast KY · Resets to sale price
- Current annual tax
- $1,545 · $129/mo
- Projected year-2 tax
- $2,150 · $179/mo
- Expected delta
- +$605/yr (+$50/mo · 39.2%)
ⓘ Screening estimate from a state-policy table — verify with the county assessor before closing.
Climate risk First Street
- Flood 1/10 Low FEMA zone X (unshaded) · 0% chance over 30 yrs
- Wildfire 1/10 Low
- Heat 3/10 Moderate 7 d/yr ≥101°F today · 18 d/yr by 30 yrs out
- Wind 2/10 Low 100% chance of damaging wind over 30 yrs
- Air quality 2/10 Low 1 unhealthy d/yr today · 2 by 30 yrs out
Nearby sold comps map
Loading sold comps map…
Walkable amenities ~0.75 mi
Loading nearby amenities…
Taxation est. · year 1
- Rental income
- $23,960
- − Mortgage interest
- −$14,004
- − Property taxes
- −$1,545
- − Insurance
- −$1,250
- − Repairs & maintenance
- −$1,917
- − Management
- −$1,917
- − Depreciation
- −$7,273
- Taxable loss
- −$3,945
- Est. tax savings @ 24.0%
- +$947
- After-tax cash flow
- $1,348/yr
For passive investors: Depreciation is non-cash, so a rental often shows a tax loss while cash-flowing — sheltering income. Rental losses are passive: they offset passive income freely, and up to $25,000/yr can offset ordinary (W-2) income if you actively participate and your MAGI is under $100k (phasing out to $0 by $150k); unused losses carry forward. On sale, claimed depreciation is recaptured at up to 25%, and gains may owe capital-gains tax (a 1031 exchange can defer both). Figures are a year-1 estimate at your 24.0% rate — not tax advice; consult a CPA.
Schools (NCES district)
- District
- Boone County
- NCES district ID
- 2100510
- Math proficiency
- 43% ▼ -10.00%
- Reading proficiency
- 49% ▼ -12.00%
- Median HH income
- $68,096
- Composite
- 41.18/100
- National rank
- #3550
- State rank
- #12 of 165 in KY
Livability — Hebron
- Score
- 80/100
- State rank
- #69
- US rank
- #1700
Category grades
Schools grade is shown separately in the Schools card above.
Census & demographics
- Census place
- Hebron, KY
- County
- Boone County · 99,563 people
- City population
- 16,211
- Metro
- Cincinnati, OH-KY-IN
- Population (ZIP)
- 16,211
- Household income
- $137,398
- Rent vs Own
- Severe rent burden
- 169.0
Population outlook (Boone County) Hauer SSP2
- Today (2025)
- 144,066 people
- By 2030
- 152,005 · +5.5%
- By 2040
- 166,776 · +15.8%
- By 2050
- 178,974 · +24.2%
- By 2075
- 204,515 · +42.0%
- By 2100
- 215,306 · +49.4%
Race, ethnicity, and origin ACS 2023
- Neighborhood character
- Predominantly White (86%)
- Race & ethnicity
- White 86% Hispanic / Latino 7% Two or more races 6% Asian 2% Black 2%
- Hispanic origin (detail)
- Mexican 3% Puerto Rican 2%
- Common ancestry
- Slovak 2% Lithuanian 2% Scottish 2%
- Foreign-born
- 6% · Canada
- Languages at home
- 91% English-only · Spanish 5% Other Indo-European 1% German/W. Germanic 1%
Political lean MEDSL · Boone
- 2024 margin
- Solid R (+37.2) · D 30.6% · R 67.8% · Other 1.7%
- 2008→2024 swing
- -2.7pp toward R · 2008: -34.5pp · 2024: -37.2pp
- All cycles
- 2024: R+37.2 2020: R+35.7 2016: R+41.8 2012: R+38.7 2008: R+34.5
Not yet ingested
- Civics
- —
Market trends
- HPI YoY
- ▼ -85.70%
- Current HPI
- 189.8568
- Rent YoY
- —
- Metro
- Cincinnati, OH-KY-IN
- State GDP YoY
- ▲ 1.81%
- F500 in state
- 4
Industry mix (Fortune 500 HQ in KY)
| Industry | F500 HQs | Revenue |
|---|---|---|
| Healthcare | 1 | $118B |
|
||
| Food / Beverage | 1 | $7B |
|
||
Price history
+233.8% since first listed13 events — show timeline
- 2026-05-10 Pending — NKMLS
- 2026-05-07 Listed $250,000 NKMLS
- 2018-06-26 Sold (Public Records) $139,000 Public Records
- 2018-06-22 Sold (MLS) $139,000 NKMLS
- 2018-03-02 Listed $139,900 NKMLS
- 2017-10-26 Sold (MLS) $71,500 NKMLS
- 2017-07-03 Listed $71,900 NKMLS
- 2017-05-25 Sold (Public Records) $56,000 Public Records
- 2007-01-14 Listing Removed — NKMLS
- 2006-07-13 Listed $120,000 NKMLS
- 2000-07-25 Sold (Public Records) $70,000 Public Records
- 2000-07-21 Sold (MLS) $70,000 NKMLS
- 2000-06-05 Listed $74,900 NKMLS
Property tax history
+5.8%/yrLatest (2025): $1,545 · +1.7% YoY. Source: county tax records.
Cash-flow waterfall
monthlySold comps — $/sqft
last 12 mo · ≤1 miLoading sold comps…