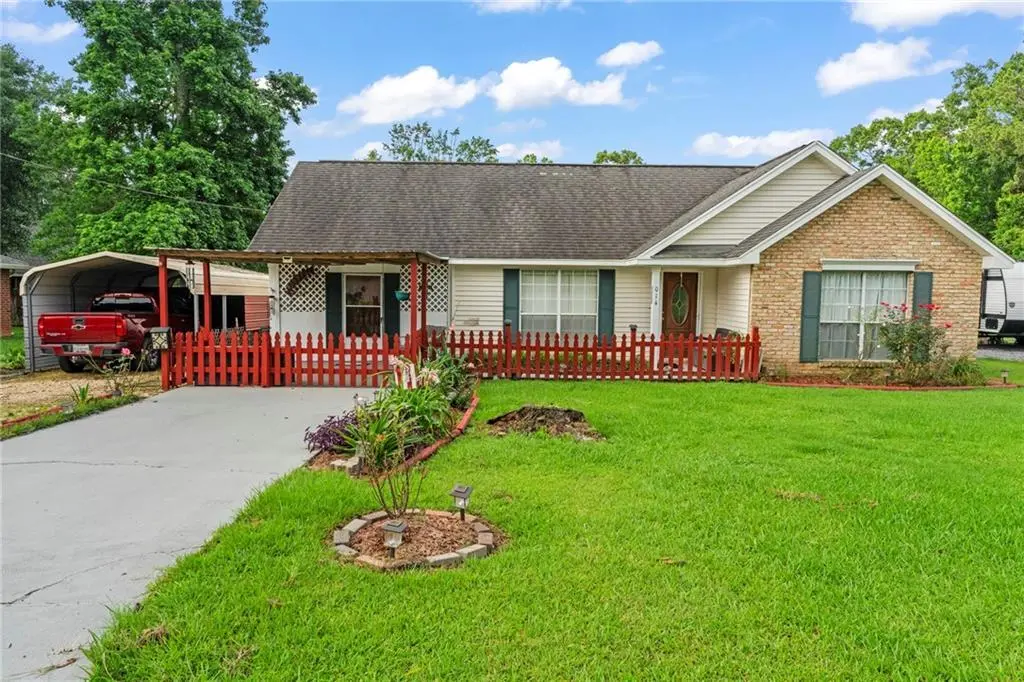
1014 Carter St · Franklinton, LA
Flood risk 1/10 · Minimal
- FEMA flood zone
- X (unshaded)
- Chance of flooding over 30 yrs
- 0.0%
- Est. flood insurance / yr
- $507 – $1,088
Fire risk 4/10 · Minor
- Est. fire insurance / yr
- $1,269 – $2,357
Heat risk 8/10 · Major
- Hot days now (above 109°F)
- 7 days/yr
- Hot days in 30 yrs
- 21 days/yr
Wind risk 9/10 · Severe
- Chance of severe wind over 30 yrs
- 99.0%
Air-quality risk 1/10 · Minimal
- Unhealthy air days now
- 0 days/yr
- Unhealthy air days in 30 yrs
- 0 days/yr
Risk factors via First Street. Map © Google.
Why this score? — see what drove the C grade
The composite is a weighted blend of 9 inputs, each scored 0–100. Each bar is that input's sub-score; the figure is the points it added to the 100-point composite (weight × sub-score).
- Cash flow +20.2/30.0
- ARV discount +15.0/15.0
- DSCR +6.4/10.0
- 1% rule +4.6/10.0
- Livability +3.5/5.0
- Schools +2.8/10.0
- Rent growth +2.5/5.0
- Condition / age +2.5/5.0
- Appreciation +0.0/10.0
$157,000
🖨 Deal sheet 📄 Offer letter ✓ Due diligence
Listing remarks MLS
Cute and Cozy, this two-bedroom, one bath gem offers an open-concept design seamlessly connecting the kitchen, dining, and living areas, creating an inviting space for everyday living and entertaining. The former garage has been converted into additional living space providing flexibility for a family room, home office, hobby area, or third bedroom. Enjoy the fenced-in patio for outdoor relaxation. Back porch and carport as well. Great curb appeal with a paved drive and easy access to local amenities, this property is ready for it's new owner.
Key facts
- Open-concept design
- Fenced-in patio
- Converted garage
Tags
Property features AI
Exterior
- Parking: Carport; Off-street parking; Driveway
- Security: Smoke detector(s)
- Utilities: Public water; Public sewer
- Home design: Single-story home; Very good condition; Slab foundation
- Construction: Brick and vinyl siding construction; Shingle roof; Built on slab foundation
- Exterior features: Enclosed porch; Covered porch; Screened porch; Permeable paving; City lot; Rectangular lot; Lot dimensions 80x100
Interior
- Kitchen: Dishwasher; Oven; Range; Refrigerator
- Bathrooms: 1 full bathroom
- Heating & cooling: Central heating; Central air; Window unit(s)
- Interior features: Attic; Tray ceilings; Ceiling fans; Pull-down attic stairs
- Laundry & utility: Washer hookup; Dryer hookup
Neighborhood map
What this means for you Summary
Snapshot
- This is a 2-bed/1.0-bath single-family listed at $157k.
Deal economics
- At list price, monthly cash flow is $198 ($2k/yr) — positive.
- The deal already cash-flows at list — no discount required.
- To meet the 1% rule (rent ≥ 1% of price), the offer needs to be $150k (4.5% below list).
- Recommended offer: $150k (4.5% below list) — sets the bar for 1% rule.
- Cap rate 7.8% vs local median 5.3% in Franklinton — top-decile yield for the area; either an underpriced asset or a hidden risk that comps aren't pricing in. Stress-test before assuming the spread holds.
Location & tenants
- Location reads 69/100 on livability (#67 in LA) — a middle-class / working-renter tenant base. Strengths: cost of living A+, health & safety A+, crime B; Watch: amenities F, commute F, employment F.
- Washington Parish (rural): math 27% / reading 41% proficiency, ranked #38 of 98 in LA (top 39%) — families likely to look elsewhere, expect single-tenant / working-renter base with shorter leases; 77% free/reduced lunch — lower-income household profile, screen leases tightly.
- Market conditions: 246 active listings in the ZIP; 1 comparable units currently listed for rent nearby; 10 units permitted in Washington Parish in 2024 (0 in 5+ unit buildings).
Forward outlook
- Local home prices are declining (-3.0%/yr); year-one equity from $1k of loan paydown is wiped out by about $5k of value loss. Plan a longer hold.
- Washington County population projected at -16% by 2050 — secular population decline; favor cash flow + early exit over multi-decade hold.
Negotiation context
- It's been on market 17 days — a 2% lower offer ($155k) is reasonable based on typical stale-listing flexibility.
- 10 sale attempts since 14y ago with the ask held roughly flat each time — persistent listings suggest the price (not the market) is what's stuck; bring a comps-based counter.
- Current owner paid $130k; 21% above their basis — modest negotiation headroom, anchor on the comps not their cost.
Risks & watch-outs
- Climate carrying-cost: severe wind risk, 99% chance of damaging wind over 30y; extreme-heat days projected 7→21/yr by 2055 (HVAC capex compounding) — expect insurance premiums to compound above CPI over the hold.
Questions for the listing agent
- Is there a deadline driving the sale (1031 exchange, divorce, estate, relocation)? That informs how much negotiation room exists.
- What's the average days-on-market for RENTAL listings here right now (not sales)? A rising rental-DOM trend means longer vacancies and softer asking-rent achievability than the comps imply.
- What's the recent tenant-quality profile in this submarket — average credit score on applications, eviction rate, late-payment / NSF rate, and stable-employment percentage? A property-management company in the area should have these aggregated.
- How much new for-sale + rental construction is in the pipeline within 1–3 miles? Heavy new supply typically softens prices + rents 12–24 months out; constrained supply supports both.
Investment metrics
- 1% rule
- 0.96% ✗
- Cap rate
- 7.80%
- Cash-on-cash
- 5.40%
- DSCR
- 1.24
- GRM
- 8.7
CMA / ARV
- ARV (on-the-fly)
- $203,112
- Comps found
- 3
Show comp detail 3 sales within ~0.75 mi
| Address | Dist | Beds/Ba | Sqft | Sold | Price | $/sf | Match |
|---|---|---|---|---|---|---|---|
| 30206 Karsyn Dr | 0.67mi | 3/2.0 (+1) | 1,100 (+1%) | 8mo | $205,000 | $186 | 52 |
| 1605 Bickham St | 0.62mi | 3/2.0 (+1) | 1,180 (+8%) | 2mo | $102,000 | $86 | 47 |
| 1324 Hunt St | 0.59mi | 2/1.5 | 952 (-13%) | 19mo | $178,125 | $187 | 33 |
Match score weights: distance 35% · size 25% · config 20% · recency 20%. Top-matched comps best support the ARV.
Projected returns pro-forma
-3.0% appreciation · 3.0% rent growth · sell at horizon
- IRR
- -8.0%
- Equity multiple
- 0.71×
- Total profit
- $-12,890
- Equity at exit
- $23,409
- IRR
- 1.6%
- Equity multiple
- 1.11×
- Total profit
- $4,832
- Equity at exit
- $13,574
Cash invested: $43,960 (down + closing). Projections, not guarantees.
Landlord ↔ Tenant lean methodology
- Overall (STATE)
- 90 Strongly Landlord-Friendly
- State Louisiana
- 90 Strongly Landlord-Friendly · R+12
- County
- — inherits STATE
- City
- — inherits STATE
ZIP-level market 70438
- Home prices YoY
- -14.2%
- Active inventory
- 246
- Price-to-rent
- 8.7×
Monthly cashflow live
- Estimated rent
- $1,500 medium interval (Pro) →
- Mortgage (P&I)
- −$823
- Tax from tax record
- −$99 /mo · $1,183/yr
- Insurance
- −$65
- HOA
- −$0
- Vacancy / Maint / Mgmt
- −$315
- Net cashflow
- $198
Break-even live
UW: 25.0% down · 7.5% · 30yr · 1.5% tax · 5.0% vac · 8.0% maint · 8.0% mgmt
Financing live
Cash to close
- Down payment
- $39,250
- Closing costs
- $4,710
- Reserves months
- —
- Total cash needed
- —
Loan-product check · same deal, 3 products live
Conventional
25% down · 7.5% · 30yr
- Down + closing
- —
- Monthly P&I
- —
- Monthly cashflow
- —
- DSCR
- —
- Eligible?
- —
Personal DTI + credit; lowest rate.
DSCR
20% down · 8.5% · 30yr
- Down + closing
- —
- Monthly P&I
- —
- Monthly cashflow
- —
- DSCR
- —
- Eligible?
- —
No personal income docs; deal must DSCR.
Hard money
10% down · 12.0% · 12mo
- Down + closing
- —
- Monthly P&I
- —
- Monthly cashflow
- —
- DSCR
- —
- Eligible?
- —
Short-term bridge; refi at stabilization.
Rent comps 1 comps
| Address | Beds | Baths | Sqft | Rent | $/sqft | DOM | Units | Dist |
|---|---|---|---|---|---|---|---|---|
| 331 Main St Franklinton, LA | 3.0 | 2.0 | 1399 | $1,500 | $1.07 | 23d | 1 | 1.17mi |
Listing history 12 events
-
2026-06-18days on market $157,000 Active 17 DOM
-
2026-06-17days on market $157,000 Active 16 DOM
-
2026-06-16days on market $157,000 Active 15 DOM
-
2026-06-15days on market $157,000 Active 14 DOM
-
2026-06-13days on market $157,000 Active 12 DOM
-
2026-06-10days on market $157,000 Active 9 DOM
-
2026-06-09days on market $157,000 Active 8 DOM
-
2026-06-08days on market $157,000 Active 7 DOM
-
2026-06-07days on market $157,000 Active 6 DOM
-
2026-06-03days on market $157,000 Active 2 DOM
-
2026-06-02remarks 549-char remark
-
2026-06-02$157,000 Active 1 DOM
ⓘ Source: listings_history table (triggers on properties + properties_extension) + one-shot
backfill from property_details.listing_events for pre-trigger history.
Tax reassessment forecast LA · Resets to sale price
- Current annual tax
- $1,183 · $99/mo
- Projected year-2 tax
- $1,183 · $99/mo
- Expected delta
- $0/yr ($0/mo · 0.0%)
ⓘ Screening estimate from a state-policy table — verify with the county assessor before closing.
Climate risk First Street
- Flood 1/10 Low FEMA zone X (unshaded) · 0% chance over 30 yrs
- Wildfire 4/10 Moderate
- Heat 8/10 Severe 7 d/yr ≥109°F today · 21 d/yr by 30 yrs out
- Wind 9/10 Extreme 99% chance of damaging wind over 30 yrs
- Air quality 1/10 Low 0 unhealthy d/yr today · 0 by 30 yrs out
Nearby sold comps map
Loading sold comps map…
Walkable amenities ~0.75 mi
Loading nearby amenities…
Taxation est. · year 1
- Rental income
- $18,000
- − Mortgage interest
- −$8,794
- − Property taxes
- −$1,183
- − Insurance
- −$785
- − Repairs & maintenance
- −$1,440
- − Management
- −$1,440
- − Depreciation
- −$4,567
- Taxable loss
- −$210
- Est. tax savings @ 24.0%
- +$50
- After-tax cash flow
- $2,422/yr
For passive investors: Depreciation is non-cash, so a rental often shows a tax loss while cash-flowing — sheltering income. Rental losses are passive: they offset passive income freely, and up to $25,000/yr can offset ordinary (W-2) income if you actively participate and your MAGI is under $100k (phasing out to $0 by $150k); unused losses carry forward. On sale, claimed depreciation is recaptured at up to 25%, and gains may owe capital-gains tax (a 1031 exchange can defer both). Figures are a year-1 estimate at your 24.0% rate — not tax advice; consult a CPA.
Schools (NCES district)
- District
- Washington Parish
- NCES district ID
- 2201860
- Math proficiency
- 27% ▼ -34.00%
- Reading proficiency
- 41% ▼ -29.00%
- Median HH income
- $34,972
- Composite
- 28.03/100
- National rank
- #6844
- State rank
- #38 of 98 in LA
Livability — Franklinton
- Score
- 69/100
- State rank
- #67
- US rank
- #8352
Category grades
Schools grade is shown separately in the Schools card above.
Census & demographics
- Census place
- Franklinton, LA
- Population (ZIP)
- 19,935
Population outlook (Washington County) Hauer SSP2
- Today (2025)
- 44,642 people
- By 2030
- 43,302 · -3.0%
- By 2040
- 40,345 · -9.6%
- By 2050
- 37,434 · -16.1%
- By 2075
- 29,954 · -32.9%
- By 2100
- 21,579 · -51.7%
Race, ethnicity, and origin ACS 2023
- Neighborhood character
- Predominantly White (73%)
- Race & ethnicity
- White 73% Black 22% Two or more races 4% Hispanic / Latino 2%
- Common ancestry
- Lithuanian 9% Slovak 2% German 1%
- Foreign-born
- 0% · Canada
- Languages at home
- 98% English-only · French/Haitian/Cajun 1%
Political lean MEDSL · Washington
- 2024 margin
- Solid R (+40.3) · D 29.3% · R 69.6% · Other 1.1%
- 2008→2024 swing
- -7.6pp toward R · 2008: -32.7pp · 2024: -40.3pp
- All cycles
- 2024: R+40.3 2020: R+37.6 2016: R+36.8 2012: R+28.3 2008: R+32.7
Not yet ingested
- Civics
- —
Market trends
- HPI YoY
- ▼ -31.73%
- Current HPI
- 191.4762
- Rent YoY
- —
- Metro
- —
- State GDP YoY
- ▲ 3.29%
- F500 in state
- 10
Industry mix (Fortune 500 HQ in LA)
| Industry | F500 HQs | Revenue |
|---|---|---|
| Telecommunications | 2 | $23B |
|
||
| Utilities | 1 | $12B |
|
||
| Wholesale / Distribution | 1 | $5B |
|
||
| Advertising | 1 | $2B |
|
||
Price history
+58.6% since first listed17 events — show timeline
- 2026-06-01 Listed $157,000 AcadianaMLS
- 2026-06-01 Listed $157,000 GSREIN
- 2022-06-10 Sold (MLS) $130,000 GSREIN
- 2022-03-28 Pending — GSREIN
- 2022-03-18 Listed $135,000 AcadianaMLS
- 2022-03-18 Listed $135,000 GSREIN
- 2021-07-16 Listed $135,000 AcadianaMLS
- 2018-10-25 Price Changed $115,000 GSREIN
- 2018-10-24 Price Changed $114,000 GSREIN
- 2018-09-22 Listed $115,000 AcadianaMLS
- 2015-02-23 Sold (Public Records) $77,500 Public Records
- 2015-02-20 Sold (MLS) $77,500 GSREIN
- 2014-08-24 Listed $80,000 AcadianaMLS
- 2014-08-24 Listed $80,000 GSREIN
- 2012-08-10 Listed $99,000 GSREIN
- 2012-08-10 Listed $99,000 AcadianaMLS
- 2006-06-23 Sold (Public Records) — Public Records
Property tax history
+4.2%/yrLatest (2025): $1,183 · +0.4% YoY. Source: county tax records.
Cash-flow waterfall
monthlySold comps — $/sqft
last 12 mo · ≤1 miLoading sold comps…